It had been established that ABO blood group system associated with some diseases or disorders. The objective of this study was to determine the effect of ABO blood group on anthropometric indices among apparently healthy young adults of Yoruba ethnicity.
Eighty apparently healthy young adults who were purposely selected participated in the study after screening for the ABO blood groups following the standard protocol. They were divided into four equal groups; 20 in each of blood groups A, B, AB and O who were age- and sex- matched. The weight (kg) and height (cm) of the participants were measured following standard protocol. Body mass index (BMI) and body surface area (BSA) were estimated from weight and height using Quetelex and Mosteller formulae respectively. Chi square was used to compare grouped data while comparison of means of parameters among the four blood groups was done using Analysis of Variance (ANOVA). A p-value of < 0.05 was taken statistically significant.
Out of the total 80 participants, 15% were males. The mean ± SD of height (m) of participants with blood groups A, B, O and AB were 1.65 ± 0.06, 1.63 ± 0.08, 1.62 ± 0.08 and 1.63 ± 0.08 (F = 0.349, p = 0.790) respectively. The mean ± SD of weight (kg) of the participants with blood group A, B, O and AB were 56.15 ± 8.71, 56.00 ± 11.21, 57.10 ± 12.73 and 58.05 ± 10.35 (F = 0.154, p = 0.927) respectively. The mean ± SD of BMI in kg/m2 for blood groups A, B, O and AB were 20.74 ± 3.22, 20.86 ± 2.91, 21.79 ± 5.10 and 21.91 ± 4.21 (F = 0.472, p = 0.703) respectively while the mean ± SD of BSA (m2) for blood group A, B, O and AB were 1.60 ± 0.12, 1.59 ± 0.19, 1.60 ± 0.18 and 1.62 ± 0.15 (F = 0.098, p = 0.961) respectively.
Blood group AB is associated with weight, BSA and BMI than any other blood group.
ABO blood groups, Anthropometry, Young adults, Ethnicity
The ABO blood group system was the first and most important human blood group system [1]. It was credited to be discovered by Karl Landsteiner in 1900 [2]. The ABO blood group system is unique in immunology and haematology because it is the only system in which antibodies are consistently and predictably present in the serum of normal individuals whose red cells lack the antigens [3]. The antibody production becomes detectable at three to six months of age [4]. Several epidemiological studies have reported that the distribution of different ABO blood groups vary markedly among the populations of different geographical areas reflecting racial differences [5-7]. Human blood groups are genetically determined antigens expressed on the surface of red blood cells [8]. The antigens may also be found in body fluids (urine, saliva and amniotic fluid) of secretors [9]. Blood groups may also be expressed on organ cellular surfaces. The association between ABO blood groups and disease susceptibility has generated a lot of interest [10-17]. Its association with anthropometric indices among young adults is rarely studied in Nigeria. Body mass index (BMI) is regarded as most popular among the anthropometric indices. It is an internationally accepted index for assessing obesity [18-20]. Age and ethnicity had been reported to play significant role in the anthropometric dimensions [21,22]. BMI as a trait is determined not only by environmental factors but also largely by interaction with inherited genetic factors [23]. Several studies have indicated that genetic factors account for a substantial portion of variation in human adiposity [24-26]. The ABO blood group system is known to be one of such genetic make-up of an individual that may provide much valuable information for early detection of vulnerable groups for abnormal BMI such as obesity [27]. Data is sparsed with regards to the association between ABO blood group and anthropometric indices among young adults of Yoruba ethnicity in Nigeria, hence this study.
This study was carried out at Obafemi Awolowo University, Ile-Ife. It was a cross-sectional descriptive study involving apparently healthy young adults between the ages of 18 and 40 years (inclusive) of Yoruba ethnicity. The target population were the students of Obafemi Awolowo University community, Ile-Ife, Nigeria. Ethical approval was obtained from the Institute of Public Health of the Obafemi Awolowo University, Ile-Ife. The participants were selected using purposive sampling method. Blood samples were obtained from superficial cubital vein (2 ml) from the participants at resting position after cleaning with 75% ethyl alcohol using 5 ml syringe and the sample was dispensed into Sodium EDTA anticoagulant bottle. All sample collections followed standard procedure. A drop of each antisera A, B and AB were placed on a clean white tile in three different places marked X, Y and Z. Drops of blood were added to drops of antisera at points X, Y and Z respectively and mixed with the aid of glass rods. Then, the mixture was rocked gently for 60 seconds to observe for agglutination. The results of agglutination were recorded immediately after mixing. The tests were done in duplicates to ensure validity of results. The agglutinations in X & Z were considered as blood group A and agglutinations in Y & Z were considered as blood group B. The agglutinations at points X, Y and Z were considered as group AB. If no agglutination at points X, Y and Z, the sample was considered as blood group O. Agglutination at point X or Y or Z were considered invalid and the test was repeated. Heights and weight of all participants were measured to the nearest 1 cm and 0.5 kg respectively using ZT120 Health Scale. The body mass index was calculated from height in metres and weight in kg [28] and body surface area (BSA) was calculated from the weight (kg) and height (cm) using Mosteller formula, BSA = [(weight in kg × height in cm)/3600]1/2 [29]. The data were analyzed by the aids of IBM version 20.0 software using descriptive statistics and cross tabulations. Comparison of means of parameters among the four blood groups (A, B, AB and O) was done using Analysis of Variance (ANOVA). Comparison of grouped data were done using chi square. A p value of < 0.05 was taken as statistically significant.
The mean ± SD and range of age in years, weight in kg, height in metres, body surface area in metre square, body mass index in kg/m2 were 21.50 ± 3.52 (18-28), 56.83 ± 10.67 (39-95), 1.63 ± 0.07 (1.48-1.81), 1.60 ± 0.14 (1.30 ± 2.08), 21.33 ± 3.92 (15.42-38.54) respectively. This study showed that 12% were underweight, 66% had had normal weight, 10% had overweight and 3% had obesity (Figure 1). The highest and lowest mean height was found in blood groups A and O respectively. The highest mean weight, body surface area and body mass index were found in blood group AB. The relationship between ABO blood group and anthropometric parameters were not statistically significant (p-value > 0.05) as shown in Table 1. The highest frequency of obesity was found in blood group AB. The distribution of ABO blood group according to the BMI class (underweight, normal weight, overweight and obesity) is as shown in Figure 2.
 Figure 1: Distribution of body mass index.
View Figure 1
Figure 1: Distribution of body mass index.
View Figure 1
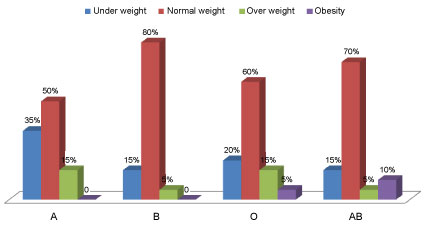 Figure 2: Distribution of ABO blood group according to body mass index. χ2 = 9.735, p-value = 0.372.
View Figure 2
Figure 2: Distribution of ABO blood group according to body mass index. χ2 = 9.735, p-value = 0.372.
View Figure 2
Table 1: Relationship between ABO blood group and anthropometric parameters. View Table 1
The mean weight (56.83 ± 10.67 kg) obtained from this study was similar to 56.37 ± 6.53 kg reported in a study among young adults within the age range of 18-40 years in India [30]. The mean height, weight and BMI of the study population were similar to the earlier report of a study done within the same environment [31-33]. It is also in consistency with the report of the study done among the undergraduates of the University of Benin, Nigeria within the same age range [34]. The percentage of the participants that were either overweight (10%) or obese (3%) was far lower than 33.9% and 25.4% respectively that was reported by Jafari, et al. in 2012 in adult Iran population between the ages of 40-57 years [35]. The difference may be as a result of difference in age and genetic make-up. The mean body surface area gotten from the study is similar to the report of El Missiri, et al. 2016 in a study conducted among young healthy Egyptian adults [36].
From this study, the highest mean height was found in blood group A which is in line with the report of Chaitra, et al. in a study done among 120 young adults of Kasturba Medical College, Mangalore in India within the age range of 18-22 years [37]. This is in contrast with blood group B reported by Kuar in 2014 in study done among post-menopausal females between 45 to 80 years of age living in India [17]. This contrast may be due to the age difference among the participants. Highest mean BMI was found in blood group AB which is supported by the studies of Ainee, et al., Amela, et al. and Chaitra, et al. in studies done among young adults [37-39]. The high BMI in this blood group may predispose them to metabolic syndrome. This was in contrast with a study by Jafari, et al. which reported highest BMI in blood group A [35]. ABO blood group system did not have significant effect on body anthropometric parameters (height, weight, BSA and BMI). This was in support of the report of Jafari, et al. in 2012 in a population based study of 50,045 men and women who reside in rural and urban areas of Golestan Province of Iran [35]. This was also in line with report of Chaitra, et al. in 2014 and Amela, et al. in 2017 among other studies [37,39,40]. The lowest mean BMI was in blood group A. this could be due to preference of this blood group for fruits and vegetables as earlier reported by Lam [41].
Though ABO blood group has no significant effect on body anthropometric parameters but blood group AB may be predisposed to metabolic syndrome due to the higher mean of weight, BSA and BMI found in this group.
The authors would like to thank the entire staff of Department of Physiological Sciences, Faculty of Basic Medical Sciences, Obafemi Awolowo University Ile-Ife, Nigeria for their support during the data collection, as well as the staff of the University Health Centre of Obafemi Awolowo University Ile-Ife, Nigeria during the research process.
No fund was received for this study.