COVID-19 virus has spread everywhere in Africa and to the 36 states of Nigeria, including the Federal Capital Territory (FCT), Abuja. The outbreak of COVID-19 in Lagos, since February 27, 2020 has generated 158,506 confirmed cases, including 1,969 deaths, as of 8 March 2021. In most cases, community transmission is the prime factor in which the viruses are fast spreading. Fortunately, there has never been a reported incidence of COVID-19 infection on any of the Nigerian university campuses. We assess the risk of sustained transmission at the Bingham University of Nigeria whenever the Coronavirus arrives on our university campus. Risk assessment is achieved through data describing the interaction amongst human-to-human and used facilities on the campus. The data analysis involves a fitted combination of 11 statistical models including inter alia logistic model presented by equation (12). Parameter estimation shows the probability of incidence rates and percentage for coefficient of determination at each level of individual interactions. The cubic regression model of Zankli visitors, Zankli Staff and the inverse regression model of Security Staff yield the highest coefficient of determination with the percentages of 82%, 79% and 74% respectively. This emphasizes the probability that an imported case through the Zankli visitors, Zankli Staff and Security Staff may cause COVID-19 outbreak on the University campus if the Coronavirus protocols are not properly maintained. Under the assumptions that the imported case is a threshold of an index number in the University community, and that the Coronavirus spread through human-to-human and facilities interaction. However, we found that strict compliance to Coronavirus prevention guidelines, which includes regular washing of hands with soap and water, cleaning of hands with alcohol-based hand rub, maintaining of at least 1 metre distance when coughing or sneezing, practicing of physical distancing by avoiding unnecessary travel, staying away from large groups of people, refrain from smoking and other activities that weaken the lungs, staying home whenever you feel unwell and avoid frequent touching of your face are tips for non-pharmaceutical preventive measures.
COVID-19, Coronavirus, Pandemic, Bingham University (BHU), Risk assessment, Statistics models
Bingham University is located in Karu, 25 kilometers from the Federal Capital city of Nigeria Abuja. The University was established in 2005 by the Evangelical Church of West Africa (ECWA) as a conventional University in line with the ethics of public universities in Nigeria. Its founding father's visionaries within the various Executive Councils, as well academics of ECWA extraction, looked back to the golden age of mission education, with its focus purposefulness, and high quality it was the desire to meet the soaring need for not only quality, secular education, but education that recognizes and integrates the moral and spiritual values on which the Christian faith is founded, which fueled its establishment. Recognizing the importance of the technological revolution of the 19th and 20th centuries, BHU determined to build a technology-driven institution of the 21st century.
In line with the vision of the University, risk assessment of the COVID-19 pandemic in BHU sought to create awareness and identify contingency factors that are sensitive in the disease dynamics. Risk awareness is the best way to prevent and slow down both the community and local transmission of the COVID-19 pandemic. [1] opined that risk awareness is achieved through the communication of risk assessment. Effective risk communication is an important measure to control the pandemic. Most risk assessment tools focus on either tracking the affected patients or diagnosing a probable health condition through symptoms [2,3]. RIKA India introduced an innovative Risk Assessment Tool that goes beyond symptom detection and patient tracking. It includes 4 factors in the assessment of risk: Health, Behavior, Exposure, and Social policy. Each of these four factors has sub-factors that help to assess the overall risk more comprehensively and also present it to the user in a simplified way [4].
We will first recall some basic notions in modeling of the COVID-19 pandemic in BHU.
Risk Assessment is one of the important steps in understanding the dynamics of an epidemic where it enhances the understanding of risk and allows information to decide on adequate preventive and mitigation measures. Very importantly, the epidemiological risk assessment includes an index case exposure, and hazard and vulnerability assessment. Risk assessment is also widely used in the context of health, safety, and the environment. It involves the evaluation of existing conditions of vulnerable individuals who are newly infected and the impending hazard, existing exposure, and carrying health capacities for prevention. Risk Models specify the factors which are needed to assess risk and the relationship among those factors, producing a sort of guidelines for risk assessors to use in their assessments. Health risk assessment tools have been developed to assess individuals' risk for particular diseases.
COVID-19 also known as novel coronavirus or 2019-nCoV, is a severe acute respiratory syndrome infectious disease caused by SARS-CoV-2. According to [5-8], the common symptoms of an infected person are fever, cough, dyspnea, shortness of breath, and breathing difficulties. In more severe cases, the infection can cause pneumonia, kidney failure, and even death.
A pandemic is described as an epidemic outbreak that affects worldwide or over a very wide geographical area by crossing international boundaries and usually affecting a large number of people. COVID-19 can be described as a pandemic. This is due to the rapid increasing number of cases on the daily basis from 31 December 2019 in Wuhan of People's Republic of China to the moment of this study.
Statistical Models are equations in a simplified way to approximate reality. In Statistics, models are either deterministic or probabilistic. In the former case, outcomes are precisely defined, whereas, in the latter, they involve variability due to unknown random factors. Models with a probabilistic component are called statistical models [9]. A statistical model is usually specified as a mathematical relationship between one or more random variables and other non-random variables. This is a mathematical model embodies a set of statistical assumptions concerning the sample data of a system, process, or relationship in numerical form in which equations are used to simulate the behavior of the system or process under study.
Risk is defined as the probability that an individual develops a specified disease over a specified interval of time, given that the individual is alive and disease-free at the start of the period. As with the incidence rate, the risk is time-dependent and depends on both the starting point and the length of the interval. In a longitudinal follow-up study as described below. The proportion of new occurrences among disease-free individuals still under observation at the time
is an estimate of the risk or probability of disease occurrence in the jth time interval. Incidence rates and risks are related via the general formula, risk = rate × time. For the longitudinal follow-up study estimates defined above, the relationship is manifest by the equation
Incidence Rate, a common measure of disease occurrence used in COVID-19 epidemiology is the incidence rate. Incidence refers to new cases of disease occurring among previously unaffected individuals. The population incidence rate is the number of new cases of the disease occurring in the population in a specified time interval divided by the sum of observation times, in that interval, on all individuals who were disease-free at the beginning of the time interval. Generally, the incidence rate is time-dependent and depends on both the starting point and the length of the interval. With data from studies in which subjects are followed over time, incidence rates can be estimated by partitioning the following period into intervals of lengths Lj having midpoints tj for j = 1,...,J, and estimating a rate for each interval. Let nj denote the number of individuals who are disease-free and still under observation at time tj and dj the number of new diagnoses during the jth interval. An estimate of the incidence rate at the time tj is obtained by dividing dj by the product of nj and Lj:
The denominator in is an approximation to the sum of observation times on the population members in the jth interval and in practice is usually replaced by the actual observation time, which accounts for the fact that the dj diagnoses of disease did not occur exactly at time tj.
According to [10], all continents reported confirmed cases of COVID-19 while Africa confirmed its first case in Egypt on Feb 14, 2020. China is Africa's leading commercial partner; thus, there are large travel volumes through which severe acute respiratory syndrome coronavirus 2 could reach the continent. Several measures have already been implemented to prevent and control possible case importations from China and countries that are the epicenter for the disease. However, the ability to limit and control local transmission after importation depends on the application and execution of strict measures of detection, prevention, and control. These measures include heightened surveillance and rapid identification of suspected cases, followed by patient transfer and isolation, rapid diagnosis, tracing, and follow up of potential contacts [7,8].
Nigeria is one of the countries in Africa with over 200 million citizens and the country's major cities are on lockdown since the index case. A report from [2] ascertained that the first confirmed COVID-19 case in Nigeria was February 27, 2020, when an Italian citizen in Lagos tested positive for the virus. As of April 29, 2020, data from the Nigerian Centre for Disease Control (NCDC) website shows that Nigeria has recorded 1,278 confirmed cases and 51 deaths. The data showed that Lagos State currently has 718 active cases and recorded 21 deaths, and the new epicenter, Kano State, has 136 reported cases and 3 residents of the state have died of COVID-19 [10]. BHU is one of the private institutions located in the outskirt of Abuja metropolitan city in Karu, Nasarawa State, where 0.85% burden of the COVID-19 infected cases in Nigeria is found. University campuses in Nigeria are struggling with the decision of how to reopen school when the Federal Government would announce the resumption date in the fall, given the COVID-19 pandemic. This decision has identified epidemic models as one of the tools been applied to understand testing and campus risk mitigation policies which could enable BHU to detect outbreaks early and reduce the risk of transmission in the densely connected campus networks. Virus spread depends not only on the reported number of cases but also on the number of individuals who never tested but carry the virus.
According to [11] epidemiological models are been used to gain a realistic insight into the transmission dynamics and control of emerging and re-emerging infectious diseases of public health interest. This dates back to the pioneering works of the likes of Sir Ronald Ross, a British surgeon and a polymath, who, in addition to elucidating the full lifecycle of the malaria parasite in birds and in humans in Freetown, Sierra Leone, in the 1890s, introduced the the notion of threshold analysis in the control of infectious diseases. He showed, using a simple mathematical model involving two differential equations for the temporal dynamics of the the population of infected mosquitoes and infected humans, which we do not need to kill all mosquitoes to effectively control malaria. All that was needed was to reduce the mosquito population below a certain threshold and malaria will be effectively controlled or even eliminated from the community. This was what was done to eliminate malaria from Western Europe. He won the 1902 Nobel Prize in Physiology or Medicine. In the 1920s, distinguished Scottish scientists (biochemist, William O. Kermack and Lt. Col. Anderson G. McKendrick, military physician, and epidemiologist) formulated the much-celebrated mathematical framework for modeling infectious diseases. Their modeling assumptions were based on stratifying the total human population into mutually-exclusive compartments based on infection status. The resulting mathematical models typically take the form of deterministic systems of nonlinear differential equations, involving many state variables i.e. humans' compartments and model parameters. The resulting dynamic models are built based on incorporating all the pertinent epidemiological, ecological, immunological, and demographic features of the disease, as well as making realistic assumptions on the key aspects associated with the disease transmission process e.g. mixing patterns, distribution of waiting times in epidemiological compartments, etc. That's why the models are dynamic in nature. In other words, the transmission dynamics and control of the disease is now modeled using a collection of mathematical equations, which typically take the form of differential equations i.e. equations that measure the rate at which some epidemiological state variable of the model, such as the number of infected or hospitalized individuals, changes with time. By using rigorous mathematical analysis, coupled with data analytics to parameterize the models which can be used to first reproduce the observed trajectory of the disease i.e. the model can be validated by showing that it reasonably mimics the observed data, the initial number of cases, hospitalizations and the disease-induced death. Consequently, be used to make predictions on the likely course of the disease. We can then predict the expected number of cases, hospitalizations, ICU admissions, and mortality in the near or distant future. Thus, either mathematical or statistical modeling is inherently multidisciplinary. It entails the coming together of various disciplines, notably mathematics, statistical data analytics, epidemiology, ecology, immunology, public health, computation, and even the social sciences, including disciplines such as communications and behavioral analysis needed to determine effective ways to communicate the disease control strategies obtained from modeling to the general public.
Risk assessment has become an essential tool during times of serious health challenge as reported in [12,13]. The outbreak and evolution of the COVID-19 pandemic have been analyzed from different perspectives. For example, [14] fitted country-wise quadratic regressions to estimate the peak periods. [15,16] analyzed the impact of the pandemic on China's economy and risk management of COVID-19 by universities in China. [17] proposed solutions and recommendations related to early warning, identification, and monitoring of risks. [18] surmised the Chinese experience and its implications for other countries. [19] presented a chart for sustainable travel, tourism, and hospitality industry for the time after COVID-19. [20] critically evaluate the Global Health Security Index (2019), which provides data before the discovery of COVID-19 and makes it possible to evaluate how countries might have been prepared for a pandemic and acted accordingly. Further research analyzing the containment strategies of individual countries and global risk analysis of the COVID-19 situation includes [21-24].
While COVID-19 pandemic as an emergency public health challenge in the 21st Century, this has brought into limelight a need for interdisciplinary research. It has brought into the picture the need for a trans-disciplinary view of the current crisis through various angles of global governance, technology, and risk assessment [12]. While world health organizations and governments advised many preventive measures like social distancing and personal hygiene, one of the foremost strategies on the campuses of learning remains risk assessment and communication to break the chain of spread [25]. Risk assessment and understanding of a disease dynamic at the community level goes a long way to enhancing prevention.
Amidst the risk management team in BHU, Karu and response to the COVID-19 pandemic, this paper has six specific objectives as follows:
(i) Heightened surveillance and rapid identification of suspected cases.
(ii) Evaluation of the University health capacity in preparedness.
(iii) Screening, testing and isolation, rapid diagnosis, tracing, and follow-up of potential contacts.
(iv) Contextualized and simulates the vulnerability of BHU based on the available data of the University.
(v) Assess the probability of epidemic outbreak in BHU
(vi) Observation of government guidelines advised and world health organization emergency framework.
The main aim of this paper is to assess the risk of the COVID-19 pandemic at BHU as investigated.
The theory of risk assessment, modeling, estimation and the computational software for deriving statistically sound parameter estimates from data, provide a powerful set of tools for calculating risk estimates. Risk models provide the general form of the dependence of risk on the available incidences as shown in Table 1. Specific risk estimates are obtained by fitting the models to data. The role of data in the process of risk estimation cannot be overemphasized. Theory, models, or model fitting software can overcome limitations in the data from which risk estimates are derived. In human epidemiologic studies of infectious diseases, both the quality and the quantity of the data available for risk modeling are limiting factors in the estimation of COVID-19 risk. The quality of data, or lack thereof, and its impact on risk modeling are discussed below. There are several approaches for the numerical calculations of likelihood analysis. Estimation based on grouped data using a Poisson form of the likelihood as reviewed in [26] has been used for the analyses of atomic bomb survivors and other major epidemiologic studies of radiation health risks. This analysis is facilitated by forming a table so that individuals contributing information to each cell of the table have equal, or approximately equal, background rates. In particular, the table is formed by the cross classification of individuals into categories of exposure, period, importation, available incidence rates, and all other variables that appear in the model.
Table 1: Interaction between BHU facilities and community. View Table 1
In statistical modeling, we are interested in discovering what we can learn about systematic patterns from empirical data containing a random component. We suppose that some complex data generating mechanism has produced the observations and wish to describe it by some simpler, but the still realistic, model that highlights the specific aspects of interest. Thus, by definition, models are estimated prototypes to mimic a real-life situation.
Often, in a model, researchers distinguish between systematic and random variability, where the former describes the patterns of the phenomenon in which we are particularly interested. Thus, the distinction between the two depends on the particular questions being asked. Random variability can be described by a probability distribution, perhaps multivariate, whereas the systematic part generally involves a regression model, most often, but not necessarily [27], a function of the mean parameter. The analysis and interpretation of past data provide the basis for more accurate decisions and predictions. However, in this study, we explore the data available in BHU, Karu, and hypothetical observations on the two campuses of the same institution. Consequently, the full likelihood or probability of causation outbreak of COVID-19 in BHU is the product of available incidence rates. In general, infection rates vary considerably as functions of importation, and there is strong evidence indicating that community transmission risks associated with lack of social-distancing, facemask, and regular washing of hands after exposure. This study is a useful analysis that includes the extrapolation of risks effects on data available in Table 1 and Table 2. On the other hand, our tabulation of data involves a method of summarizing data in columns and rows to make it more comprehensive and meaningful. The primary data was collected using the interaction between the university facilities and community. The data was collected hourly then converted into daily as shown in Table 1 and was collected between February to December 2020. The data collected was subjected to regression models of equations 1-11 and the results obtained are shown in equations 13-35.
Table 2: Model description. View Table 2
We begin our model formulation by introducing the followings, which are the general forms of regression models:
Linear Regression Model is
Y1 = b0 + b1x (1)
Logarithmic Regression Model
Y2 = b0 + b1Inx (2)
Inverse Regression Model
Y3 = b0 + (3)
Quadratic Regression Model
Y4 = b2x2 + b1x + b0 (4)
Cubic Regression Model
Y5 = b3x3 + b2x2 + b1x (5)
Power Regression Model
Y6 = + b0 (6)
Compound Regression Model
Y7 = b0 (b1x) (7)
S-curve
Y8 = (8)
Exponential Regression Model
Y9 = b0 () (9)
Growth Regression Model
Y10 = (10)
Logistic Regression Model
Y11 = (11)
From equations (1-11), b1, b2, and b3 are coefficients of x1, x2, and x3 respectively and b0 is a constant. Where y is dependent variable and the X's are the independent variables.
Now, we present our model as given in equation (12) below:
T = Y1 + Y2 + . . . + Yn (12)
Where, n = 11 and Y1, Y2, . . . ,Yn are given as defined in equation (1-11) respectively. Equation (12) is the summation of equation (1-11) and is being considered as a logistic model to predict the worst case scenario whenever there is an imported case of COVID-19 on the campus. The model requires all non-missing values to be positive. We, first, present the table for the model description as shown below.
Subjecting the data in Table 1 into equations (1) to (11) and using each of the variables as a dependent variable against the remaining ones, the following regression models that fitted the data best, their summary tables and graphs are as shown in equations (13-35), Table 3, Table 4, Table 5, Table 6, Table 7, Table 8, Table 9, Table 10, Table 11, Table 12, Table 13, Table 14, Table 15, Table 16, Table 17, Table 18, Table 19, Table 20, Table 21, Table 22, Table 23, Table 24, Table 25, Table 26, Figure 1, Figure 2, Figure 3, Figure 4, Figure 5, Figure 6, Figure 7, Figure 8, Figure 9, Figure 10, Figure 11, Figure 12, Figure 13, Figure 14, Figure 15, Figure 16, Figure 17, Figure 18, Figure 19, Figure 20, Figure 21, Figure 22 and Figure 23.
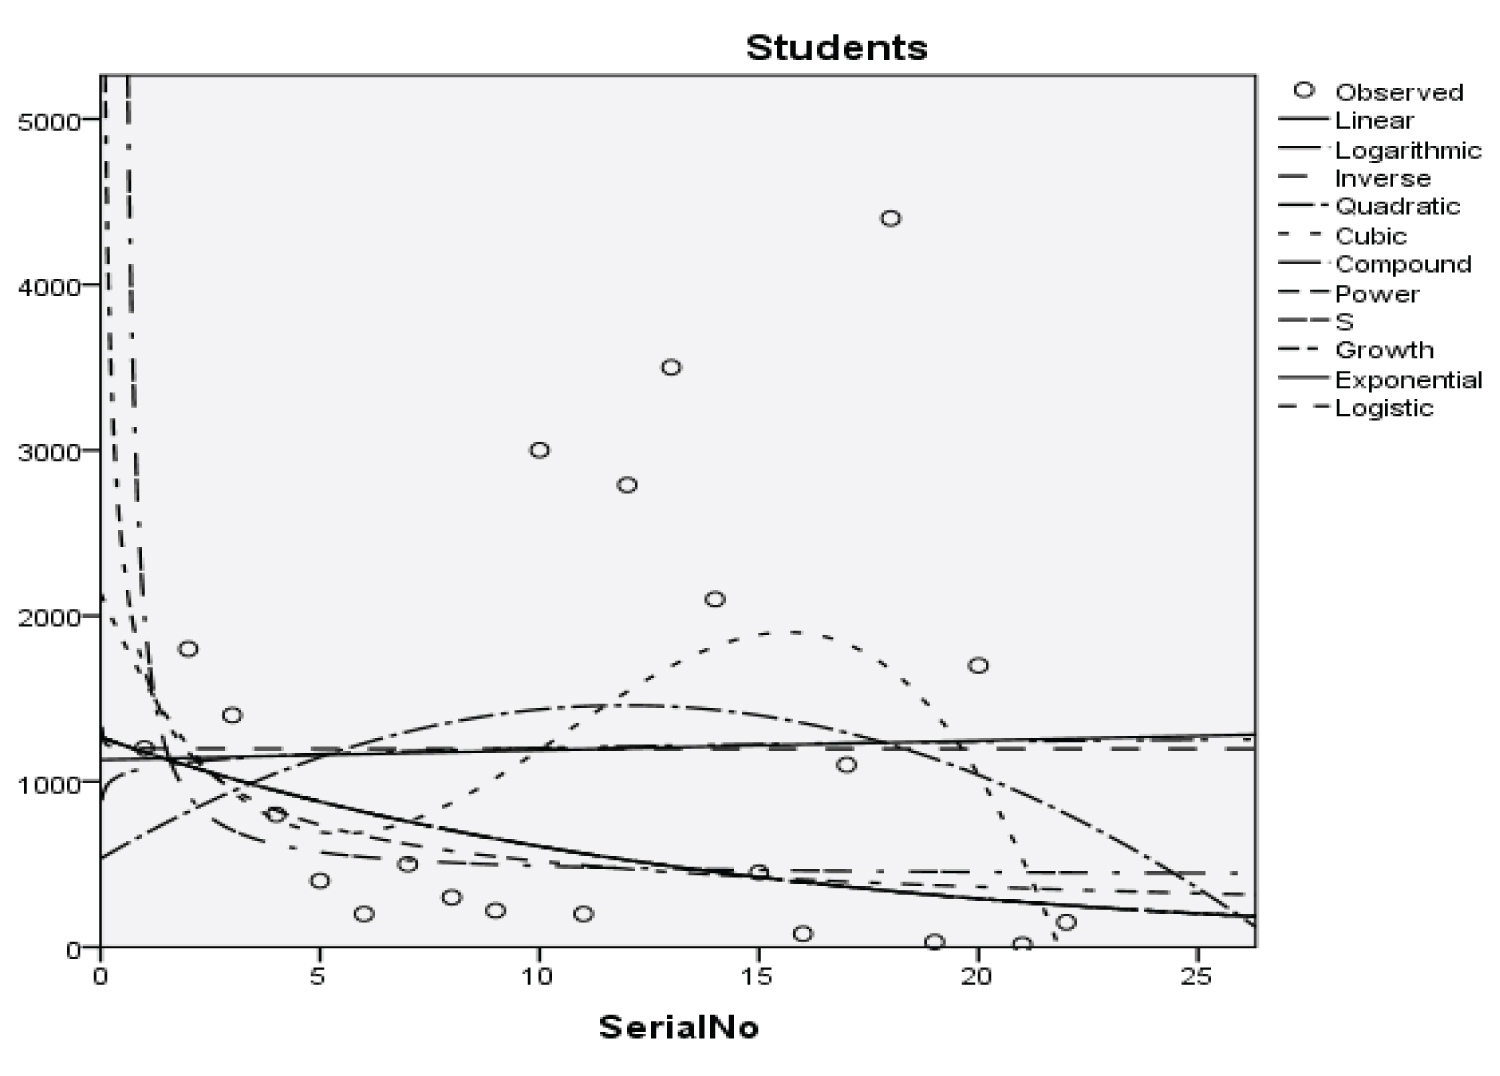 Figure 1: Graphical representation of regression models of students.
View Figure 1
Figure 1: Graphical representation of regression models of students.
View Figure 1
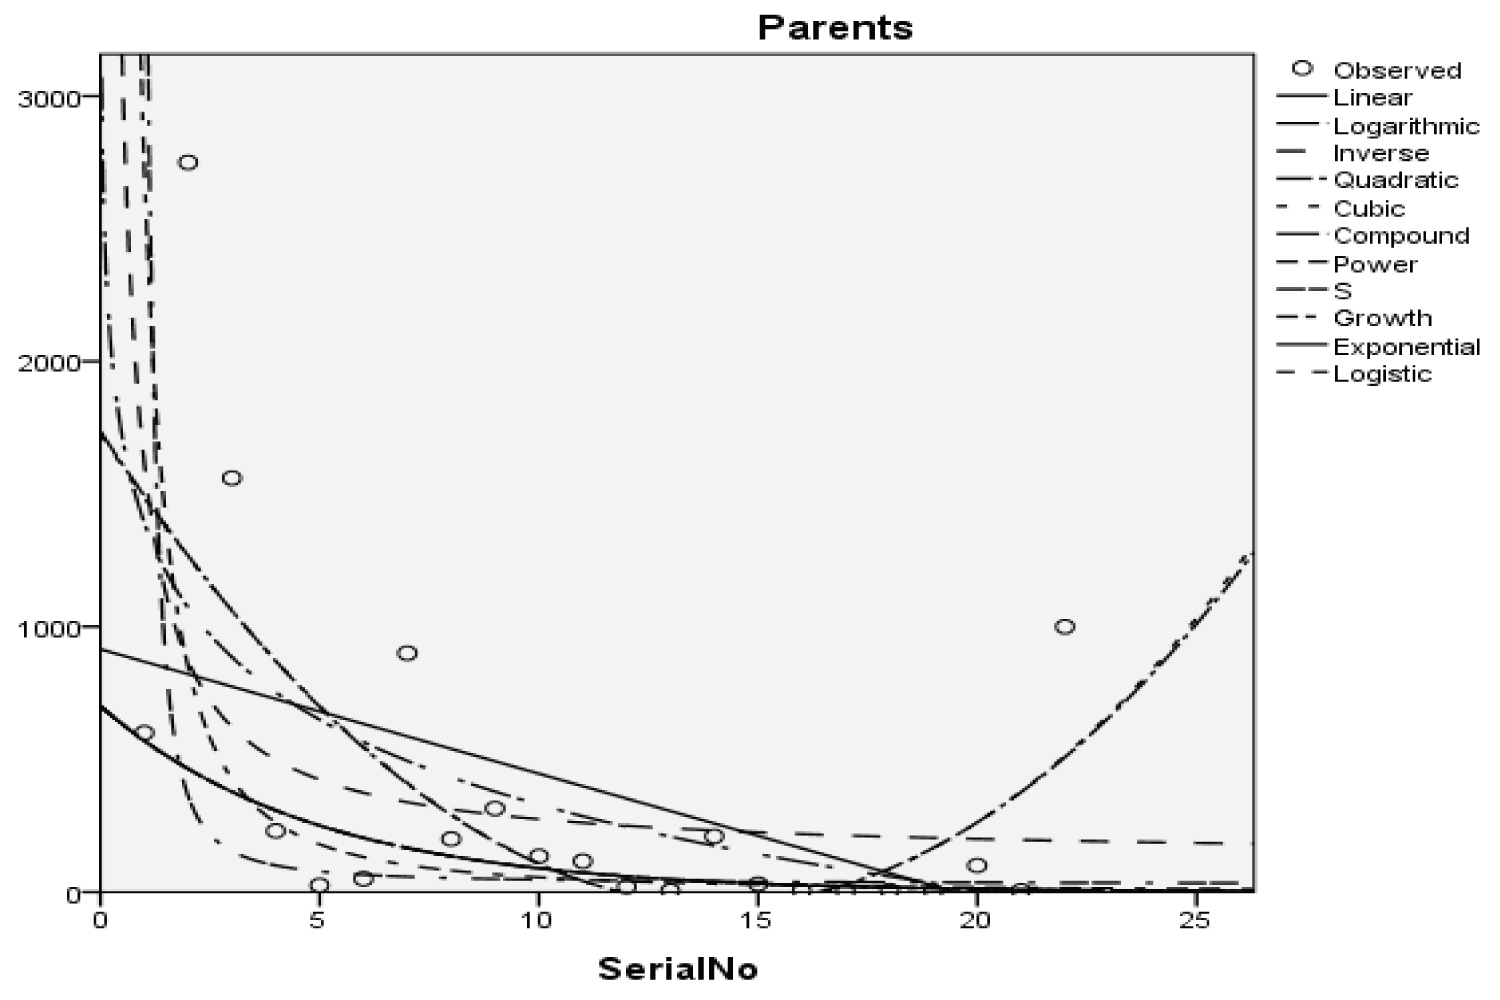 Figure 2: Graphical representation of regression models of parents.
View Figure 2
Figure 2: Graphical representation of regression models of parents.
View Figure 2
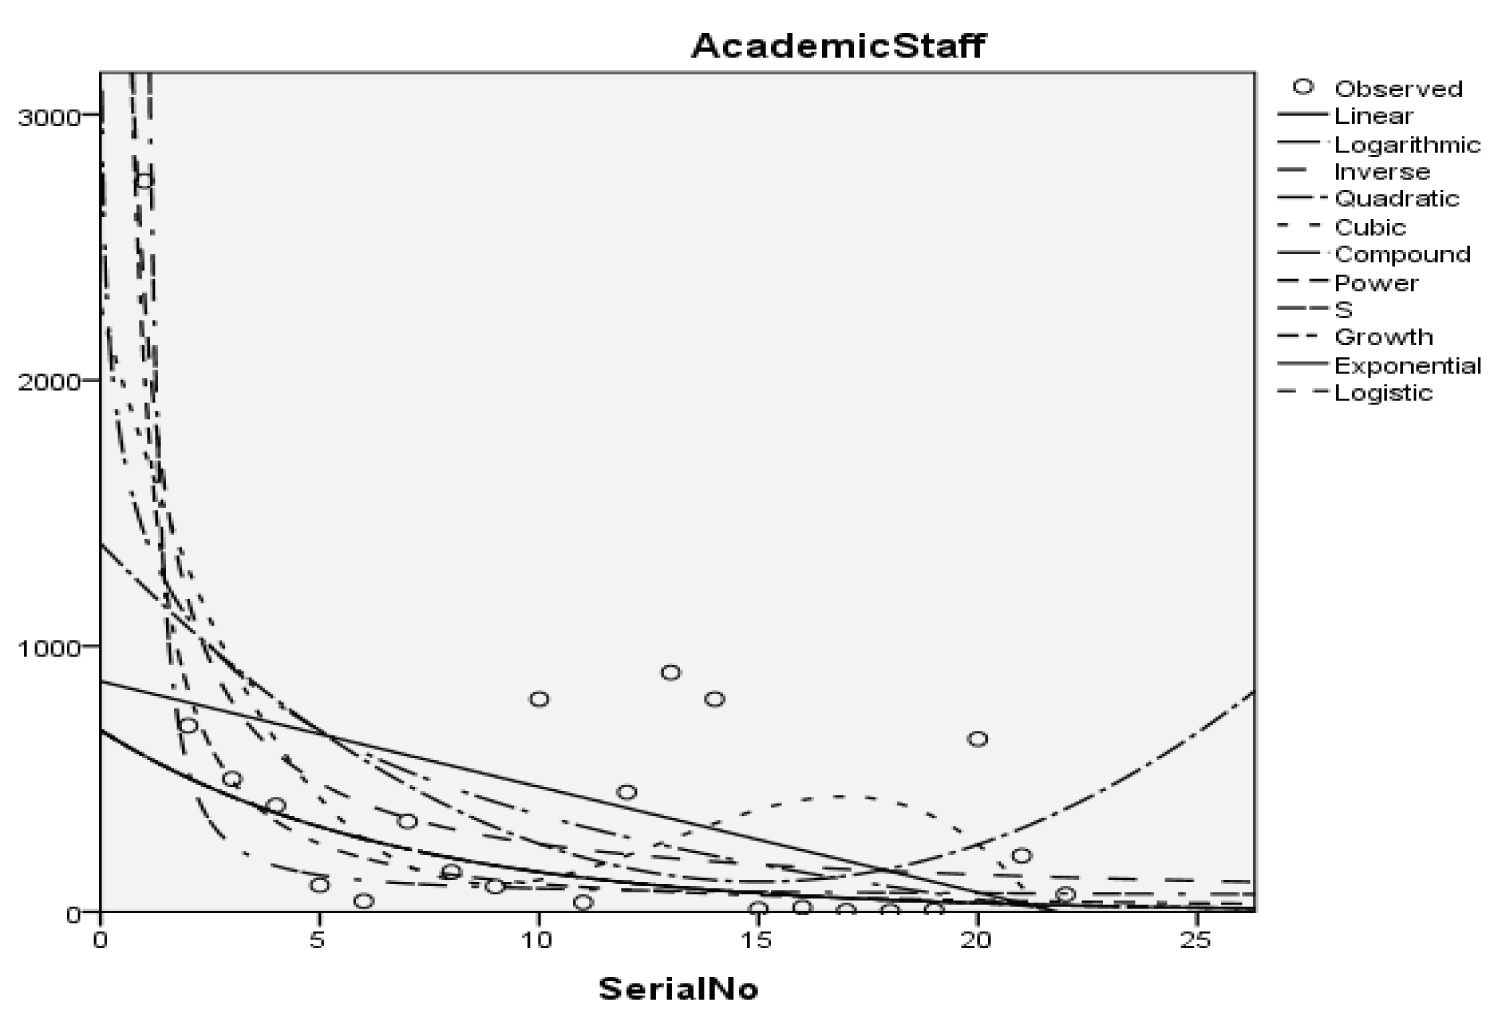 Figure 3: Graphical representation of regression models of academic staff.
View Figure 3
Figure 3: Graphical representation of regression models of academic staff.
View Figure 3
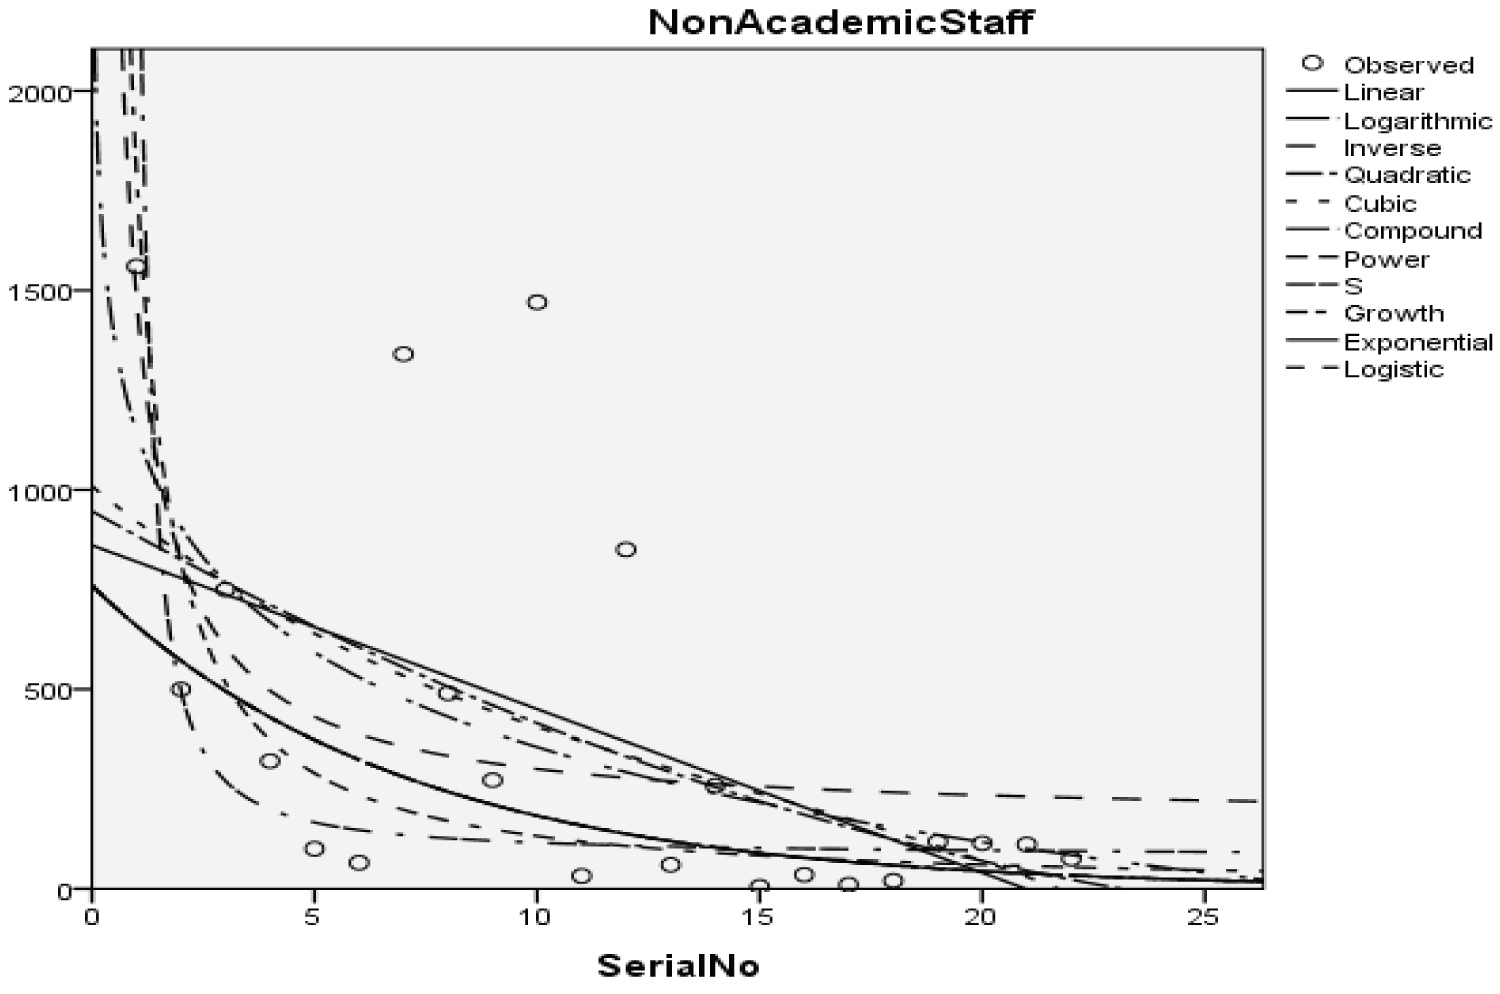 Figure 4: Graphical representation of regression models of non-academic staff.
View Figure 4
Figure 4: Graphical representation of regression models of non-academic staff.
View Figure 4
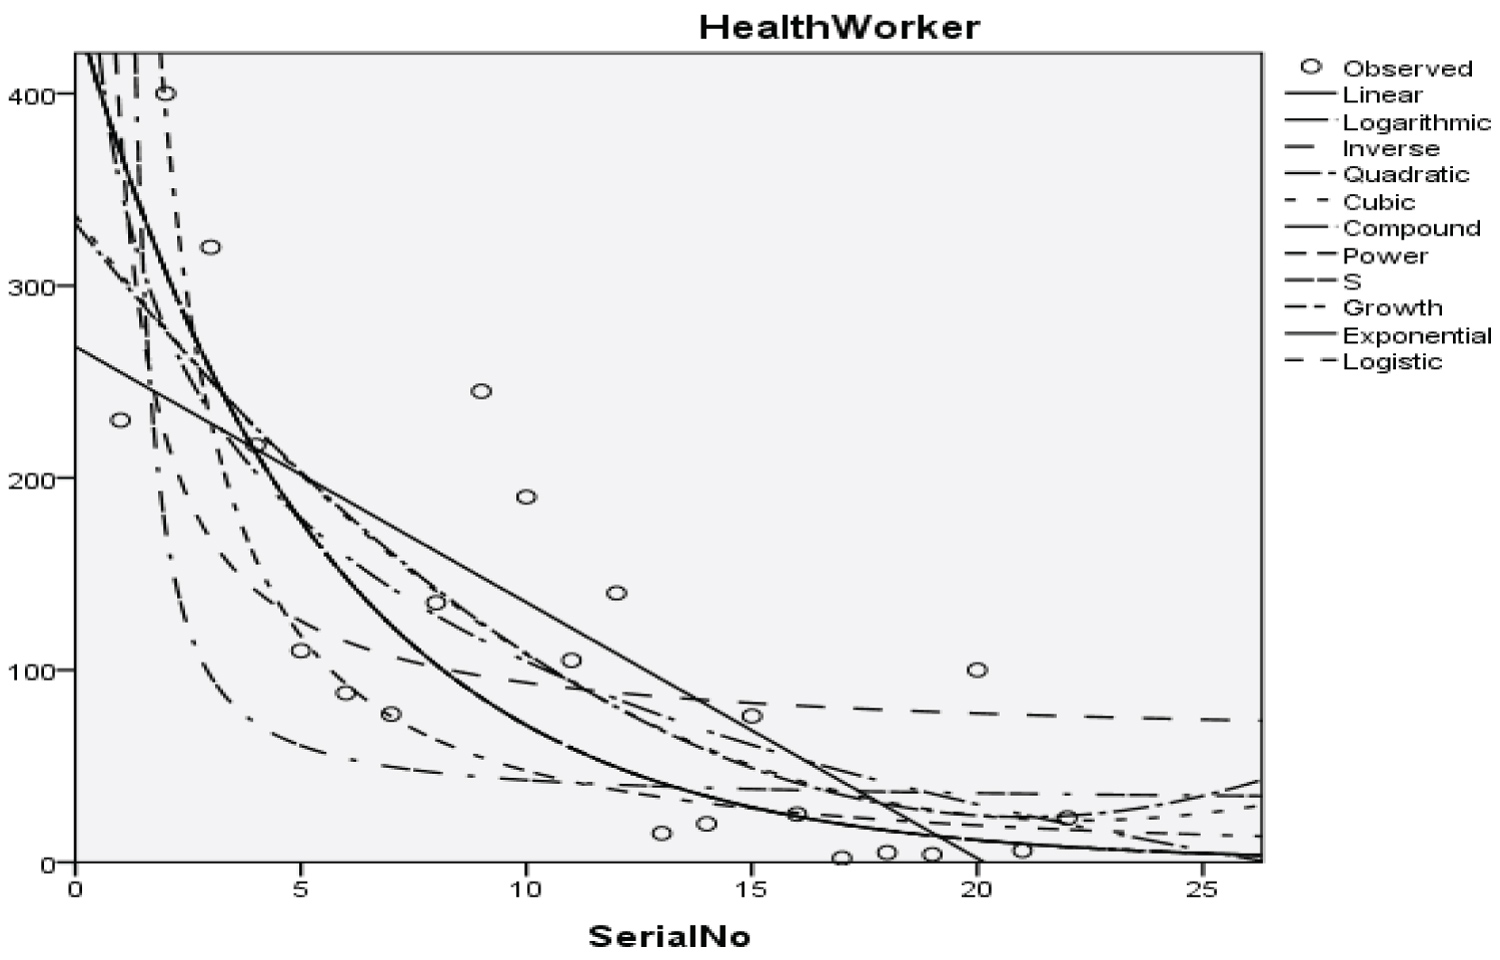 Figure 5: Graphical representation of regression models of health worker.
View Figure 5
Figure 5: Graphical representation of regression models of health worker.
View Figure 5
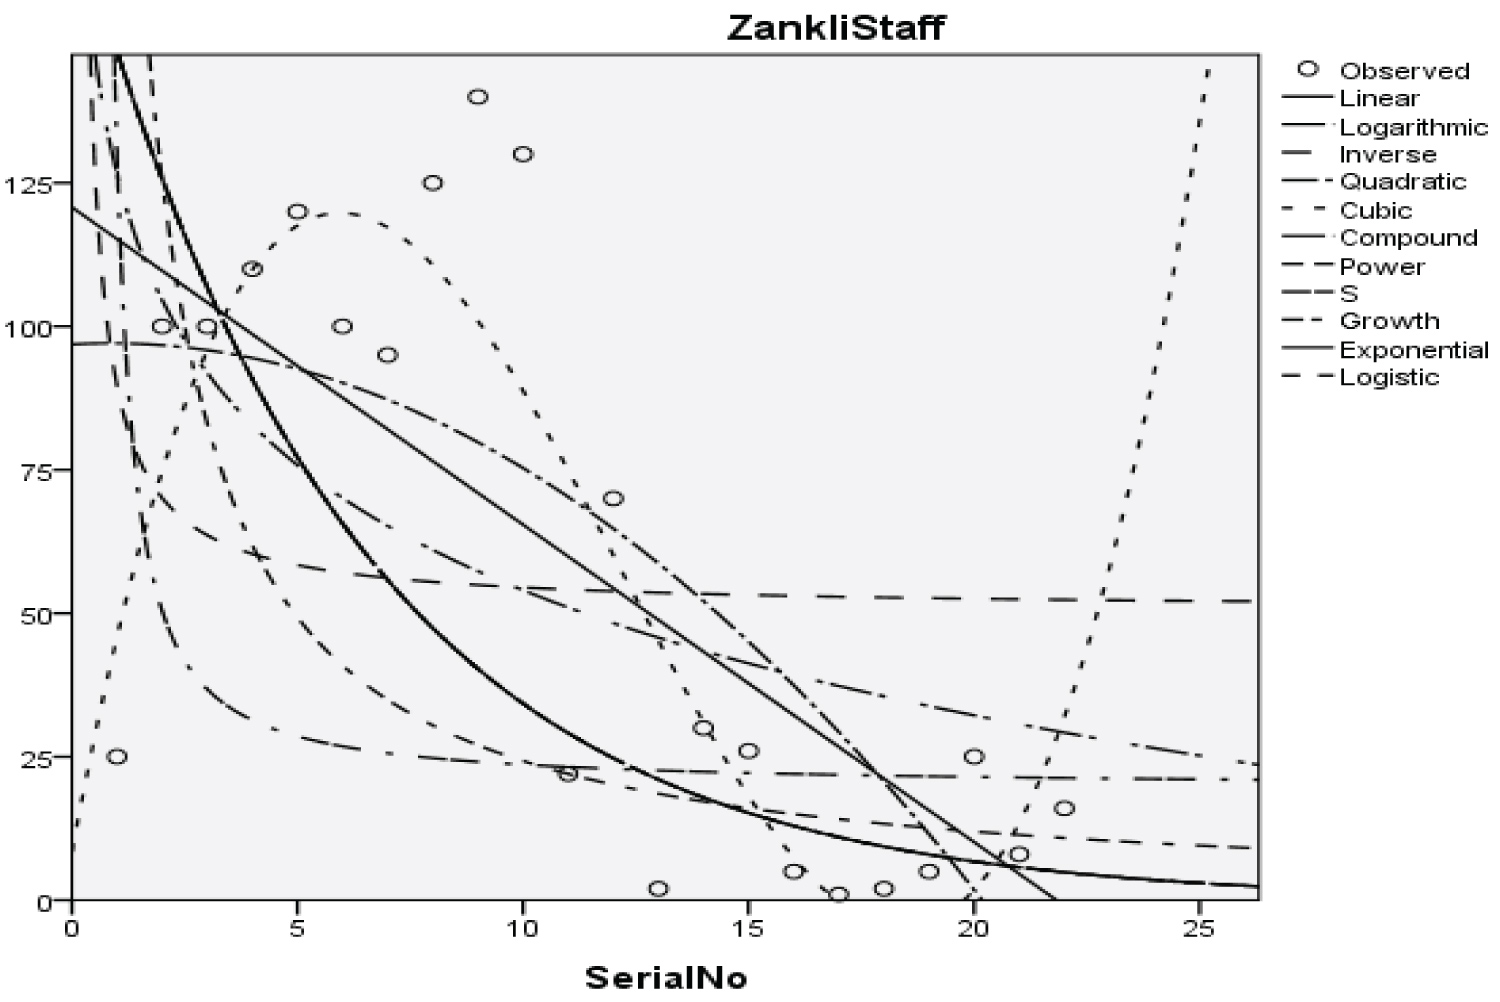 Figure 6: Graphical representation of regression models of Zankli staff.
View Figure 6
Figure 6: Graphical representation of regression models of Zankli staff.
View Figure 6
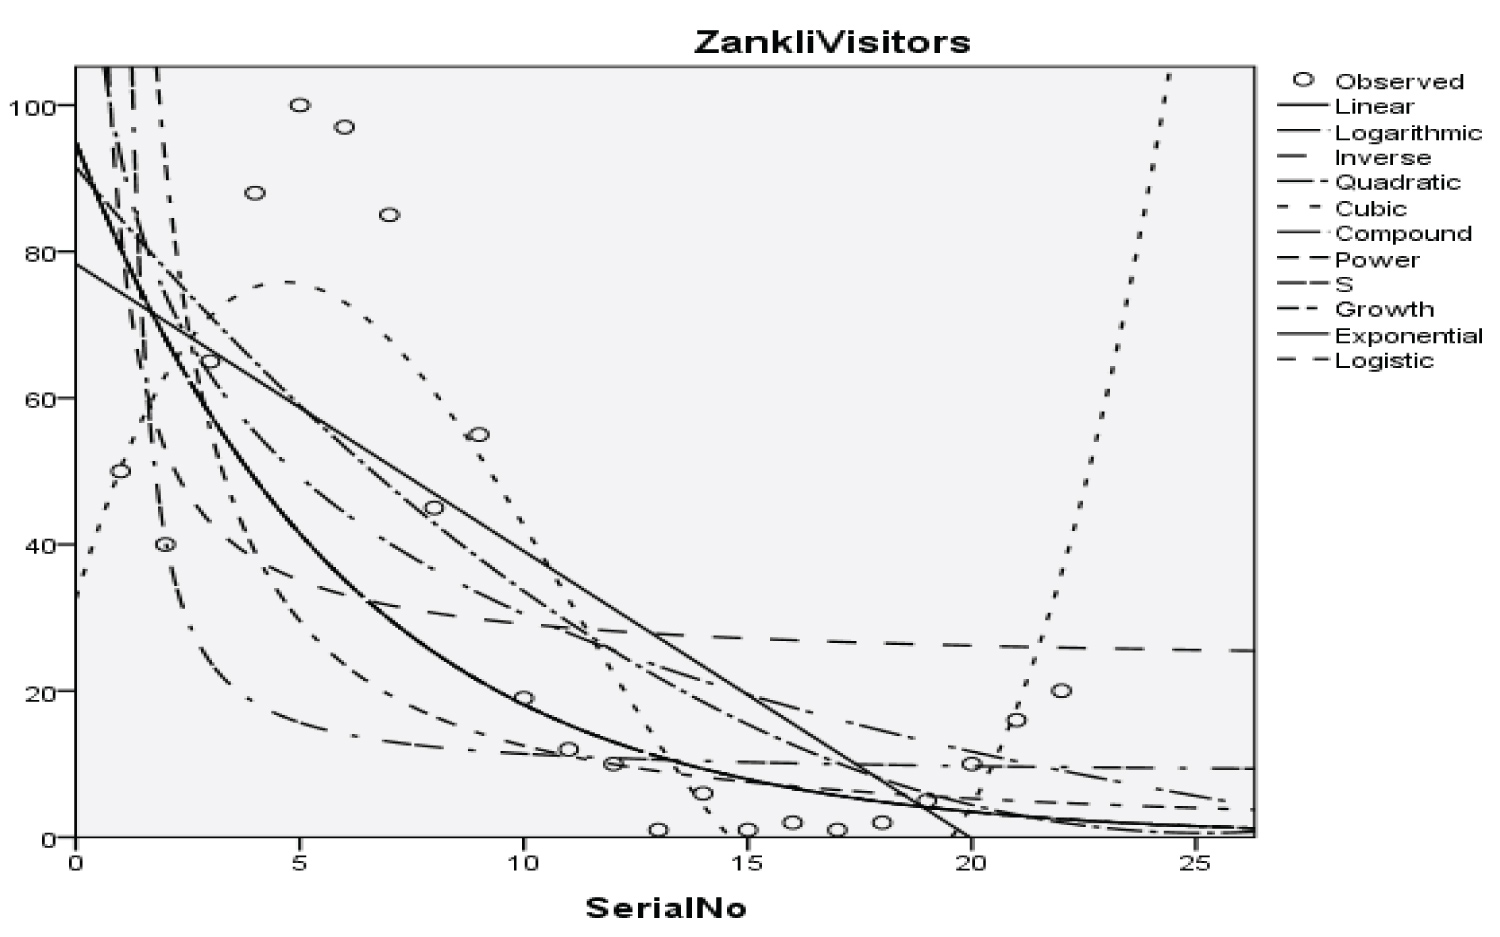 Figure 7: Graphical representation of regression models of Zankli visitors.
View Figure 7
Figure 7: Graphical representation of regression models of Zankli visitors.
View Figure 7
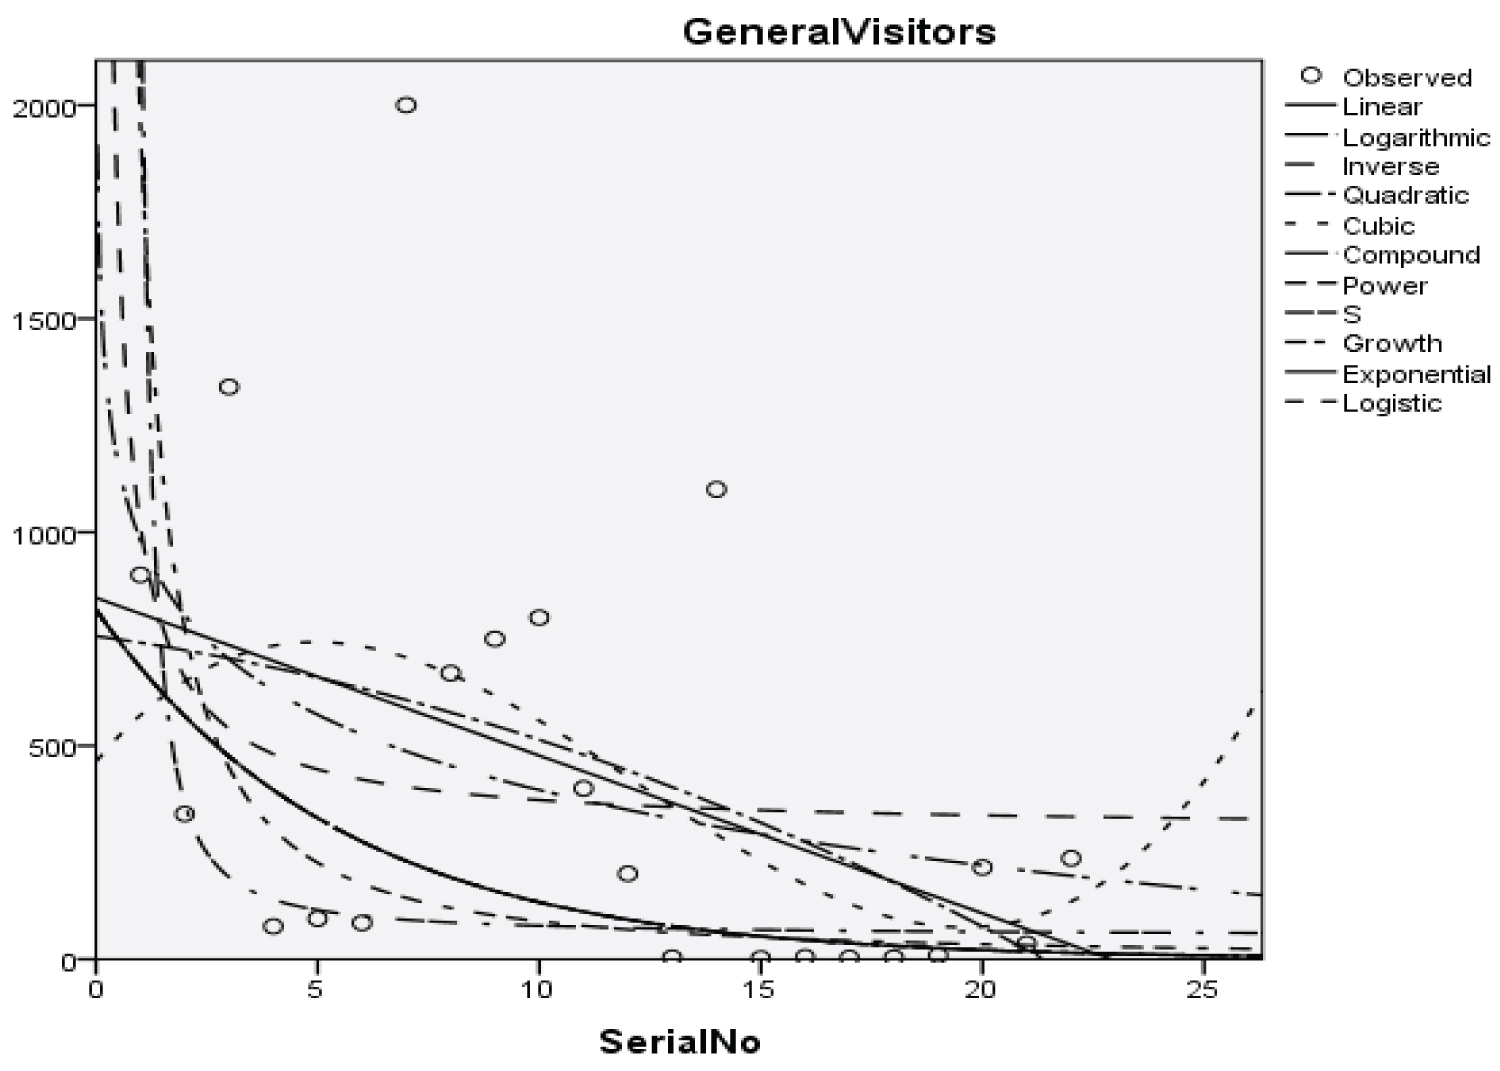 Figure 8: Graphical representation of regression models of general visitors.
View Figure 8
Figure 8: Graphical representation of regression models of general visitors.
View Figure 8
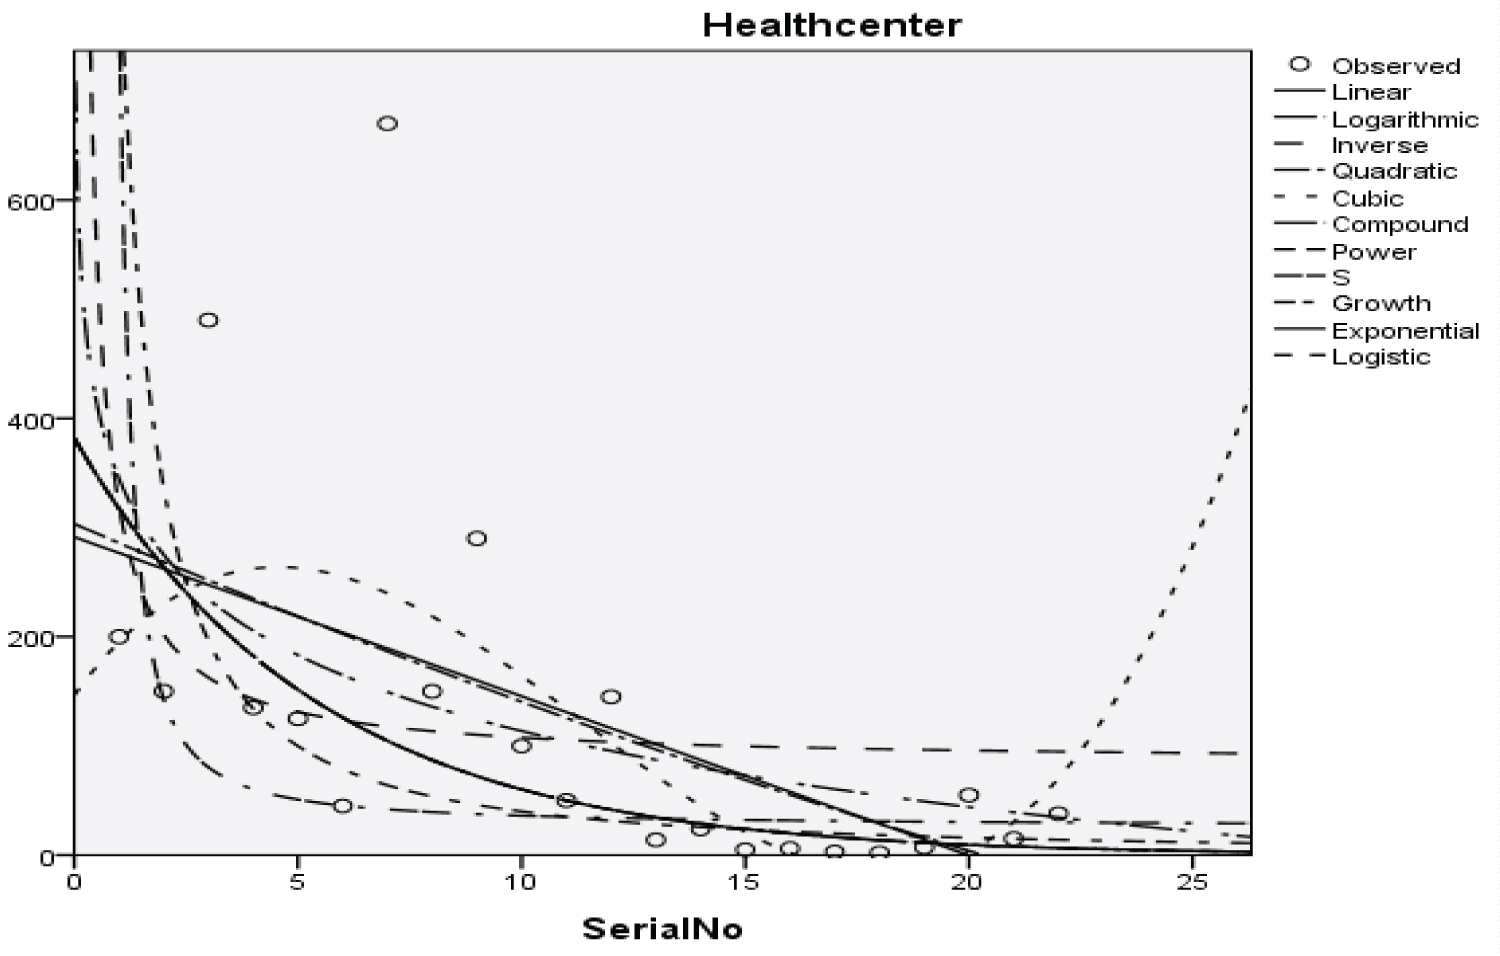 Figure 9: Graphical representation of regression models of health center.
View Figure 9
Figure 9: Graphical representation of regression models of health center.
View Figure 9
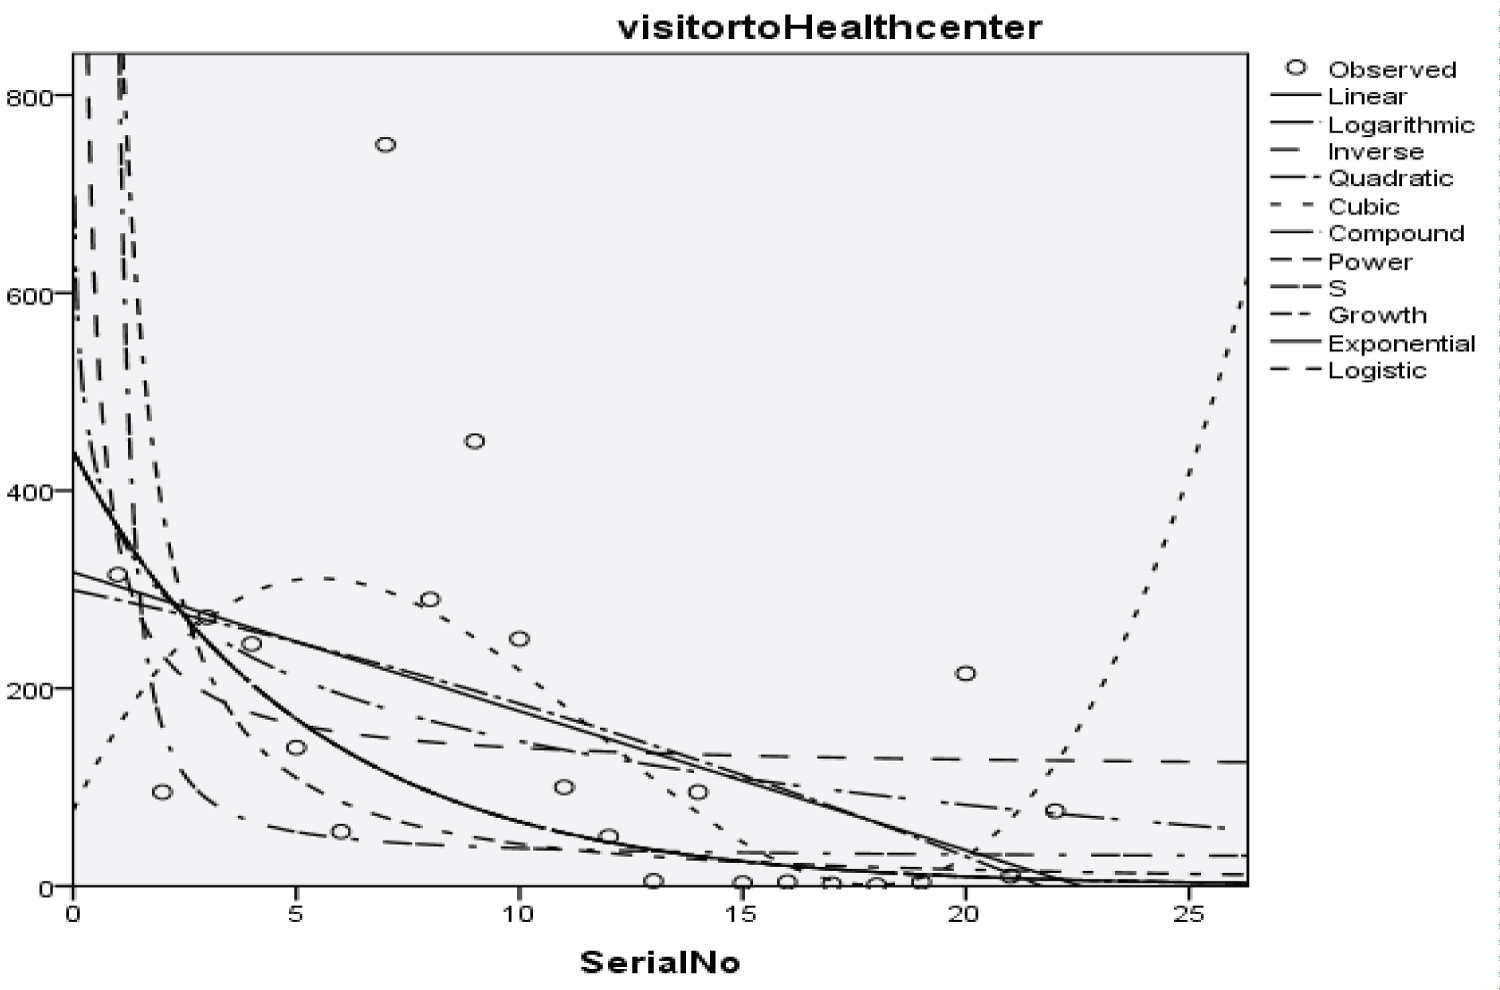 Figure 10: Graphical representation of regression models of visitor to health center.
View Figure 10
Figure 10: Graphical representation of regression models of visitor to health center.
View Figure 10
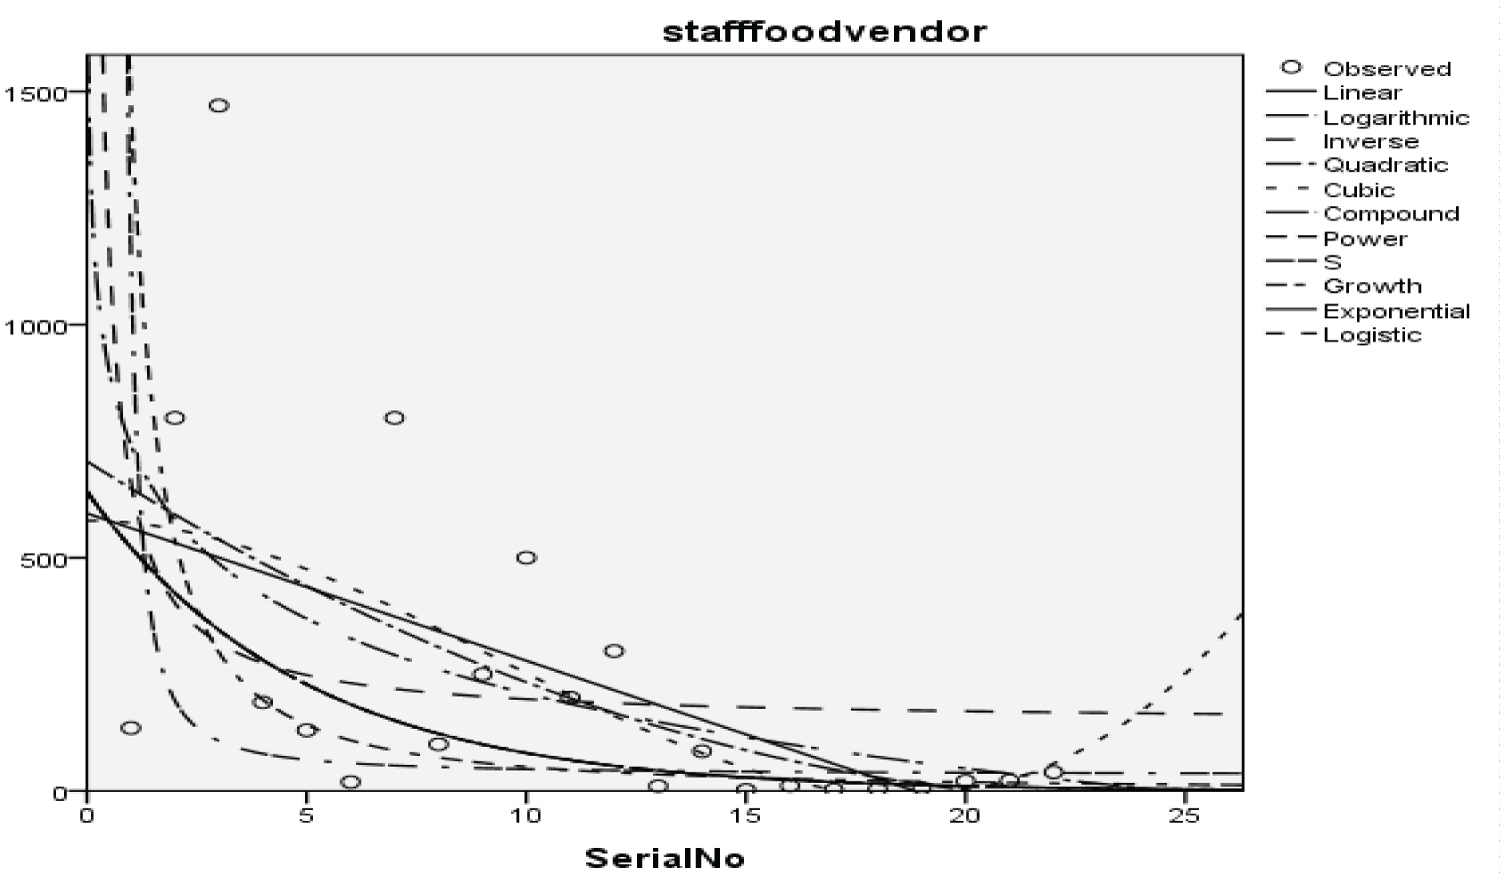 Figure 11: Graphical representation of regression models of staff food vendor.
View Figure 11
Figure 11: Graphical representation of regression models of staff food vendor.
View Figure 11
 Figure 12: Graphical representation of regression models of provision staff.
View Figure 12
Figure 12: Graphical representation of regression models of provision staff.
View Figure 12
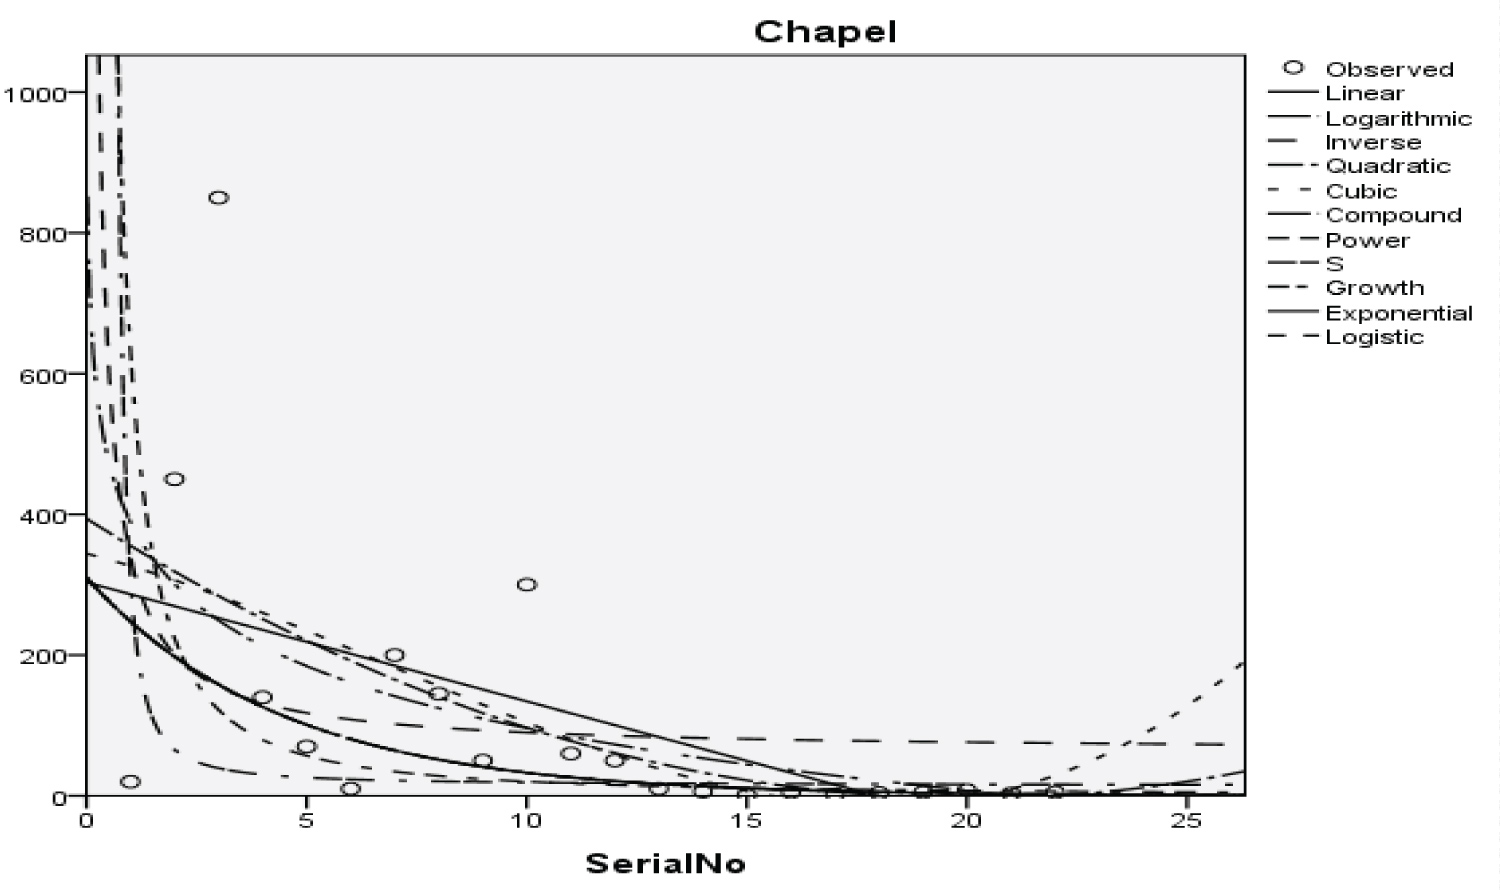 Figure 13: Graphical representation of regression models of Chapel.
View Figure 13
Figure 13: Graphical representation of regression models of Chapel.
View Figure 13
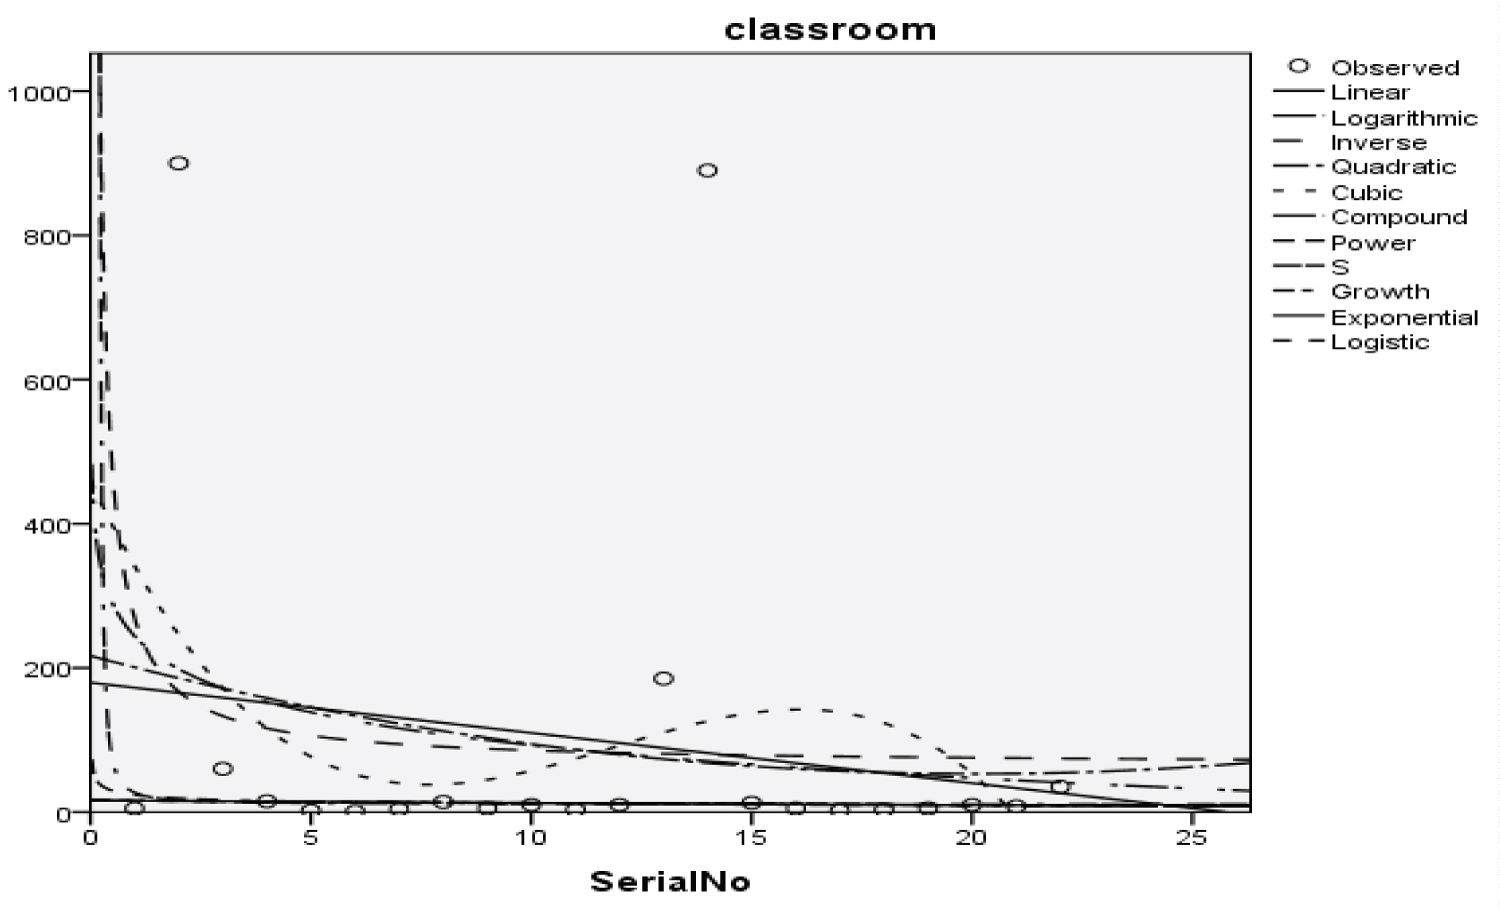 Figure 14: Graphical representation of regression models of classroom.
View Figure 14
Figure 14: Graphical representation of regression models of classroom.
View Figure 14
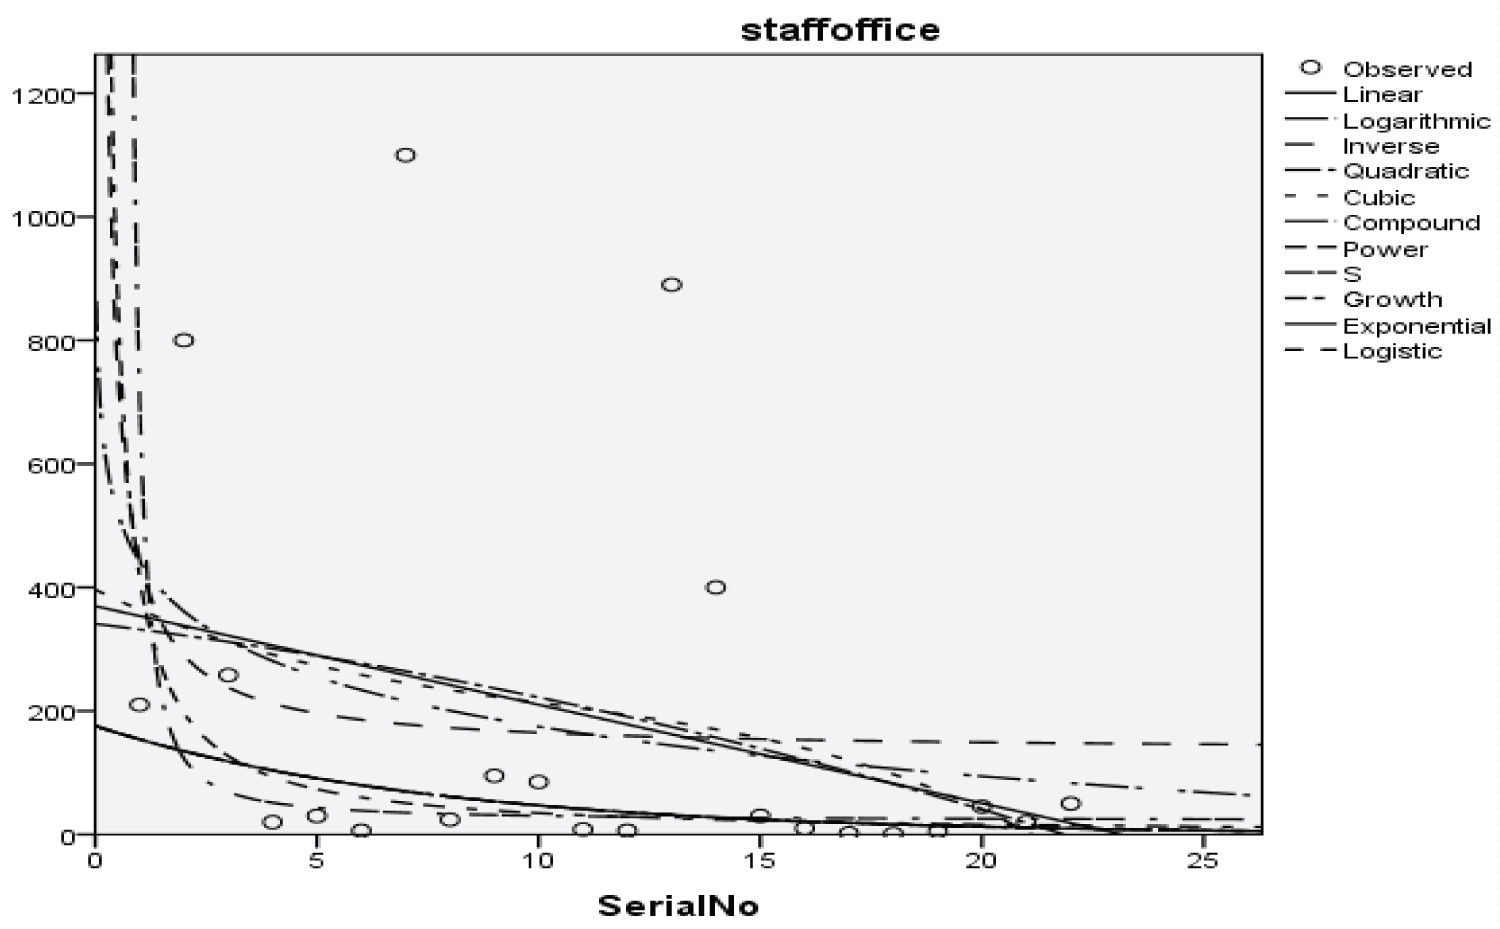 Figure 15: Graphical representation of the regression model of staff office.
View Figure 15
Figure 15: Graphical representation of the regression model of staff office.
View Figure 15
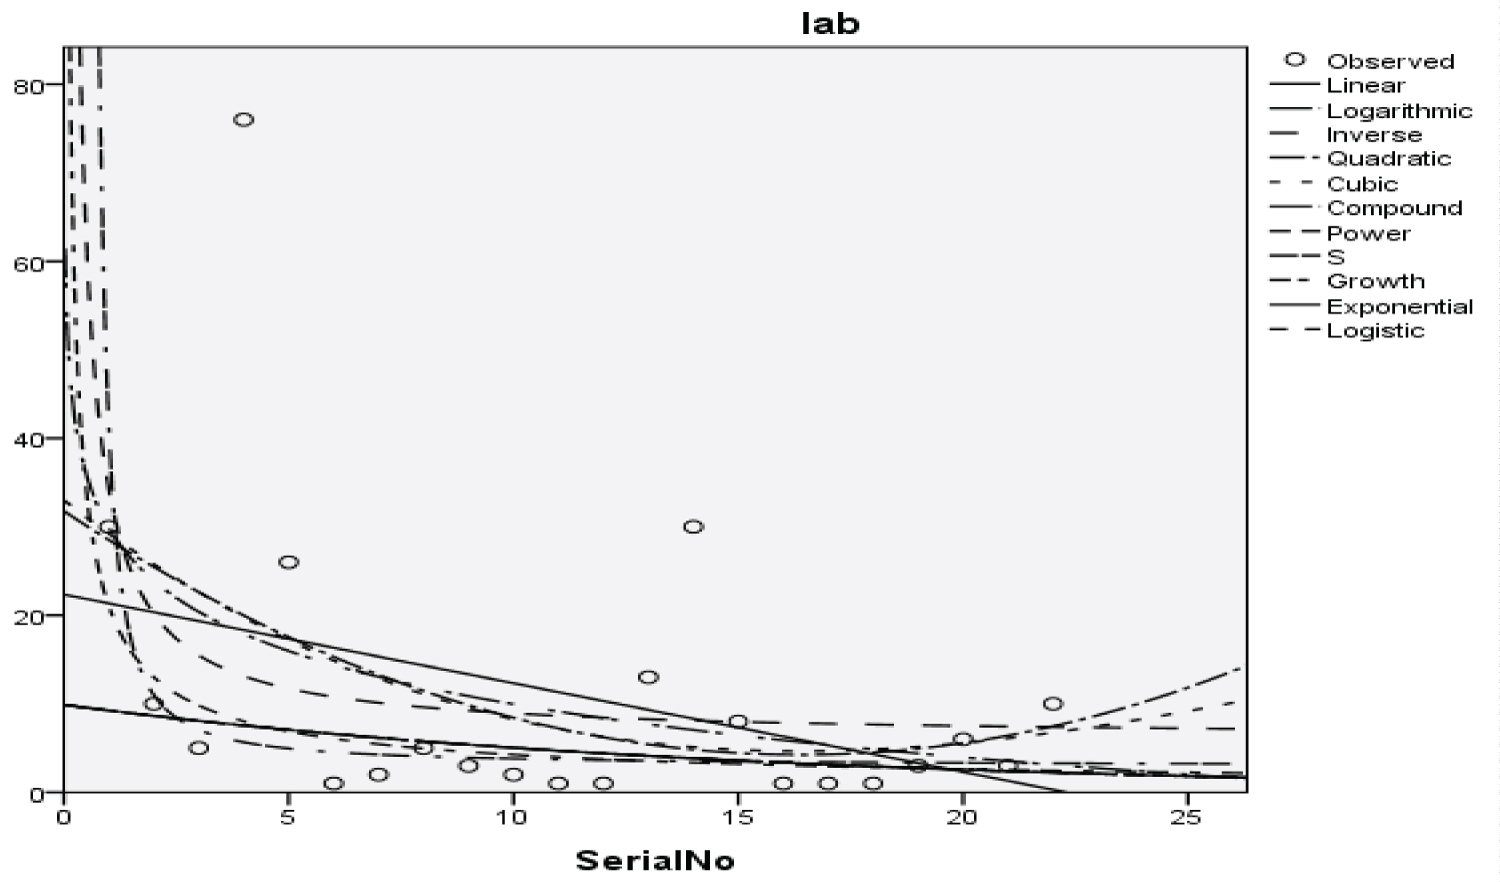 Figure 16: Graphical representation of regression models of laboratories.
View Figure 16
Figure 16: Graphical representation of regression models of laboratories.
View Figure 16
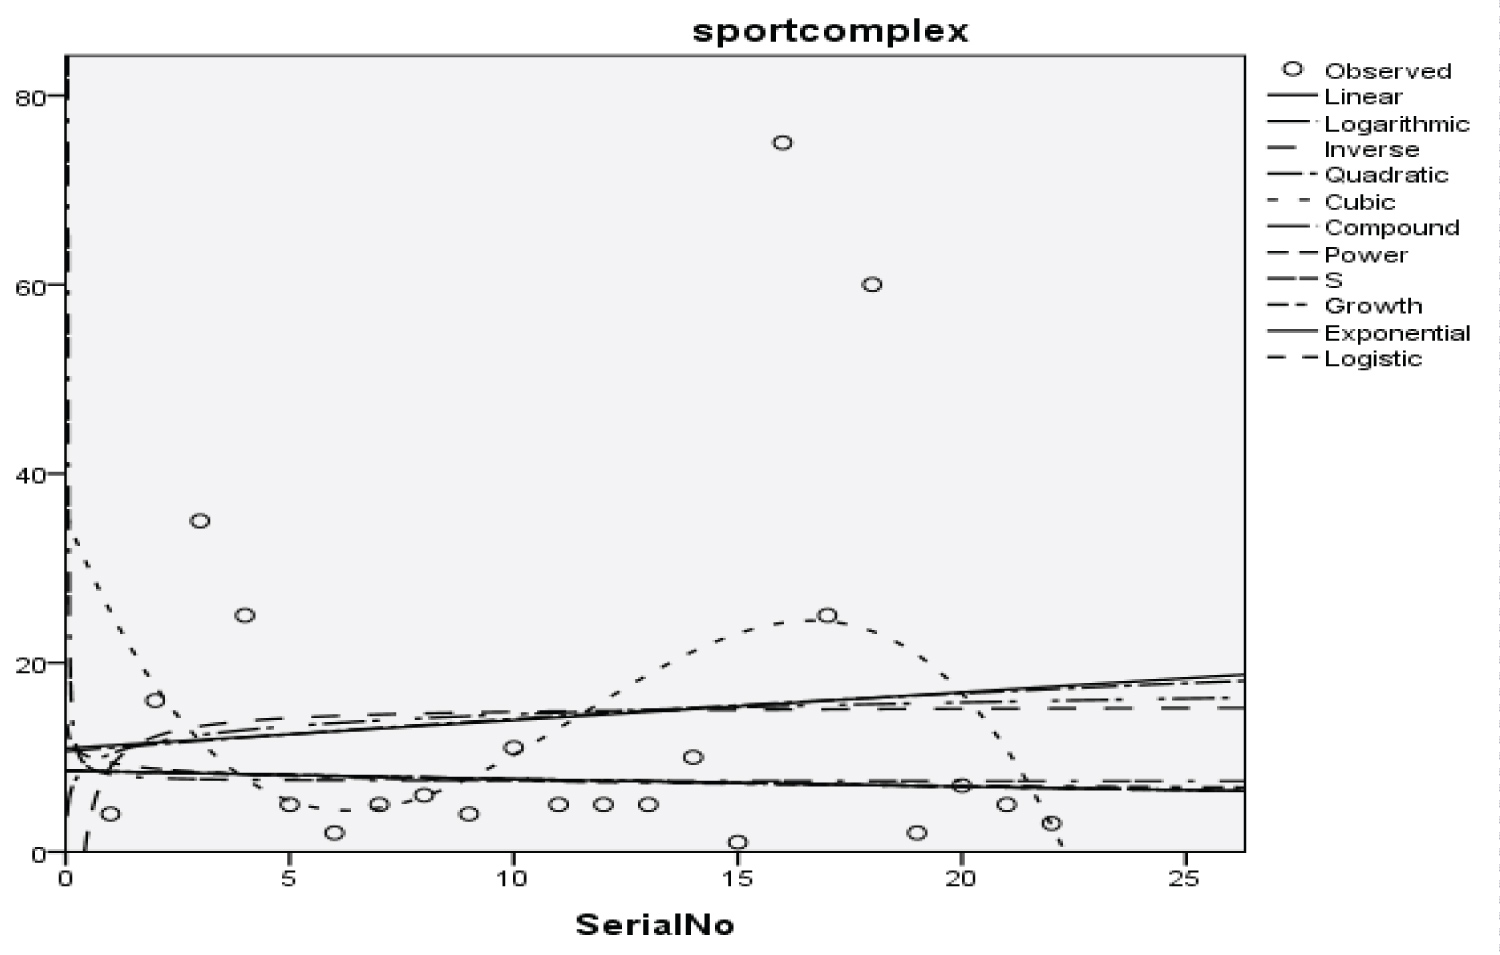 Figure 17: Graphical representation of regression models of the sport complex.
View Figure 17
Figure 17: Graphical representation of regression models of the sport complex.
View Figure 17
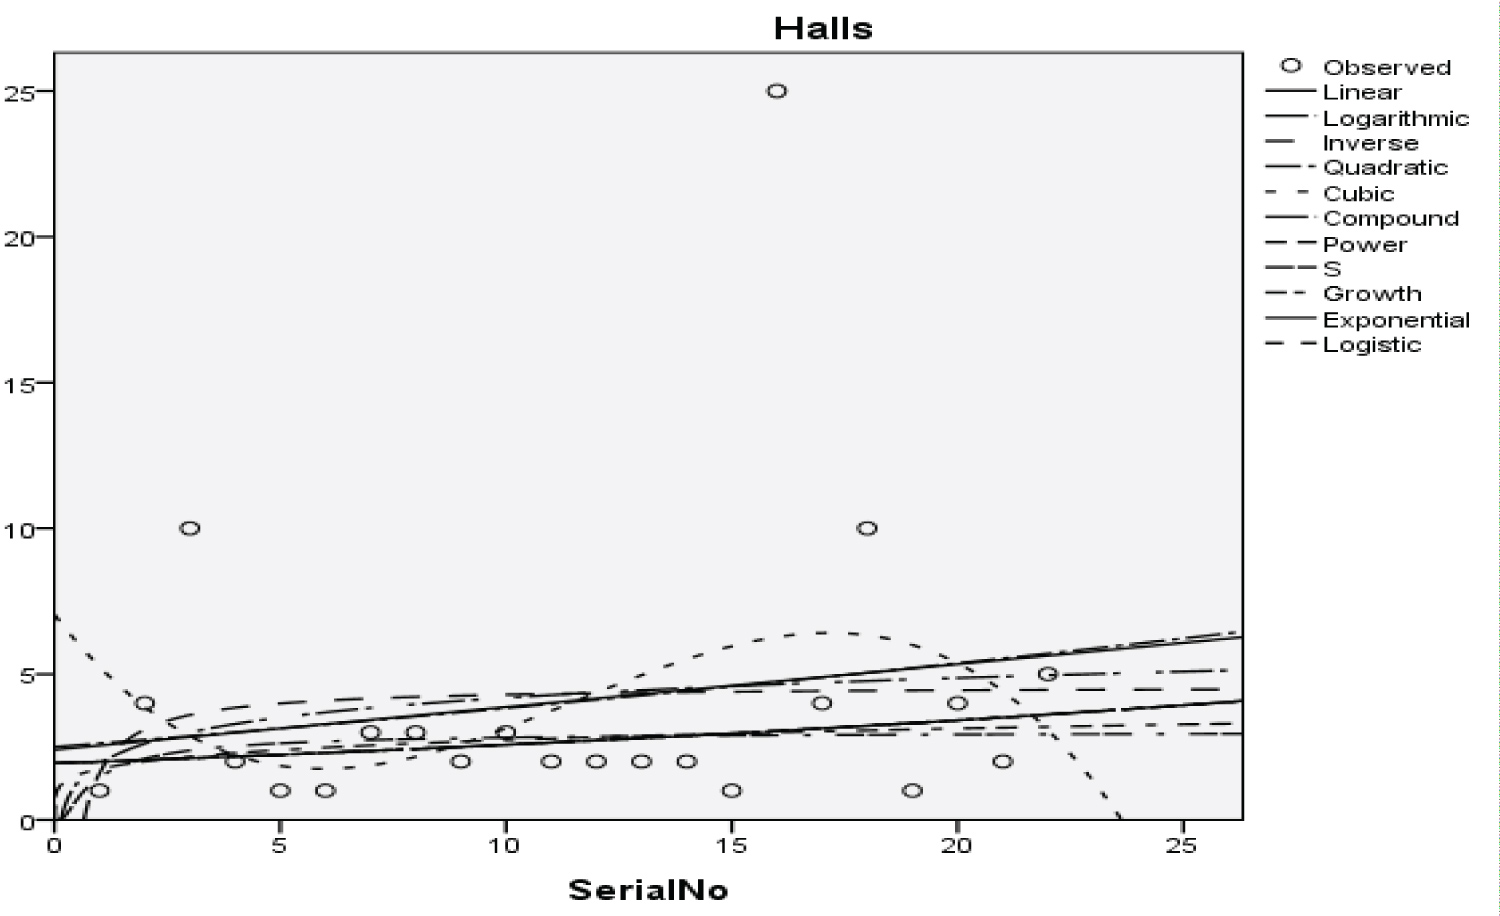 Figure 18: Graphical representation of regression models of halls.
View Figure 18
Figure 18: Graphical representation of regression models of halls.
View Figure 18
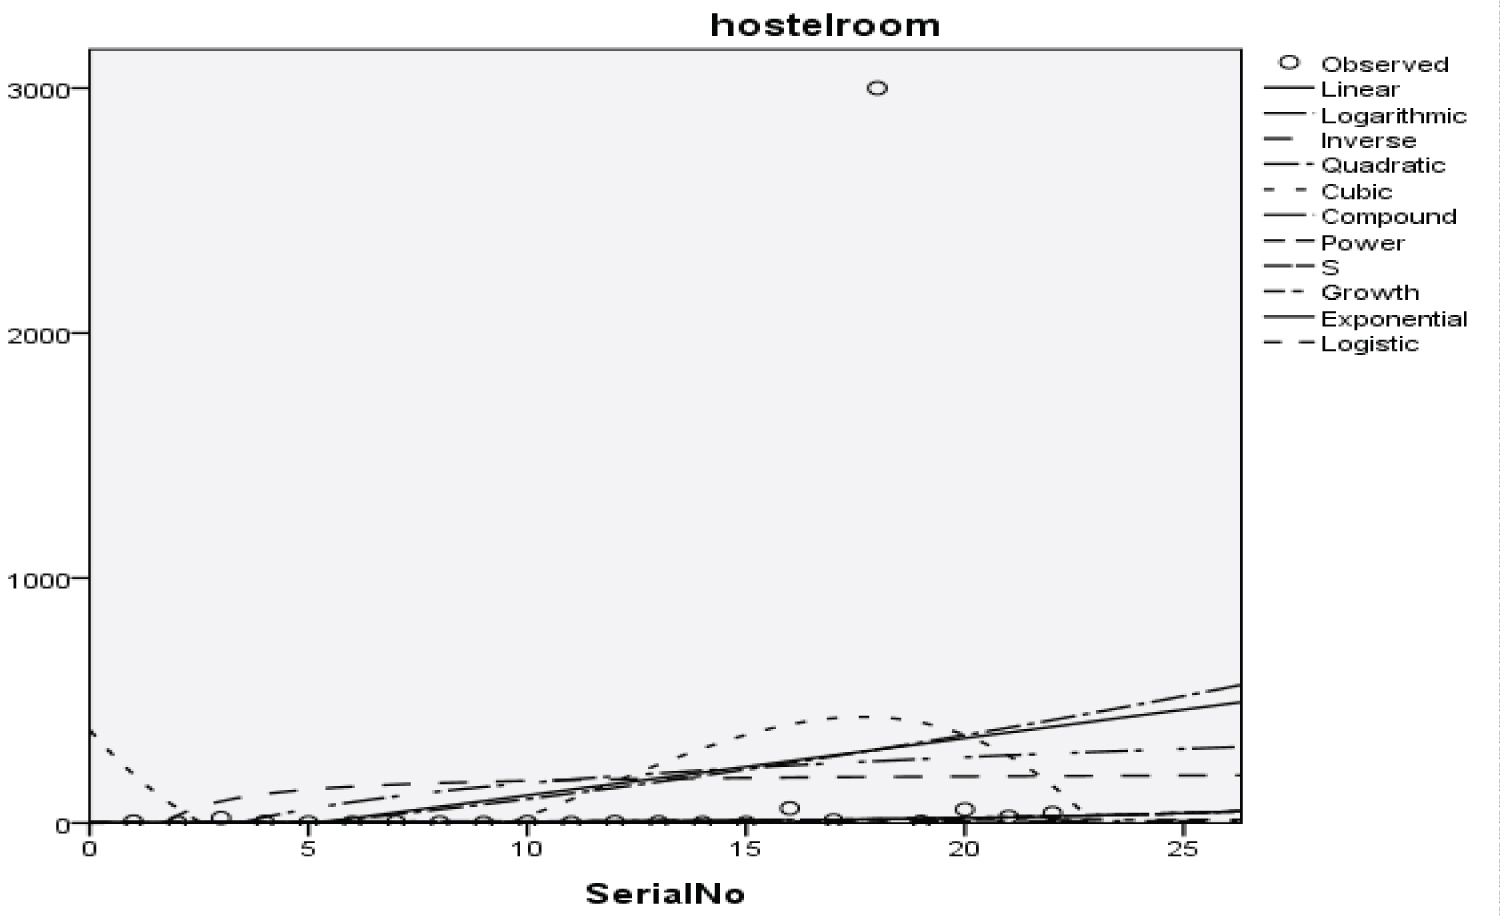 Figure 19: Graphical representation of regression models of hostel room.
View Figure 19
Figure 19: Graphical representation of regression models of hostel room.
View Figure 19
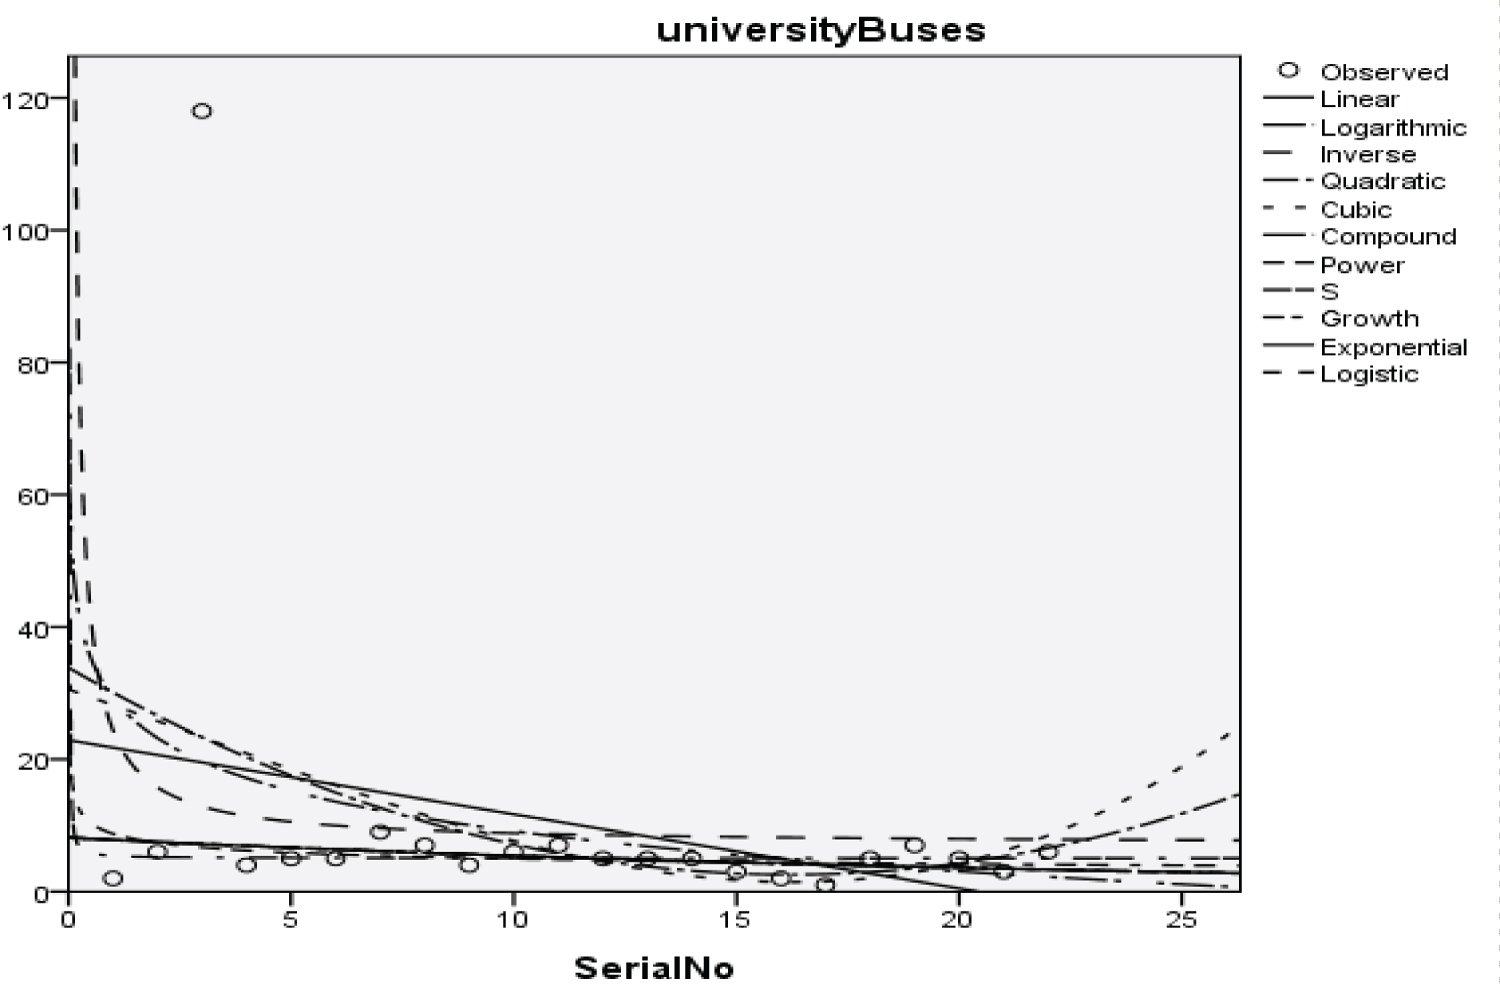 Figure 20: Graphical representation of regression models of university buses.
View Figure 20
Figure 20: Graphical representation of regression models of university buses.
View Figure 20
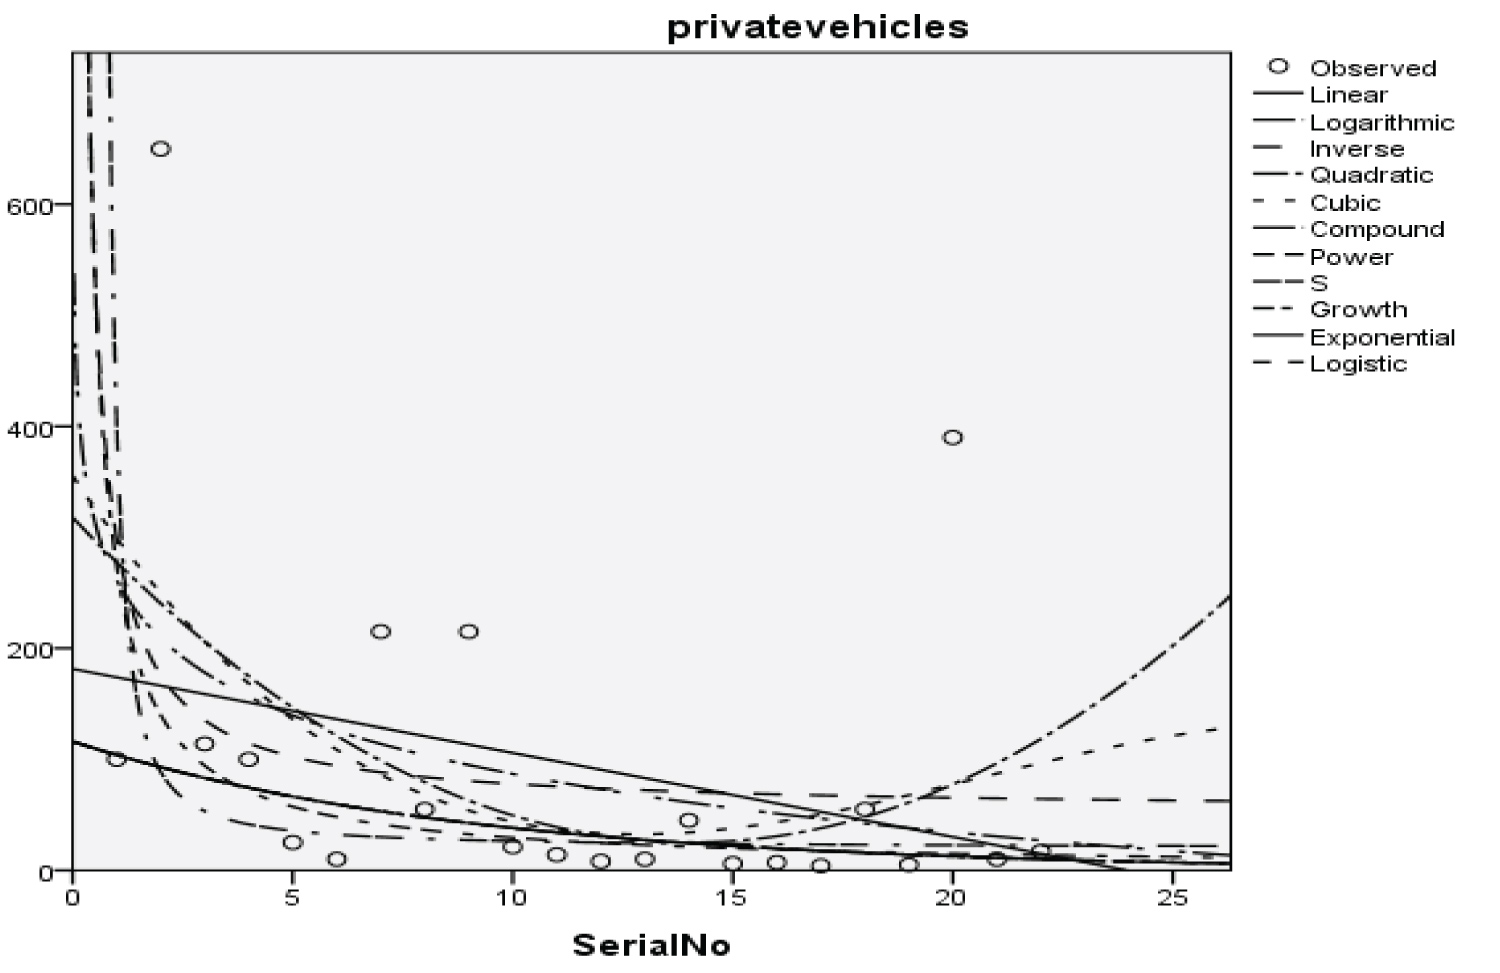 Figure 21: Graphical representation of regression models of private vehicles.
View Figure 21
Figure 21: Graphical representation of regression models of private vehicles.
View Figure 21
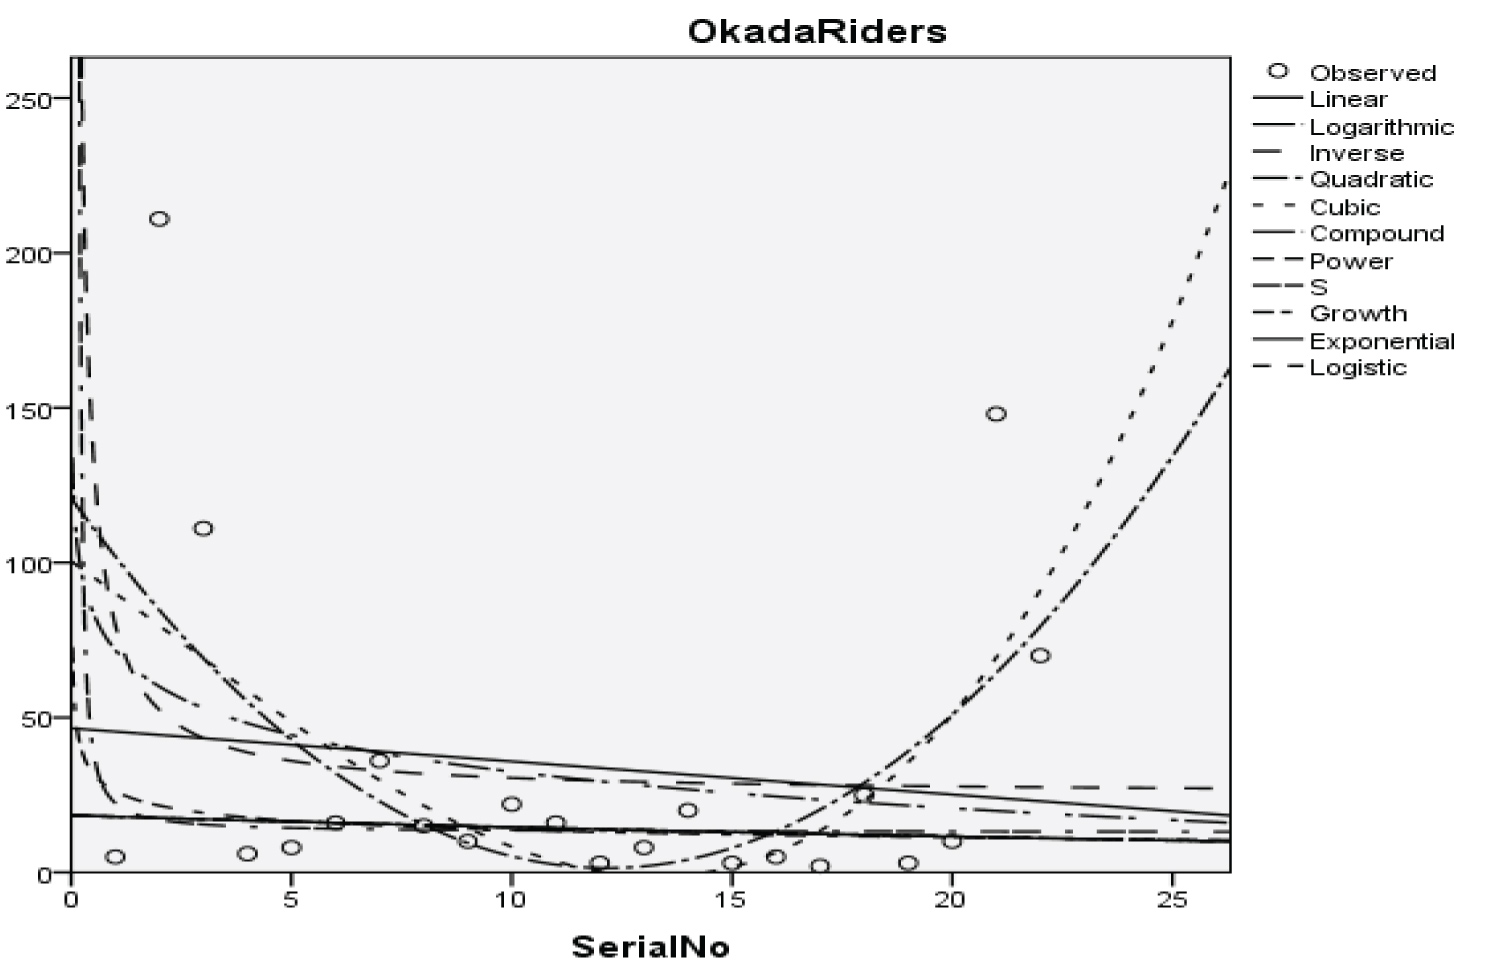 Figure 22: Graphical representation of regression models of Okada riders.
View Figure 22
Figure 22: Graphical representation of regression models of Okada riders.
View Figure 22
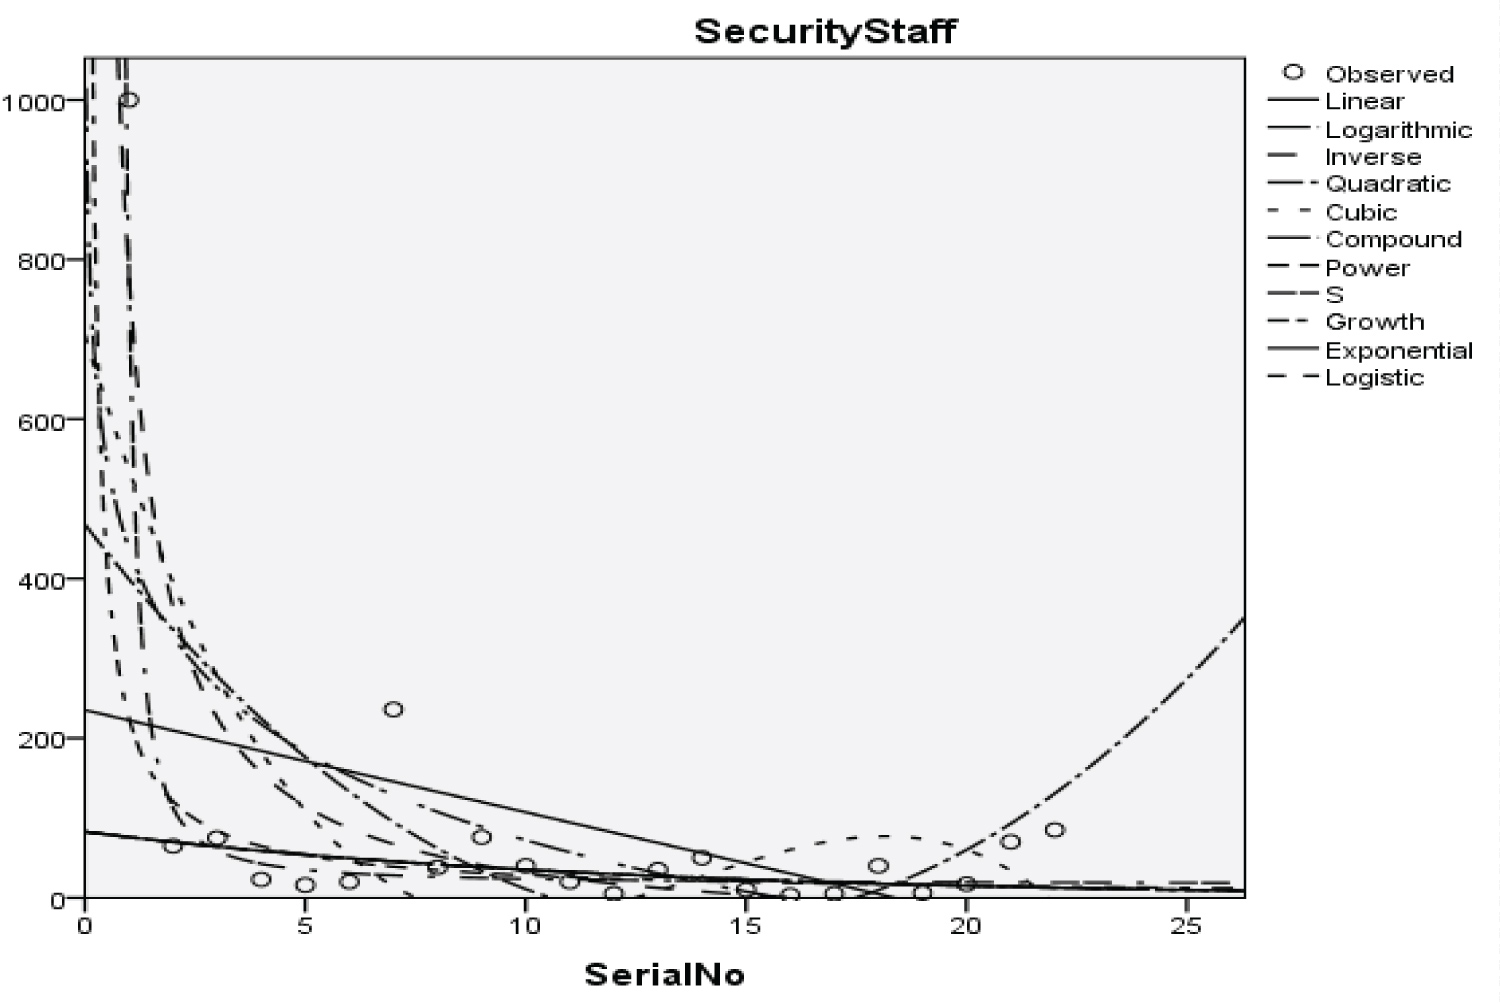 Figure 23: Graphical representation of regression models of security staff.
View Figure 23
Figure 23: Graphical representation of regression models of security staff.
View Figure 23
Table 3: Summary result for cubic regression model on students. View Table 3
Table 4: Summary result for quadratic regression model on parents. View Table 4
Table 5: Summary result for inverse regression model on academic staff. View Table 5
Table 6: Summary result for power regression model on non-academic staff. View Table 6
Table 7: Summary result for quadratic regression model on health worker. View Table 7
Table 8: Summary result for cubic regression model on Zankli staff. View Table 8
Table 9: Summary result for cubic regression model on Zankli visitors. View Table 9
Table 10: Summary result for compound regression model on general visitors. View Table 10
Table 11: Summary result for compound regression model on health center. View Table 11
Table 12: Summary result for compound regression model on visitor to health center. View Table 12
Table 13: Summary result for compound regression model on staff food vendor. View Table 13
Table 14: Summary result for regression models on provision staff. View Table 14
Table 15: Summary Result of Exponential Regression Models on Chapel. View Table 15
Table 16: Summary result for logistic regression model on Chapel. View Table 16
Table 17: Summary result for cubic regression models on classroom. View Table 17
Table 18: Summary result for power regression models on staff office model summary. View Table 18
Table 19: Summary result for cubic regression models on laboratories. View Table 19
Table 20: Summary result for cubic regression models on the sport complex. View Table 20
Table 21: Summary result for compound regression models on hostel room model summary. View Table 21
Table 22: Summary result for quadratic regression models on university buses model summary. View Table 22
Table 23: Summary result for cubic regression model on university buses. View Table 23
Table 24: Summary result for power regression models on private vehicles model summary. View Table 24
Table 25: Summary result for cubic regression models on Okada riders model summary. View Table 25
Table 26: Summary result for inverse regression models on security staff model summary. View Table 26
Y = -598.448x3 + 73.613x2 - 2.322x + 2135.878 (13)
With the p-value of 1.284, 1.582, 1.743 and 1.687 respectively and with a coefficient of determination (R2): 0.176
Y = -252.253x2 + 8.929x + 1736.338 (14)
With the p-value of 3.447, 2.890, and 4.753 respectively and with a coefficient of determination (R2): 0.45
Y = 25.148 + (15)
With the p-value of 6.410 and 0.260 respectively and with a coefficient of determination (R2): 0.673.
y = x-1.133 + 1792.066 (16)
With the p-value of 3.147 and 1.184 respectively and with a coefficient of determination (R2): 0.331.
Y = -29.357x2 + 0.698x + 332.403 (17)
With a p-value of 3.058, 1.721, and 6.936 respectively, and with a coefficient of determination (R2): 0.659.
Y = 42.020x3 - 4.680x2 + 0.128x + 8.459 (18)
With the p-value of 4.480, 4.997, 4.780, and 0.332 respectively and with a coefficient of determination (R2): 0.794
Y = 20.479x3 - 2.802x2 + 0.085x + 32.623 (19)
With the p-value of 3.472, 4.758, 5.065, and 2.036 respectively and with a coefficient of determination (R2): 0.823
Y = 818.782 (0.834x) (20)
With the p-value of 15.011 and 1.143 respectively and with a coefficient of determination (R2): 0.271
Y = 381.819 (0.831x) (21)
With the p-value of 25.138 and 1.914 respectively and with a coefficient of determination (R2): 0.519
Y = 439.207 (0.826x) (22)
With the p-value of 18.246 and 1.389 respectively and with a coefficient of determination (R2): 0.378
Y = 641.704 (0.831x) (23)
With the p-value of 20.485 and 1.560 respectively and with a coefficient of determination (R2): 0.473
Y = 146.846 (0.848x) (24)
With the p-value of 21.138 and 1.609 respectively and with a coefficient of determination (R2): 0.378
Y = 310.126 (e-0.224x) (25)
With the p-value of 5.212 and 1.768 respectively and with a coefficient of determination (R2): 0.576
Y = -130.438x3 + 12.544x2 - 0.352x + 459.366 (26)
With the p-value of 1.305, 1.257, 1.232, and 1.692 respectively and with a coefficient of determination (R2): 0.329
y = x-1.081 + 417.250 (27)
With the p-value of 2.245 and 0.885 respectively and with a coefficient of determination (R2): 0.201
Y = -3.941x3 + 0.164x2 - 0.002x + 33.014 (28)
With the p-value of 0.626, 0.261, 0.099, and 1.930 respectively and with a coefficient of determination (R2): 0.191
Y = -11.339x3 + 1.242x2 - 0.036x + 35.542 (29)
With the p-value of 1.560, 1.712, 1.739, and 1.801 respectively and with a coefficient of determination (R2): 0.152
Y = -2.014x3 + 0. .228x2 - 0.007x + 7.043 (30)
With the p-value of 0.984, 1.116, 1.125, and 1.267 respectively and with a coefficient of determination (R2): 0.096
Y = 1.398 (1.144x) (31)
With the p-value of 25.138 and 1.914 respectively and with a coefficient of determination (R2): 0.214
Y = -3.862x2 - 0.119x + 33.851 (32)
With the p-value of 1.152, 0.842, 1.739, and 2.023 respectively and with a coefficient of determination (R2): 0.123
y = x-0.971 + 273.820 (33)
With the p-value of 2,794 and 1.227 respectively and with a coefficient of determination (R2): 0.281
Y = -10.059x3 - 0.210x2 + 0.029x + 100.409 (34)
With the p-value of 0.556, 0.116, 0.570, and 2.043 respectively and with a coefficient of determination (R2): 0.327
Y = -51.6 + (35)
With the p-value of 7.450 and 1.713 respectively and with a coefficient of determination (R2): 0.735
The Students, Parents, Academic Staff, Non- Academic Staff, Health Workers, Zanki Staff, Zanki Visitors, General Visitors, Health Centre, Visitors to Health Centre, Food Vendors, Provision Staff, Chapel, Classrooms, Staff Offices, Laboratories, Sport Complex, Hall, Hostel Rooms, University Buses, Private Vehicles, Okada Riders and Security Staff and their interactions were used as variables to predict the spread of Covid-19 in BHU. From the foregoing, the analysis and results obtained, linear regression did not past all the six assumptions required (i) there need to be a linear relationship between the two variables; (ii) there should be no significant outliers; (iii) data needs to be homoscedasticity except: (i) two variable should be measured the continuous level; (ii) independency of observations; (iii) the residuals of the regression line are approximately normally distributed as all the six assumptions required are depicted in Figure 1, Figure 2, Figure 3, Figure 4, Figure 5, Figure 6, Figure 7, Figure 8, Figure 9, Figure 10, Figure 11, Figure 12, Figure 13, Figure 14, Figure 15, Figure 16, Figure 17, Figure 18, Figure 19, Figure 20, Figure 21, Figure 22 and Figure 23. The regression models are usually used to: test hypothesis, select variables for prediction models or generate prediction models. Regression models are particularly suited to assess the correlation among variables and to establish the dependence of one variable upon others, the regression models can be used effectively by clinician to make a diagnosis or assess prognosis. Calculation of the value of predictor variables singly or in combination might be of greater interest to the medical investigation more concerned with the assessment of the pathophysiology of disease or to the therapist attempting to improve survival by modulating risk factors. This research briefly examines the interpretation and use of regression models, particularly with regard to estimating and evaluating the dependence relationships. The selections of variables for prediction models are dealt with only as it pertains to the use of regression models. The use of regression for hypothesis testing is ignored. While each variable with its interactions to other variables is predicted with the following models: Cubic regression model of students with the p-value of 1.284, 1.582, 1.743 and 1.687 respectively and with a coefficient of determination (R2): 0.176.Quadratic regression model of parents with the p-value of 3.447, 2.890, and 4.753 respectively and with a coefficient of determination (R2): 0.450.Inverse regression model of academic staff with the p-value of 6.410 and 0.260 respectively and with a coefficient of determination (R2): 0.673.Power regression model of non-academic staff with the p-value of 3.147 and 1.184 respectively and with a coefficient of determination (R2): 0.331. Quadratic regression model of health workers with a p-value of 3.058, 1.721, and 6.936 respectively, and with a coefficient of determination (R2): 0.659.Cubic regression model of Zankli staff with the p-value of 4.480, 4.997, 4.780, and 0.332 respectively and with a coefficient of determination (R2): 0.794. Cubic regression model of Zankli visitors with the p-value of 3.472, 4.758, 5.065, and 2.036 respectively and with a coefficient of determination (R2): 0.823. Compound regression model of general visitors with the p-value of 15.011 and 1.143 respectively and with a coefficient of determination (R2): 0.271. Compound regression model of health center with the p-value of 25.138 and 1.914 respectively and with a coefficient of determination (R2): 0.519. Compound regression model of visitor to health center with the p-value of 18.246 and 1.389 respectively and with a coefficient of determination (R2): 0.378. Compound regression model of staff food vendor with the p-value of 20.485 and 1.560 respectively and with a coefficient of determination (R2): 0.473. Compound regression model of provision staff with the p-value of 21.138 and 1.609 respectively and with a coefficient of determination (R2): 0.378. Exponential regression model of chapel with the p-value of 5.212 and 1.768 respectively and with a coefficient of determination (R2): 0.576. Cubic regression model of classroom with the p-value of 1.305, 1.257, 1.232, and 1.692 respectively and with a coefficient of determination (R2): 0.329. Power regression model of staff office with the p-value of 2.245 and 0.885 respectively and with a coefficient of determination (R2): 0.201. Cubic regression model of laboratories with the p-value of 0.626, 0.261, 0.099, and 1.930 respectively and with a coefficient of determination (R2): 0.191. Cubic regression model of sport complex with the p-value of 1.560, 1.712, 1.739, and 1.801 respectively and with a coefficient of determination (R2): 0.152. Cubic regression model of halls with the p-value of 0.984, 1.116, 1.125, and 1.267 respectively and with a coefficient of determination (R2): 0.096. Compound regression model of hostel room with the p-value of 25.138 and 1.914 respectively and with a coefficient of determination (R2): 0.214. Quadratic regression model of university buses with the p-value of 1.152, 0.842, 1.739, and 2.023 respectively and with a coefficient of determination (R2): 0.123. Power regression model of private vehicles with the p-value of 2,794 and 1.227 respectively and with a coefficient of determination (R2): 0.281. Cubic regression model of Okada riders with the p-value of 0.556, 0.116, 0.570, and 2.043 respectively and with a coefficient of determination: 32.7. Inverse regression model of security staff with the p-value of 7.450 and 1.713 respectively and with a coefficient of determination (R2): 0.735. From the foregoing, while the pandemic is still witnessing exponential increase and fall on the daily basis, this study describes the entire trajectory of COVID-19 pandemic in the BHU as a risk assessment paradigm. Clearly, Figure 1, Figure 2, Figure 3, Figure 4, Figure 5, Figure 6, Figure 7, Figure 8, Figure 9, Figure 10, Figure 11, Figure 12, Figure 13, Figure 14, Figure 15, Figure 16, Figure 17, Figure 18, Figure 19, Figure 20, Figure 21, Figure 22 and Figure 23 present simulation of individual interactions on the campus to checkmate probability of an infected case while equation (12) predicts summation of infected numbers on campus.
This work has reported risk assessment of COVID-19 pandemic at Bingham University Community. The statistical models used for the study involved linear regression model, logarithmic regression model, inverse regression model, quadratic regression model, cubic regression model, power regression model, compound regression model, exponential regression model, growth regression model, logistic regression model, and S-curve model. The analysis of the data presented in Table 1, shows that Zankli visitors, Zankli staff and security staff are most vulnerable to infection outbreak with coefficient of determination at 0.823, 0.794 and 0.735 respectively. The Zankli visitors and Zankli staff data fitted most in cubic regression model, while the data for security staff fitted the inverse regression model. A new statistical model was developed as shown in equation (12); this is our logistic model. A high value of T in equation (12) indicates high probability of COVID-19 outbreak on the university campus and vice versa.
While writing this conclusion, there is no reported case of Coronavirus infection in the BHU Community. However, the number of affected cases in Nigeria is still on a rise as the Country is now in a second wave pandemic. Therefore, COVID-19 protocols as specified by WHO and the federal government of Nigeria need to be strengthened at all costs and students' behavior as well as the entire university community in order to prevent the outbreak on the campus. In Nigeria, it is difficult for the current health infrastructure to accommodate and treat the risen number of COVID-19 patients as had seen in the early phase of the second wave, it is best to follow the preventive protocols. This paper is an assessment tool to the university to ascertain the individual behavior, social compliance and exposure factors in order to find out relevant areas of non-pharmaceutical intervention and at the same time increase awareness generation among the university community. This is more of a surveillance gadget to the university management to ensure safety and adherence to preventive measures while the university operates with caution.
The authors would like to express sincere gratitude to all the researchers whose works have being cited in this study.
This research has been funded by the Bingham University, Karu, via Zankli research Centre, Nigeria.
The authors declare no conflict of interest.
No required.
Bimba John Samson and Isah Omeiza Haroun conceived the original idea and planned the research. Emmanuel Azuaba and Tamber Abraham Jighjigh carried out the research and analyzed the data. Yusuf Musa wrote the manuscript with support from Akude Christian and Oniore Jonathan Ojarikre. Emmanuel Azuaba managed the research while Edwin Ehi Eseigbe and Bimba John Samson supervised the project.