The search for methods to evaluate the extent and severity of skin lesions, such as burns and other skin disorders, has been a subject of extentive research. While suction testing, elastography and other tests can be done noninvasively on intact skin, these tests cannot be done on burns and open wounds due to the possible injury that may occur. In addition, they fail to yield comparable results obtained using destructive tests such as uniaxial tensile testing.
We have developed a technique to combine optical coherence tomography (OCT) with vibrational analysis (VOCT) to non-invasively and non-destructively evaluate the properties of skin and wounds. The result of this analysis is a "virtual biopsy" of skin and burn tissue that can be correlated with the extent of healing. In this study we perform a comparative analysis of thermal and chemical burns and normal skin by scanning OCT images and measuring the elastic moduli of normal skin and thermal and chemical burn scars.
It is concluded that the scans of OCT images and measurements of resonant frequency and moduli of burn scars show differences when compared to measurements made on normal skin. In both thermal and chemically induced scar tissue the absence of the rete pegs results in a change in slope of the average pixel intensity versus depth profiles suggesting that the loss of the rete pegs in burn wounds and perhaps skin lesions can be diagnosed non invasively using the "virtual biopsy". Using the "virtual biopsy" it is possible to follow changes in the morphology and physical properties of the epidermis and dermis to evaluate the extent of healing and the effects of therapeutic treatments used to treat skin lesions and wounds.
Epidermis, Scar, Skin, Wound, Wound healing, Collagen, Resonant frequency, Modulus, Stiffness, Mechanical properties, Optical coherence tomography, Vibrational optical coherence tomography, Virtual biopsy, Pixel intensity
OCT: Optical Coherence Tomography; VOCT: Vibrational Optical Coherence Tomography; ECM: Extracellular Matrix; BCC: Basal Cell Carcinoma; SCC: Squamous Cell Carcinoma; IED: Improvised Explosive Device
The search for quantitative methods to noninvasively evaluate the structure and properties of skin and wounds has been a subject of much research for many years [1-5]. While several methods such as cutaneous suction testing [4] and optical coherence elastography have been used to evaluate the mechanical properties of skin [5], these methods fail to produce modulus values that are consistent with those produced from in vitro studies using conventional testing methods such as uniaxial tensile testing [1-3,6-16]. Modulus values have been reported for skin that range from less than 1 MPa at strains of several percent to over 20 MPa at high strains [1-3,6-16]. Any measurement of mechanical properties of skin in vivo must replicate the values that are observed with conventional methods such as tensile testing in vitro.
Modulus measurements made on animal skin and dermal wounds in vitro have been correlated with changes in collagen fiber diameters and the extent of wound healing of the dermis [6]. In addition, modulus has been correlated with the morphology of human hypertrophic scar tissue [7] suggesting that the morphology and mechanical properties of the epidermis and dermis give potentially important information on the structure and condition of skin, skin lesions and wound tissues. While under most conditions the epidermis contributes little to the mechanical properties of skin, when the epidermis thickens, as observed in cancerous lesions, a contribution of this layer to tissue stiffness can be observed [1, 2,15-17].
Recently, we have developed a technique to combine optical coherence tomography (OCT) with vibrational analysis (VOCT) to image and analyze the biomechanical properties of tissues non-invasively and non-destructively [8-14]. The result of this analysis is a "virtual biopsy" of skin along with a physical analysis of the major components of the epidermis and dermis [8-16]. These measurements combined with in vitro calibration data can be used to interpret mechanical measurements made in vivo [8-16]. VOCT has been used to image and measure the mechanical properties of skin and skin cancers, benign skin lesions, bovine cartilage and bone, decellularized human dermis, human cornea and sclera and synthetic polymers as recently reported [8-16].The purpose of this paper is to compare the images and mechanical measurements made on normal skin and thermal and chemical burn scars. Scans of the OCT images reported in the paper indicate that the presence or absence of the rete pegs can be determined non-invasively using VOCT.
In Vitro Calibration Curve Construction Using Measurements Made on Extracellular Matrices (ECMs).
Vibrational optical coherence tomography (VOCT) is a new technique developed in the Department of Pathology at Robert Wood Johnson Medical School, Rutgers, the State University of New Jersey. It uses near infra-red light and audible sound to image and measure the resonant frequency of tissues [8-17]. The resonant frequency of a tissue is directly related to the tissue stiffness as described previously [8-17]. A schematic diagram of VOCT is shown in Figure 1. An OCT image of the sample is first obtained using near infra-red light in the scanning mode. Once the image is obtained, a frequency generator is turned on and audible sound impinges on the sample. The sound causes a small transverse deflection to the sample and the displacement is measured at a fixed point as a function of the applied sound frequency in the B mode. The resonant frequency is defined as the frequency at which the maximum sample deflection is observed as is indicated in Figure 2.
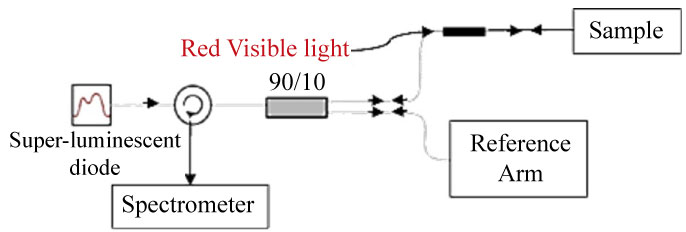 Figure 1: Diagrammatic illustration of the set-up for vibrational optical coherence tomography (VOCT). In OCT, near infra-red light from a laser diode is split into two beams. One beam goes directly to a detector while the other beam hits the sample and is mixed with the incident beam to generate an image in the scanning mode. In the B mode where the light does not scan across the sample but is fixed at a single point, application of a sinusoidal sound wave perpendicular to the sample surface causes a displacement in the sample that is imaged with the light beam. The frequency at which the maximum displacement of the sample occurs is the resonant frequency. The resonant frequency squared is related to the modulus or stiffness of a material as described previously [8-17].
View Figure 1
Figure 1: Diagrammatic illustration of the set-up for vibrational optical coherence tomography (VOCT). In OCT, near infra-red light from a laser diode is split into two beams. One beam goes directly to a detector while the other beam hits the sample and is mixed with the incident beam to generate an image in the scanning mode. In the B mode where the light does not scan across the sample but is fixed at a single point, application of a sinusoidal sound wave perpendicular to the sample surface causes a displacement in the sample that is imaged with the light beam. The frequency at which the maximum displacement of the sample occurs is the resonant frequency. The resonant frequency squared is related to the modulus or stiffness of a material as described previously [8-17].
View Figure 1
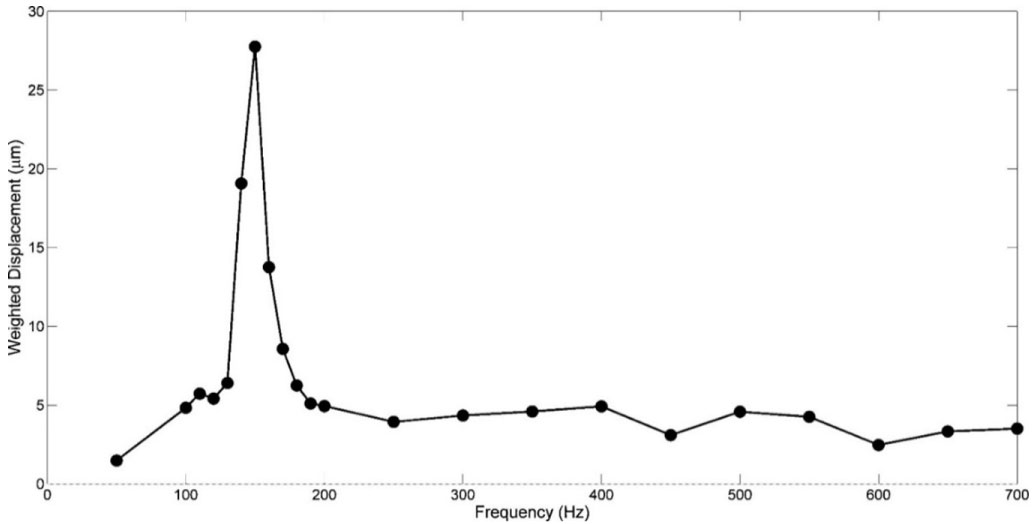 Figure 2: Weighted displacement versus frequency for decellularized human dermis. The frequency at which the maximum displacement of a sample occurs is defined as the resonant frequency and is related to the modulus of a material. Note the sharpness of the peak defines the material heterogeneity. The weighted displacement versus frequency data shown is for decellularized human dermis which has a modulus of about 2 to 3 MPa at a strain of 5% in vitro [11].
View Figure 2
Figure 2: Weighted displacement versus frequency for decellularized human dermis. The frequency at which the maximum displacement of a sample occurs is defined as the resonant frequency and is related to the modulus of a material. Note the sharpness of the peak defines the material heterogeneity. The weighted displacement versus frequency data shown is for decellularized human dermis which has a modulus of about 2 to 3 MPa at a strain of 5% in vitro [11].
View Figure 2
A calibration curve of modulus values for control ECMs is constructed by comparing moduli measured using conventional tensile testing and VOCT measurements in vitro as previously described [8-17]. The constructed calibration curve shows a one-to-one relationship between tensile moduli and vibrational moduli measured on the same samples including decellularized human dermis, pig skin, and bovine cartilage [8-14]. The resonant frequency was determined after correction for the resonant frequencies exhibited by the speaker, sample holders and any interference due to line fluctuations [8-14]. The weighted displacement is the sample displacement divided by the displacement measured in the absence of the sample.
OCT cross-sectional images were obtained using an OQ Labscope (Lumedica Inc., Durham, NC) modified to do VOCT [8-16].
Scans of OCT images, composed of a matrix of 512 × 512 pixels, were constructed from sample areas with dimensions of 5 mm by 1.8 mm. The gray scale OCT image was made up of pixels that had intensities that varied from 0 to 255. The curvature of each scan was adjusted to follow the top layer of the sample which was used as the starting point. This curved line, that followed the image surface, was considered the zero depth. For this curved line and subsequent parallel curved lines at each depth, the average gray scale pixel intensity was calculated. The average gray scale pixel intensity was determined as the sum of all the pixel intensities between 0 and 255 measured at each point of the line and then divided by the number of points used to create this sum.
Transverse sample displacement was generated by placing a speaker on or next to the skin as discussed previously [8-17]. The spectral-domain optical coherence tomography (SD-OCT) system uses a fiber-coupled superluminescent diode light source with an 810 nm center wavelength and 100 nm bandwidth (full-width at half maximum) [8-17].
In vivo studies on the mechanical properties of skin, a healed thermal burn (approximately 8-years-old from a 67-year-old male) and a healed chemical burn that resulted from an IED explosion (approximately 25-years-old from a 48-year-old male) were conducted by hard wiring a speaker to a Samsung cell phone or by placing a blue tooth activated speaker next to the area of tissue to be studied. All studies were conducted at 75 °F and 40% to 50% relative humdidity. A frequency generating app was downloaded onto the cell phone or Dell Computer. This app was capable of driving the speaker between 30 and 20,000 Hz. The speaker was then applied to the skin using surgical tape or just placed near the skin. During in vivo measurements, no sensation of the light or sound impinging on the skin was felt. A chemical burn wound on a veteran exposed to an exploding IDE was examined after informed consent was received. The sound generated by the speaker placed near the skin could be heard during the examination but not felt on the skin; the sound was never above 60 decibels.
The resonant frequency of each sample was initially estimated by measuring the transverse displacement resulting from sinusoidal driving frequencies ranging from 30 Hz to 500 Hz, in steps of 20 Hz. Once the region where the maximum displacement was identified, smaller steps of 10 Hz were used to more accurately identify the peak frequency (the resonant frequency), fn. The moduli of skin and skin lesions were calculated from measurements of the resonant frequency and tissue thickness made using VOCT and images of the tissues. Moduli were then obtained from a calibration curve that relates resonant frequency and thickness to modulus values (Figure 3). The moduli of each sample was obtained by determination of the resonant frequency from Figure 4 and then dividing by the tissue thickness obtained from the enhanced OCT image. Once this ratio was obtained, the modulus was determined from Figure 3.
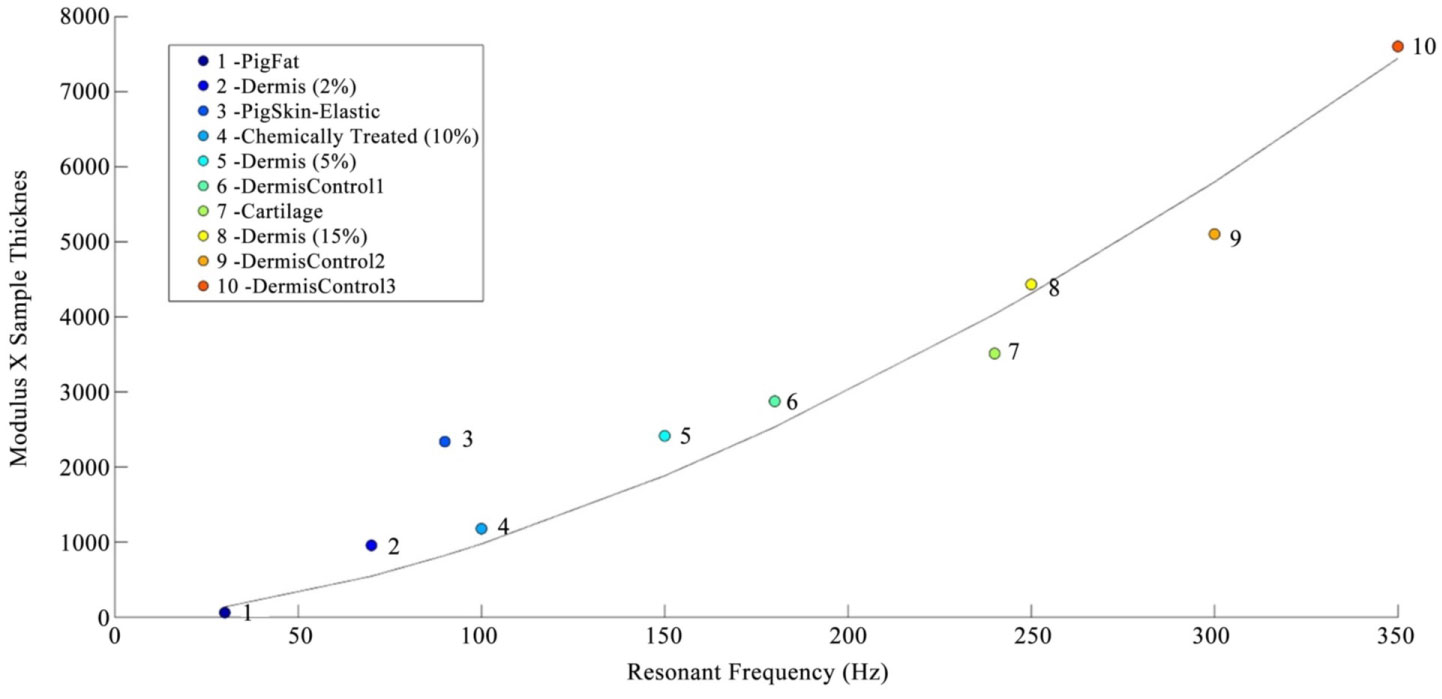 Figure 3: Calibration curve of tissue modulus times thickness versus resonant frequency for different extracellular matrices. This figure was modified from reference [11]. Note the modulus for cellular materials (fat and Staph Aureus) is lower (less than 0.1 MPa) than for normal dermal collagen (2 to 3 MPa) and thermal scar tissue (7 MPa). Calibration samples include decellularized human dermis at different values of the external strain, porcine fat, pig skin elastic tissue, and bovine cartilage.
View Figure 3
Figure 3: Calibration curve of tissue modulus times thickness versus resonant frequency for different extracellular matrices. This figure was modified from reference [11]. Note the modulus for cellular materials (fat and Staph Aureus) is lower (less than 0.1 MPa) than for normal dermal collagen (2 to 3 MPa) and thermal scar tissue (7 MPa). Calibration samples include decellularized human dermis at different values of the external strain, porcine fat, pig skin elastic tissue, and bovine cartilage.
View Figure 3
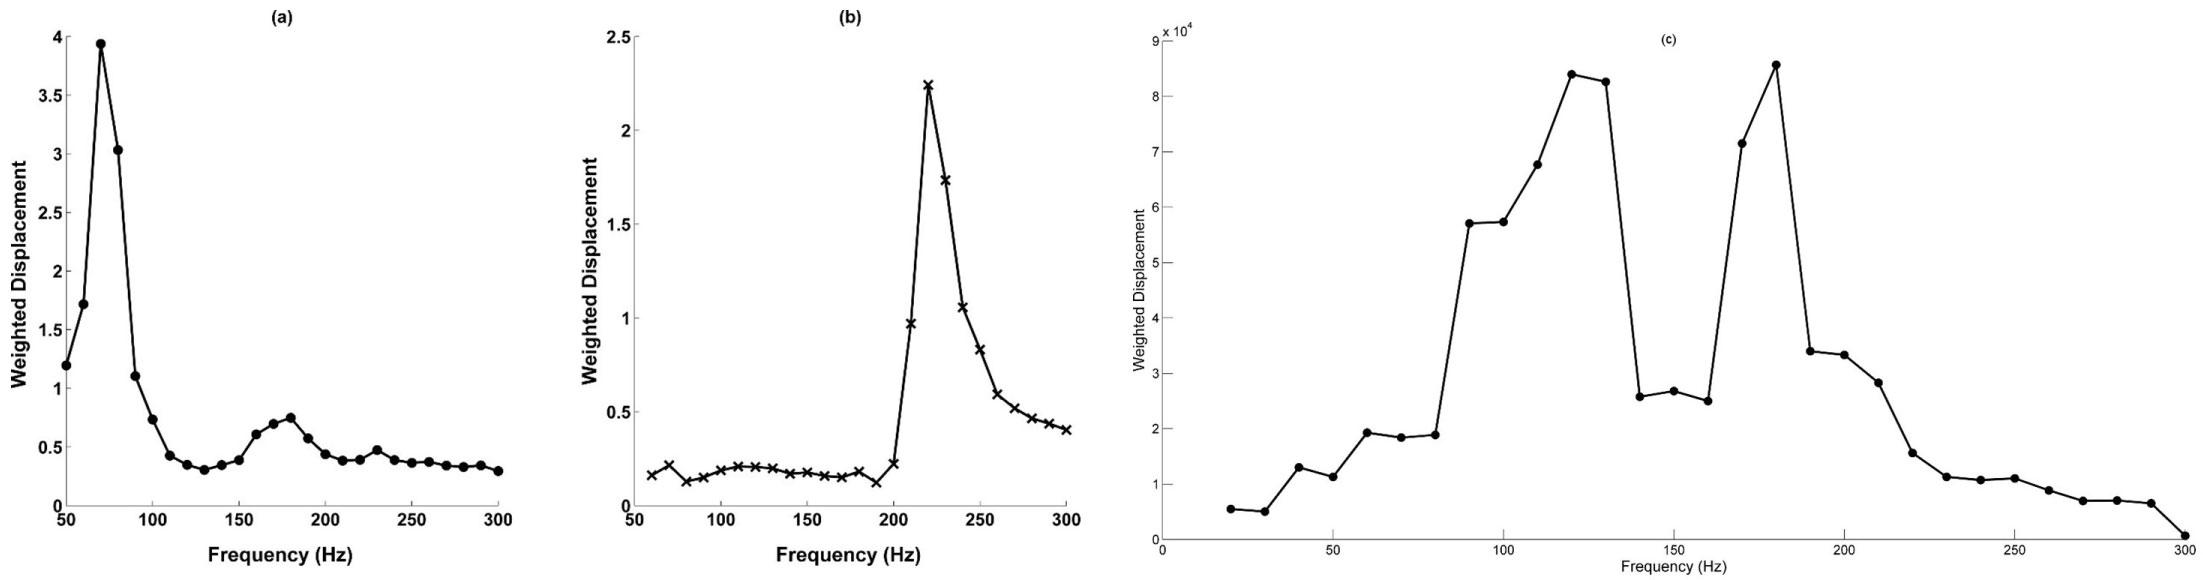 Figure 4: a) Weighted displacement versus frequency for human skin; b) Thermally induced scar tissue; and c) Chemical burn induced scar tissue. The resonant frequency of normal skin is much lower than that of neighboring scar tissue while the interface between normal skin and scar tissue is characterized by the resonant frequencies of both tissues (data not shown). The weighted displacement of a sample was obtained by dividing the displacement observed at a frequency by the displacement measured in the absence of the sample as described previously [8-17]. Note the sharpness of the peak for thermal scar tissue suggests that this scar has healed completely. The epidermis in both normal skin and scar tissue is too thin to measure a resonant frequency. However, when the eidermis thickens, such as in benign and cancerous lesions, the resonant frequency can then be measured as recently reported [14-17].
View Figure 4
Figure 4: a) Weighted displacement versus frequency for human skin; b) Thermally induced scar tissue; and c) Chemical burn induced scar tissue. The resonant frequency of normal skin is much lower than that of neighboring scar tissue while the interface between normal skin and scar tissue is characterized by the resonant frequencies of both tissues (data not shown). The weighted displacement of a sample was obtained by dividing the displacement observed at a frequency by the displacement measured in the absence of the sample as described previously [8-17]. Note the sharpness of the peak for thermal scar tissue suggests that this scar has healed completely. The epidermis in both normal skin and scar tissue is too thin to measure a resonant frequency. However, when the eidermis thickens, such as in benign and cancerous lesions, the resonant frequency can then be measured as recently reported [14-17].
View Figure 4
The original grayscale OCT images of skin and skin lesions were pseudo color-coded based on the pixel intensities to provide better images of the tissue components. The enhanced OCT images used darker colored (blue and purple) regions to reflect lower pixel intensities while the lighter (yellowish) regions reflected higher pixel intensity regions. The pixel scans of the images were conducted on gray scale images not color coded images.
OCT images of skin and scar tissue were obtained in vivo from a thermal scar (Figure 5). The interface between normal skin and scar tissue is observed with a resolution of about 0.04 mm (Figure 5). The epidermis is quite thin both in normal skin and healed scar tissue and the cellular layers are visible after color coding the image based on pixel densities as is shown in Figure 5. The stratum corneum (C), granulosum (G), spinosum (S) and basale (B), and the papillae in the dermis (P) are labeled in the enhanced OCT image and L marks the spot where the stratum lucidum is seen in thick skin (see histological section in Figure 5) A plot of weighted displacement versus frequency for normal skin, thermal and chemical scar tissue is shown in Figure 4. Note the resonant frequency of thermal scar tissue is much higher than that of normal skin in vivo. The epidermis of skin and scar are too thin to measure the resonant frequencies of these layers. However, if the epidermis proliferates the resonant frequency of the epidermis can be measured as recently demonstrated for benign and malignant skin lesions [15-17].
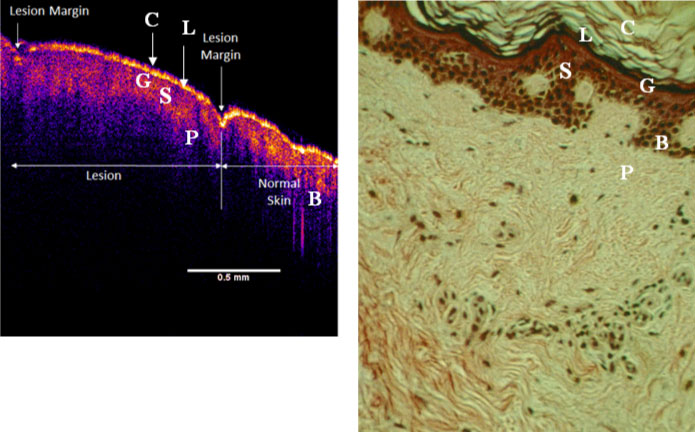 Figure 5: Enhanced OCT image of normal human skin and thermally induced scar tissue dneoted as lesion (left) and histology of cadaver skin (right). The OCT image and histological section are shown at approximately the same magnification. The stratum corneum is marked by the letter C in both the OCT image and the histological section, while the letter G marks the stratum granulosum, S the stratum spinosum, B the stratum basale and P marks the collagen fibers of the papillary dermis. Note the theoretical location of the stratum lucidum (L) is shown in the enhanced OCT image; it is only found in areas of the human body that possess thick skin.
View Figure 5
Figure 5: Enhanced OCT image of normal human skin and thermally induced scar tissue dneoted as lesion (left) and histology of cadaver skin (right). The OCT image and histological section are shown at approximately the same magnification. The stratum corneum is marked by the letter C in both the OCT image and the histological section, while the letter G marks the stratum granulosum, S the stratum spinosum, B the stratum basale and P marks the collagen fibers of the papillary dermis. Note the theoretical location of the stratum lucidum (L) is shown in the enhanced OCT image; it is only found in areas of the human body that possess thick skin.
View Figure 5
The resonant frequency values obtained from in vivo studies were corrected for differences in tissue thickness using the calibration curve shown in Figure 3 to calculate values of the moduli. The calculated moduli of skin and thermal scar are about 2.0 to 3.0 MPa (skin) and 7.0 MPa (thermal scar) while the chemical scar has moduli of 3.05 and 5.78 MPa (Table 1).
Table 1: Resonant frequencies and moduli values of normal skin, thermal and chemical scar tissue. Note there are two peaks in Figure 4 measured for the chemical burn yielding two moduli. The first modulus (Modulus 1) represents the tissue that is still unhealed and the second modulus (Modulus #2) represents the modulus for the healed tissue. View Table 1
An enhanced OCT image of an IED chemical burn scar is shown in Figure 6. Note the arrow at the interface between the healed skin and scar. The chemical burn wound appears to have a thicker epithelium than for the healed scar shown in Figure 5. Figure 7 shows scans of average gray scale pixel intensity versus depth for nomal skin, thermal and chemical burns. Note the humps in the plots of average pixel intensity versus depth for thermal and chemical scar tissue as opposed to normal skin.
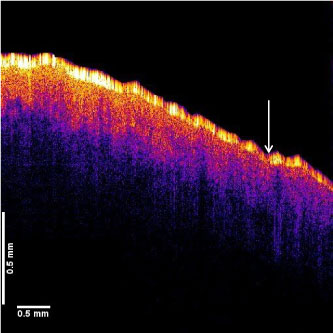 Figure 6: Enhanced OCT image of a chemical burn tissue. The OCT image shows healing scar tissue on left as well as what appears to be healed scar on the right of the arrow. Note the healing scar tissue on left appears hypercellular (high density of yellow spots) compared to the normal skin (Figure 5). Note neither healing or healed scar have undulations that are seen in normal skin (Figure 5).
View Figure 6
Figure 6: Enhanced OCT image of a chemical burn tissue. The OCT image shows healing scar tissue on left as well as what appears to be healed scar on the right of the arrow. Note the healing scar tissue on left appears hypercellular (high density of yellow spots) compared to the normal skin (Figure 5). Note neither healing or healed scar have undulations that are seen in normal skin (Figure 5).
View Figure 6
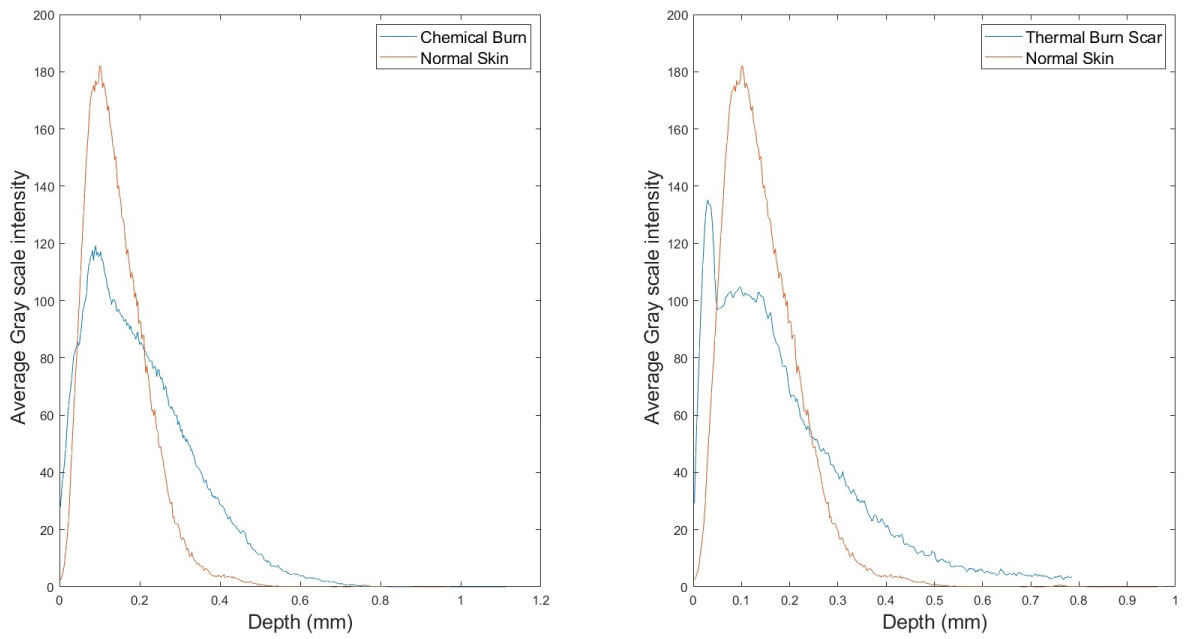 Figure 7: Average gray scale pixel intensity versus depth obtained from scans of images of normal skin and thermal scar (left) and chemical scar tissue (right). Pixel intensities were obtained by scanning across the OCT images at different depths parallel to the sample surface. The pixel intensities at each depth were averaged and plotted versus the depth in mm. Note the higher pixel intensities for normal skin are indicative of the higher cellular content of the epidermis. The rapid slope variation in the average pixel intensity versus depth plots for scar tissue indicate the absence of the normal-epidermal-dermal junction. The loss of the rete pegs at the epidermal-dermal junction appears to lead to a loss of cellular content of the epithelial layer at the the stratum basale.
View Figure 7
Figure 7: Average gray scale pixel intensity versus depth obtained from scans of images of normal skin and thermal scar (left) and chemical scar tissue (right). Pixel intensities were obtained by scanning across the OCT images at different depths parallel to the sample surface. The pixel intensities at each depth were averaged and plotted versus the depth in mm. Note the higher pixel intensities for normal skin are indicative of the higher cellular content of the epidermis. The rapid slope variation in the average pixel intensity versus depth plots for scar tissue indicate the absence of the normal-epidermal-dermal junction. The loss of the rete pegs at the epidermal-dermal junction appears to lead to a loss of cellular content of the epithelial layer at the the stratum basale.
View Figure 7
The need to generate images that include both the epidermis and dermis and provide measurements of the physical properties of tissues and wounds has been an unmet challenge for health care workers for decades. Clinical applications include analysis of the margins and depths of skin lesions, characterization of skin changes associated with genetic connective tissue disorders, proper placement of fillers in the face, analysis of the depth of necrotic skin after burn injuries, characterization of abrasions and venous stasis ulcers, evaluation of the extent of wound healing in chronic wounds, biofilm formation on implants and wounds, and the efficacy of treatments to promote healing and minimize fibrosis and scaring of skin.
We have developed a method to provide "virtual biopsies" that allows for imaging and physical property measurements made on skin and wounds. The application of light and sound used in the "virtual biopsy" does not require contact with the skin eliminating any biocompatibility or hand piece contact issues as well as the possibility of transfer of material from one patient to another. Images of the epidermis obtained by VOCT clearly show all of the cellular layers including the stratum corneum, granulosum and spinosum, and the stratum basale. In addition, the dermal papillae and collagen of the papillary dermis can also be seen.
In normal skin and healed scar the epidermis is very thin and the resonant frequency and modulus of this layer cannot be observed [14-17]. However, in contrast we have reported that the resonant frequency and modulus of the epidermis in skin lesions including, a verrucous carcinoma (SCC), a nodular basal cell carcinoma (BCC), an actinic keratosis and a melanocytic nevus can be measured due to increases in the thickness and modulus of this layer [14-17]. A thickened epidermis in either a malignant or a premalignant lesion is associated with altered cell-to-cell interactions that increase the resonant frequency of the epidermis [14-18]. In a plot of weighted displacement versus frequency the location and width of the epidermal peak appears to shift to the right and broaden in the carcinomas studied [14-17]. In addition, the collagen peak, with a modulus of about 2 MPa, broadens but does not appear to shift to a higher resonant frequency in pre-cancerous and cancerous skin lesions [14,17].
In this study we examine scans of the OCT images of normal skin, thermal and chemical burn scars and report moduli values using VOCT and the "virtual biopsy". The epidermis of thermal and chemical burn scars appears to be less cellular than is observed in normal skin based on the average pixel intensity shown in Figure 7. The absence of an epidermal peak at frequencies between 40 and 60 Hz suggests that the extent of cell-to-cell interactions is similar to that observed in normal skin [15,16]. However, comparing the collagen peak of the healed thermal scar, which has a single resonant frequency about 200-220 Hz with a narrow width, the chemical burn wound has two resonant frequencies one at about 90 Hz and another at about 180 Hz. The resonant frequency at 90 Hz represents a normal collagen network of the papillary dermis with a modulus of about 2.0 to 3.0 Hz while the higher resonant frequency represents remodeled scar collagen with a modulus of about 6.0 MPa (see Table 1). In addition, comparing the width of the resonant frequency peaks for normal skin and the healed thermal burn scar (Figure 4) with the peaks seen in the chemical burn injury (Figure 4), indicates that the latter widths are greater than observed for both normal skin and thermal scar tissue. The width of the resonant frequency peaks may be used to follow the progression of healing of skin wounds since a greater width may reflect a greater level of disorganization of collagenous components that would be expected in granulation tissue compared to normal skin or healed scar tissue.
If one examines the average pixel intensity versus depth scans, it is possible to see that the pixel intensity of the scar tissues is lower than that of normal skin and there is a rapid slope change in the plot at the epidermal-dermal junction (humps seen in Figure 7). The lower pixel intensities of the epidermis found in the scar tissues reflect the lower cellular content compared to normal skin. The hump in the pixel intensity versus displacement curve for the scar tissues reflects the loss of the rete pegs that normally separate the epidermis from the dermis and provide a smooth transition between these skin layers. Since burn lesions of the skin exhibit a loss of the epidermal-dermal junction, the pixel intensity of the epidermal-dermal junction would be an important parameter to be able to non-invasively identify the margins and depth of burn injuries.
The extent of healing of burn wounds can be quantitatively assessed by comparing the heights and widths of the collagen peaks. By following the enhanced OCT images and changes in the resonant frequencies exhibited by the epidermis and dermis, it is possible to follow both disease and healing processes and the efficacy of different therapeutic treatments.
Skin wound healing can be followed by making a "virtual biopsy" of scar tissue and measurement of the resonant frequency and average pixel intensity versus tissue depth in vivo. While the resonant frequency of the epidermis cannot be measured in normal skin and healed scar, it can be measured if thickening of the epidermis occurs as a result of the formation of skin lesions. In the case of burns the extent of healing can be assessed based on the resonant frequencies, peak width, and shift in the collagen peak to higher moduli indicative of scarring and fibrosis. The pixel intensity versus wound depth can be used to evaluate the presence of a normal epidermal-dermal junctions as well as the efficacy of therapeutic treatments to promote healing.
One or more of the authors may receive financial remuneration in the future from the sale of the device used in this research work.