To investigate inherent information provided by 18F-FDG PET to ameliorate shortcomings of relying on visual inspection or sole SUV measurement in treatment assessing.
Twelve patients with newly diagnosed NSCLC and treated with combined Chemoradiotherapy (CRT) were involved in this study. We analyzed the percentage variation of gray value in every gray level or on the whole using histogram analysis algorithm which represents global intensity distribution. We also investigated texture parameters which describe local intensity-spatial distribution and were calculated by Gray Level Co-occurrence Matrix (GLCM). The parameters' variation analysis involved comparison between patient's PET scans of pretreatment and 1 month after treatment completion and correlation between characteristics variation and response degree were analyzed. The texture comparison between the same patient's lesions on one side lung and the corresponding tissue with same size, location on the other side normal lung was involved.
The uniformity degree of gray level distribution on the whole and the maximum ratio decrease were well associated with tumor shrinkage and response degree. In that case, they were capable to differentiate tumor response to CRT. Texture parameters' variation characterizing local tumor metabolism was able to differentiate the response if these parameters were taken as indices because they showed great correlation with regional response to CRT.
We demonstrated that histogram and texture analysis methods on baseline 18F-FDG PET scans have showed more robust, discriminative in assessing response to combined CRT and may have a good application prospect in clinical practice.
18F-FDG PET, Lung cancer, Gray level distribution, Co-occurrence matrix, Texture analysis, Assessing approaches
Lung cancer has become one of the leading causes of cancer death in men and women and is responsible for millions deaths annually in the worldwide. Cancer may be seen on the whole body Positron Emission Tomography (PET) image. PET is more sensitive and easier to identify lesion than other medical imaging technology in oncology. Especially the whole body PET imaging which is accurate, sensitive, comprehensive, and apparent in reflecting the severity of the disease can detect distant metastasis. PET is now a widely used tool in the field of oncology such as diagnosis, and more recently radiotherapy planning or response to therapy and patients' follow-up studies [1]. Our results suggest that F-18 FDG PET/CT can be used as a reliable and noninvasive method for the differentiation of malignant and benign pleural disease in patients with NSCLC [2]. In the future, PET/CT might achieve an important role for staging lymph nodes or distant metastases as well as tumor recurrence [3].
[18F] Fluoro-2-Deoxy-2-Dglucose (18F-FDG), a glucose metabolism analog used as the PET tracer has been frequently applied in clinical practice for tumor detection, staging, and radiotherapy target definition of different cancer sites [4]. FDG-PET showed moderate sensitivity and specificity for the detection of locoregional metastases, and reasonable sensitivity and specificity in detection of distant lymphatic and hematogenous metastases [5]. There is enough evidence showing that FDG uptake value could be used as an important index to measure cancer therapy effect [6]. In the last 5 y, PET/CT has also gained widespread acceptance as a key tool used to demonstrate early response to intervention and therapy [7]. In this paper we mainly concentrate on assessing the response to CRT in lung cancer. A visual pattern analysis technique was applied in Hicks, et al. [8] for grading tumor response and normal tissue toxicity in patients with Non-Small Cell Lung Cancer (NSCLC) (Figure 1A and Figure 1B). Several studies also have evaluated the role of PET in predicting treatment response based on 18F-FDG uptake changes between a pre- and a post-treatment PET scan obtained during or after treatment completion [9,10]. If accurately assessing is conducted we can firmly determine that the therapy program is effective or the program is not suitable for the patient's treatment. However, the single Standardized Uptake Value (SUV) measurement change in pre-therapy and treatment completion PET scans is potentially impacted by the initial FDG uptake kinetics and radiotracer distribution, which are dependent on the initial dose and elapsing time between injection and image acquisition [11-13]. Alternatively, there have been some efforts in the literature directing towards utilizing variations in the FDG distribution, characterized by its heterogeneous shape and texture [14].
The treatment for all patients was applied according reasonable combined CRT plan of clinical. In this study we proposed improved approaches for assessing response to tumor treatment in the lung cancer. The objective of this study is to utilize the comprehensive parameters' variation that we extracted from PET scans to evaluate these methods in assessing response to treatment in lung cancer.
We analyzed twelve patients diagnosed Non-Small Cell Lung Cancer treated with combined CRT between 2008 and 2011. The mean age at the time of diagnosis was 495 y (median, 48 y; range, 32-72 y), and 7 of patients were male. All patients with diagnosed NSCLC underwent pretreatment and 1 month after treatment completion 18F-FDG PET scan. Patients were instructed to fast for a minimum of 6 h before the injection of 18F-FDG and kept quiet during the time. The dose of administered 18F-FDG was 5.55-7.40 M Bp/kg and the blood glucose concentration was below 7.0 m mol/L. The PET scans were finished on PET/CT (Discovery LS type, produced by GE) and cyclotron (Minitrace type, also produced by GE). In addition to the PET scan a low-dose CT scan was acquired for attenuation-correction purpose. Another purpose using of CT is that we combine the advantages of CT in accurately locating lesions and showing lesions' structure changes with PET apparently detecting lesions and showing metabolic characteristics. Following the above steps we got pretreatment and treatment completion PET and PET/CT scans (Figure 2).
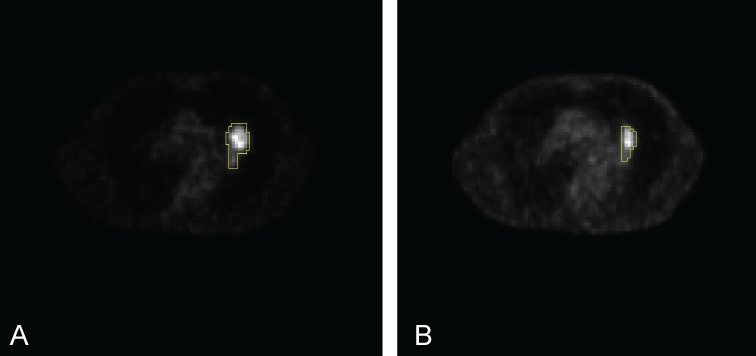 Figure 1: PET scans for a selective NSCLC patient. The clinical tumor volume were outlined by yellow line, respectively, scan A) for pretreatment and B) for one month after treatment completion. Note the tumor volume shrinked after CRT treatment comparing A and B.
View Figure 1
Figure 1: PET scans for a selective NSCLC patient. The clinical tumor volume were outlined by yellow line, respectively, scan A) for pretreatment and B) for one month after treatment completion. Note the tumor volume shrinked after CRT treatment comparing A and B.
View Figure 1
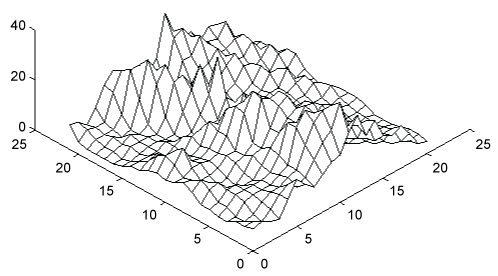 Figure 2: Surface plots for a case of NSCLC. The illustration of the texture by showing a sampled rectangle surface of NSCLC region. The texture i.e. the arrangement of pixels with different gray value which was presented by the height with the range from 0 to 32 and the region size is 25 × 25 (pixels) was shown in this figure. Note the gray value distribution in space characterized the texture. View Figure 2
PET/CT results were interpreted by experienced nuclear medicine physicians and radiologists. These specialists gave an consistent determined evaluation for the response to treatment. According to Response Evaluation Criteria in Solid Tumors (RECIST version 1.1), we applied a response degree under three headings to categorize different response results as follows: 0 no response, 1 partial response, 2 apparent local control. We also computed the tumor shrinkage measured by pixels.
At present, methods for tumor contouring on 18F-FDG PET include fixed threshold (SUV ≥ 2.5), 36-44% SUVmax, calculating on formula, algorithm defining threshold, recognized by eyes and manual segmentation. Accumulating studies have compared the advantages of different tumor contouring methods in their separate applicable conditions with each other [15]. We use the method eyes recognizing and manually contouring by experienced nuclear medicine physician also refer to other methods which are recognized and applied in clinical practice. The PET tumor segmentation followed was manually segmented by experienced nuclear medicine physician in oncology combing CT in locating.
In clinical PET scans were transferred using the Digital Imaging and Communication in Medicine (DICOM) protocol into the research treatment planning system-Computational Environment for Radiotherapy Research (CERR).
Gray values were re-quantified to yield a finite range using the following equation [16]:
Where, 2k represents the number of discrete value. I represent the gray value of the original images in ROI. K determines the range of the quantization. The function Round results the nearest positive integer of the expression in the bracket. Re-quantified gray value is relative value with the strengthening anti-noise-interference capability. The quantifying method normalizes the gray value across patients, PET scan equipments and even possessing the same former conditions but only in different scan time.
The typical role of the gray value histogram is to compare the changes of gray value distribution in ROI between pretreatment and 1 month after treatment completion. The histogram methods enable several indices to be extracted from PET functional images for outcome analysis such as maximum and ratio changes in certain gray value level.
Texture characteristic is defined as pixels with different gray values arrangement in spatial allowing the extraction of complex image properties. We extract texture parameters using Gray Level Co-occurrence Matrix (GLCM) [17,18], which is a classical algorithm in texture analysis. The following Several different texture parameters were computed. Angular Second Moment (ASM), Contrast (CON) Correlation (CORR), Entropy (ENT), Inverse Differential Moment (IDM) are calculated using GLCM. Parameters are calculated using the following equation11/28/2017s:
Where P is a co-occurrence matrix, i,j are the row and column index and P(i,j) is an element of the matrix. As is shown in Figure 3, the surface of the tumor region where the height is the gray value the figure show the gray value distribution and the gray value is a function of space location.
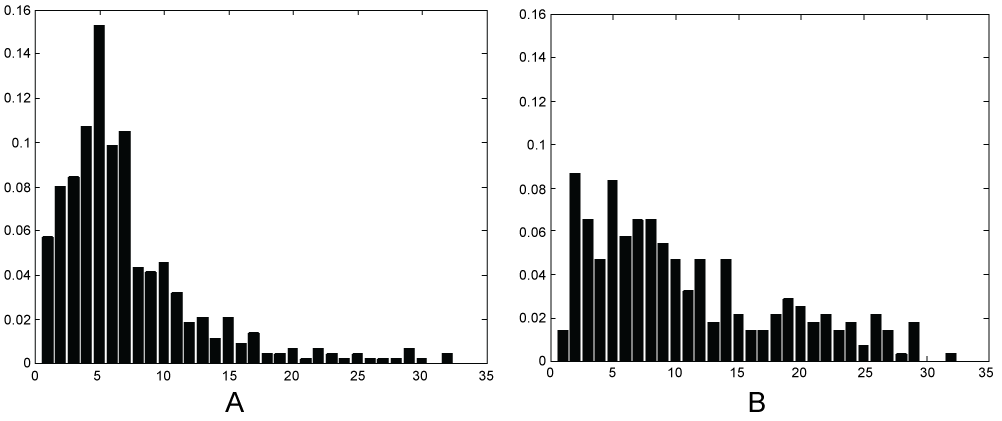 Figure 3: Normalized PET scan gray value distribution histogram. The height presented the proportion of pixels in each gray level. (a) for pre-treatment and (b) for one month after treatment completion. Note the proportion on whole becomes smooth after CRT treatment comparing (a) and (b). View Figure 3
The Statistical Package for Social Sciences, version 19.0 (SPSS 19.) was used for statistical analysis. The Spearman's rank correlation analysis was performed to assess the relationship between groups.
We computed tumor size change between pretreatment and treatment completion. The mean area decrease of tumor region was 101 pixels (maximum: 150, from 424 reduced to 274; minimum: 13, from 133 reduced to 120).
As a demonstrative example, we analyzed one of the patients' gray level distribution histogram to show the method.
After treatment we could apparently find that the ratio of gray value distribution on the whole becomes uniform in Figure 3. Ratio of gray value distribution in every level among the range of level 11~32 in Figure 3(b) has an obvious increase comparing Figure 3(a) and has almost more than one time increase in level 18~32. Then we divided the 32 discrete gray level intervals into three parts as follows: The lower (level 1-10), the middle (level 11-22) and the higher (level 23-32). The percentage of each part ratio variation between pretreatment and treatment completion were the lower part (pro: 62.9%-pre: 84.7%) -21.8%, the middle part (28.9%-11%) -17.9% and higher part (8.2%-4.3%) -3.9% for the example patient. The variations of the three parts in general show the uniform degree change. After statistical analysis among all patients we found that Spearman's rank correlation (rs) between the middle part ratios' variation which is most reprehensive for uniformity and tumor shrinkage was 0.4078. The degree of uniformity correlates well with the tumor shrinkage and which inherently reflects response to combined CRT. We also found the uniformity was consistent with the response degree. The maximum is obvious in every histogram and we found the maximum ratio decrease as shown in the following equation (15.5%-8.7% = 6.8%) and the tumor size reduced for this patient is 35.37%. For all the patients the maximum ratio reduced range (2.86%-14.68%) is associated with tumor shrinkage ratio range (31.24%-53.68%) and the correlation coefficient between the two rs value is 0.3267. We found percentage for the maximum ratio decrease correlated well with response degree.
Texture indices were extracted from the same patient's pretreatment and treatment completion PET scans. Choose 1 pixel as the distance of GLCM in four different directions and calculate the average of each parameter at the end. The subsequent reported results were obtained using 32 discrete re-quantification intervals.
As demonstrative example, we also analyzed one patients' texture characteristic parameters ratio variation. As shown in table 1 the left part of the table is texture parameters of pretreatment and corresponding normal region before treatment (Ratio = (Pre-Normal)/Normal*100%) and the right part is 1 month after treatment completion and corresponding normal region (Ratio = (Com-Normal)/Normal*100%).
Table 1: Percentage variation for texture parameters. View Table 1
Normal region's texture parameters between pretreatment and treatment completion were not equal for all the patients. In normal region texture parameters ASM, CORR and IDM after treatment completion is larger than pretreatment and ENT, CON is smaller compared with pretreatment. In order to eliminate the tumor size change for texture characteristics calculation. We analyzed ratio variation as follows: ASM and CORR have a apparent variation, and ENT have a small varation for the example patient. The variation of ratio is ASM: 7.127%-55.77% = -48.64%, ENT: 10.77%, CORR: -29.30%, CON: 27.33%, IDM: -16.34% for the above patient between pretreatment and treatment completion. Reviewing all patients for every texture parameter we investigated whether the ratio variation consistent with tumor shrinkage and response degree or response assessed by other methods. Ratio variation trend for each patient is consistent with tumor change measured by size reduced or other methods. However, only ASM, ENT and IDM were the measurement showed statistically significant differentiation with regard to the twelve patients' response to CRT in this study. The ratios calculated in Table 1 were pretreatment and treatment completion to their separate corresponding normal texture parameters.
In this study we investigated the value of two distinct methods: G11/28/2017ray level distribution histogram and texture parameters in assessing response to NSCLC CRT. These methods may ameliorate the shortcomings of relying on visual inspection or sole SUV in assessing treatment.
We analyzed the tumor response to treatment by measuring tumor anatomic size reduced and response categoried by experienced specialists. These methods are classical and already widely used in the clinical practice. Firstly We analyzed the ratio changes of gray value distribution in each level or on the whole through histogram and the histogram inherently reflects the distribution of SUV. In this study the interval gray level was distributed in 32 degree and we further categoried the interval into three parts. On the whole, we discovered that the percentage sum of ratios lying in the lower gray level part and the middle part accounts for the majority from the gray level distribution histogram and the two parts showed an obvious variation after treatment completion. Particularly the middle part reflecting the degree of uniformity about gray level distribution and may indicated its sensitivity about response to therapy. The phenomenon to some extent indicates that area with lower and middle gray level vule is more sensitive to CRT. Studies showed maximum SUV can be used as a significant index for assessing and predicting response to tumor treatment [19,20]. In this study we found that the maximum ratio decrease in histogram for all patients was potential indices for response assessing. The maximum ratio decrease was well associated with tumor size change or response degree.
In the re-quantified process the minimum gray value was likely located in the tumor edge and normal tissue was inevitable involved in the tumor delineation. So reasonable delineation techniques is essential for this method. Hautzel, et al. has shown that even low irradiation may enhance tumor uptake and yield inaccurate information, so the SUV has limitation. In this study gray value after re-quantification was relative, not impacted by radiotherapy and other image noises. So the ratio distribution of gray level measured by histogram is more robust and accurate than SUV.
Increased FDG uptake in normal tissues (radio-toxicity) was associated with a greater likelihood of complete or partial tumor response on both PET (p = 0.0044) and computed tomography (p = 0.029) [21]. Prognostic stratification provided by PET response was both significant and of a similar magnitude in patients with low- and high-grade radio-toxicity [21,22]. Metabolic changes often occur before morphologic changes, metabolic image appear to be valuable tool in response assessment. In this study we discover that the texture characteristic parameters extracted from both the right and the left side lung in corresponding region with the same size are almost equal for the same healthy volunteer in PET image. Under this premise, we computed the texture parameter ratios of lung tissue region with lesion to normal region and showed its significant for assessing NSCLC response to CRT. For the difference of normal region texture parameter between pretreatment and 1 month after treatment completion for all patients were due to tumor size, delineation and CRT. So tumor segmentation and the breathing in the PET scanning are the main factors for histogram analysis algorithm and texture indices analysis. In that case, we computed and analyzed the ratio change of all parameters. We can discover that the trend of parameter ratios change correlated with tumor size reduced and response degree. The ASM, ENT and IDM showed statistically significant difference in response assessing.
A single feature can't be directly linked to a specific biologic progress. However, the combination of local texture parameters with features extracted from global histogram are more reliable to indicate physiologic progress related to response to combined CRT. The limitation of this study is that it is retrospective, considering a relatively small patient cohort. A prospective study based on a large patient cohort need to be validated.
We have demonstrated that histogram and texture analysis methods on baseline 18F-FDG PET may have potential power in assessing response to combined radio and chemotherapy and have a good application prospect in clinical practice. These approaches offered more detailed, comprehensive, robust and anti-noise-interference indices in treatment assessing and predicting. Finally, this research is limited in lung cancer only, but these approaches are important and we can try applying them in other tumor types.
This work was supported by Projects of Medical and Health Technology Development Program of Shandong Province (2016WS0553) and Project funded by China Postdoctoral Science Foundation(2017M610430, 201601006, 2017M612283).
There were no conflicts of interest.