The purpose of the study is to determine the level of iron, its role in oxidative damage and to profile and measure the level of transcript expression of genes responsible for iron homeostasis in lenses of human cataracts.
Human whole lenses (WLs) were obtained from donors' eyes (n = 33) within 8 hours of death. A total of 167 (control, n = 35 and cataract, n = 132) anterior central capsules (ACC) harboring lens epithelial cells (LECs) and lens aspirate containing LECs, primary and secondary lens fiber cells (LFCs) were collected postoperatively. Control samples were obtained mainly from patients suffered from lenticular trauma or subjected for myopic corrections. Lenticular total iron was determined by Atomic Absorption Spectrophotometer (AAS). Comet assay using lens epithelial cells was performed to determine the oxidative DNA damages. Quantitative real-time polymerase chain reaction (qRT-PCR) was performed to profile and determine the level of transcript expression of genes of iron homeostasis in lenses. An in vitro culture model using fetal human lens epithelial cell line (FHL124) was used to validate the effect of iron on oxidative DNA damage and expression of iron homeostasis genes.
Cortical cataract (CC) had significantly higher levels of iron (58.89 ± 20.56 µg/g dry tissue weight, p = 0.00) than control lenses (17.82 ± 5.29 µg/g dry tissue weight) and revealed a significant increase in tail length (µ) (79.59 ± 21.31 vs. control, 66.56 ± 15.68; p = 0.005) and olive moment (29.69 ± 10.31 vs. control, 26.97 ± 8.12, p = 0.018) by Comet assay in LECs. Fetal human lens epithelial cell line (FHL124) treated with 500 μM (concentration equivalent to lenticular iron level in CC) of ferric chloride (FeCl3 ), revealed a significant increase in tail length (µ) (80.71 ± 8.63 vs. control, 62.55 ± 6.63; p = 0.01), tail DNA (%) (44.01 ± 18.02 vs. control 27.39 ± 5.14; p = 0.05), tail moment (36.87 ± 17.33 vs. control, 18.1 ± 3.41; p = 0.02) and olive moment (27.41 ± 6.72 vs. control, 18.88 ± 2.86; p = 0.02) suggestive of substantial DNA damage. QRT-PCR analysis displayed elevated level of iron responsive element (IRE) containing DMT1 (IRE-DMT1, 1.99 ± 0.34 fold change to control, p = 0.046) and diminished level of FTH (0.13 ± 0.02-fold change to control; p = 0.01) in lenses of CC. However, in vitro model, though displayed a conflicting data as compare to human samples, exhibited a conventional coordinated regulation of iron within the system.
In conclusion, differential transcript expression of genes responsible for iron uptake (IRE-DMT1) and storage (FTH) might lead to an increase in iron over-load in human lenses. Iron-over load could potentially accelerate the cascade of mechanisms leading to oxidative damage, as evident by increased level of DNA damage in cortical cataract and also in FHL124 cells treated with FeCl3.
Lens, Iron, DNA damage, COMET Assay, Iron regulatory genes, Cortical cataract, Nuclear cataract, Subcapsular cataract
The lens of the human eye is highly vulnerable to oxidative damage although it is well-protected from direct oxygen supply [1]. Due to excessive oxidative stress, the lens undergoes several molecular changes including proteins [2], membranes [3], and deoxyribonucleic acid (DNA) [4] culminating in opacification or loss of transparency [5-9]. The opacification that occurs in any part of or in an entire lens, termed as cataract, obscures the passage of light through the lens [10]. Today this painless loss of vision is one of the leading causes of treatable blindness in the world [11]. Although treatable, cataract brings an enormous socio-economic burden for developed as well as developing countries. There are about 35.1 million cases of bilateral cataract reported worldwide with approximately 50% of the cases originating in Africa and Asia [12,13]. Surgical intervention is the only available treatment at present.
Iron is indispensable for life. Most organisms require iron to act as a metal cofactor for many enzymes and proteins involved in central cellular processes such as mitochondrial oxidation, respiration, DNA synthesis, oxygen transport and nitrogen fixation [14,15]. Maintenance of cellular iron homeostasis is accomplished by the coordinated regulation of iron uptake (DMT1, TFR1/2), storage (FTH, FTL), export (FPN) and regulatory (IRP1, IRP2, FBXL5) proteins. In enterocytes, dietary non-heme ferric ion is reduced by membrane bound ferrireductases and absorbed by the divalent metal transporter 1 (DMT1). The absorbed iron is then exported to blood circulation by the baso-lateral exporter, ferroportin (FPN) upon oxidation by membrane-bound multicopper oxidase hephaestin enabling it to bind to plasma transferrin (Tf) to form di-ferric Tf (Tf-Fe (III)). Diferric Tf is the major form of iron that binds to the cell surface transferrin receptors 1/2 (TFR1/2) [16] of most of the cells followed by internalization of the Tf-Fe (III)-TFR1/2 complex by clathrin-mediated endocytosis. On acidification of the endosome, ferric iron is released from Tf, reduced by metalloreductase, and exported into the cytosol by DMT1. In the cytosol, the free iron is utilized for diverse physiological processes and the excess is bound to ferritin heavy (FTH) or light chains (FTL). However, the fate and cellular homeostasis of iron is determined by iron regulatory proteins 1 and 2 (IRP1 and IRP2) [17]. Iron regulatory proteins are cytosolic proteins that regulate the post-transcriptional expression of several iron homeostasis gene encoding proteins involved in iron uptake, sequestration, and export, upon binding to their iron-responsive elements (IREs) within the 5' or 3' un-translated regions (UTRs). The storage and export of iron in and out of cells are accomplished by the coordinated regulation of IRP1 and IRP2 proteins [17]. In the iron deficient condition, IRPs bind to 5' IREs in FTH/FTL and FPN mRNAs with high affinity to repress translation, and to 3' IREs in DMT1 and TFR1/2 mRNAs to block its degradation. However, when cellular iron is in excess, IRPs do not bind to IREs, promote synthesis of FTH/FTL and FPN, and assist the degradation of DMT1 and TFR1/2 mRNA. Further, IRPs lose their RNA binding capacity either through conformational changes resulting from the enhanced Fe-S cluster assembly within IRP1 or enhanced proteasomal degradation of IRP2. Selective degradation of IRP2 is preceded by its iron-dependent polyubiquitination via a Skp1/Cul1/Rbx1 (SCF) E3 ubiquitin ligase complex containing FBXL5 [18-21]. FBXL5 exhibits iron-sensing properties, as it is stabilized in the presence of iron and oxygen by forming a Fe-O-Fe center within its N-terminal hemerythrin-like domain. Loss of this center in iron-starved and/or hypoxic cells exposes a degron via a conformational change [22,23]. This allows proteasomal degradation of FBXL5, which leads to concomitant accumulation of IRP2. Thus, the coordinated regulation of iron by IRPs ensures that cells acquire adequate iron for their needs without reaching toxic levels [17,18]. Despite its inevitable role in many biologically important processes, iron invokes considerable oxidative stress and promotes deleterious irreversible damage to the cells when the coordinated regulation of iron homeostasis is perturbed [24]. Iron undergoes Fenton reaction, in which the ferrous form of it (Fe2+) is oxidized into its ferric form (Fe3+) by hydrogen peroxide (H2O2) and generates a hydroxyl ion (OH-) and the dangerous hydroxyl radical (OH). The OH is very reactive and can cause oxidative damage to DNA, proteins and lipids. In fact, the Fe2+ is absorbed into the body from the diet and is not entirely excreted except through menstruation, shedding of dead skin cells, and bleeding due to trauma. Therefore, the total tissue iron levels build up with age [25]. High iron stores and deviations from its normal physiological concentration were noticed in diseases such as cardiomyopathy, liver cirrhosis, diabetes mellitus, neurodegeneration, and cancer [26-28]. Lens siderosis, a clinical condition characterized by deposition of iron molecules in lens tissue usually caused by retention of an iron-containing intraocular foreign body, has also been reported to cause cataract [29-33]. Iron-induced oxidative damage was also reported in eye diseases [34,35] including cataract [36], age-related macular degeneration [37], diabetic retinopathy [38], vitreoretinal diseases [39], optic neuritis, optic neuropathy, glaucoma, and retinal degeneration [25]. However, reports associating lenticular iron-overload with the regulation of iron homeostasis and oxidative DNA damage in cataract development are scanty.
Hence, the present study was designed to address the association of iron in oxidative DNA damage in cataract development and to provide insights into the expression of transcripts of genes responsible for iron homeostasis. The quantity of lenticular total iron, level of transcript expression of iron homeostasis genes (DMT1, FBXL5, FPN, FTH, FTL, IRP1, IRP2 and TFR2), and degree of DNA damage upon iron supplementation were analyzed to establish an association of iron with cataractogenesis using human cataract lenses as well as an in vitro FHL124 cell line models.
The study adhered to the tenets of the Declaration of Helsinki for research involving human tissues and was approved by the ICIRC-Institutional Ethics Committee (IEC/ICIRC/2012-V15). A written informed consent was obtained from the patients (> 40 years of age). The type of cataract was examined preoperatively using slit-lamp biomicroscopy (Carl Zeiss, Oberkochen, Germany) by a trained ophthalmologist. The modified lens opacification classification system III (LOCS III) [40] was used to determine the type and grade of cataract. Lenses with grade 3 opacification for all cataract types (nuclear, cortical and posterior subcapsular) were only included in the study. Patients with a history of glaucoma, retinitis pigmentosa, diabetes, retinal detachment, uveitis, vitreous hemorrhage, steroid medication, and any ocular surgery were excluded from the study.
Human whole lenses (WLs) were obtained from donors' eyes (n = 33) within 8 hours of death from Red Cross Society (Ahmedabad, Gujarat, India). Lenses were dissected from the enucleated eye, transferred to the sterile phosphate buffered saline (PBS), pH 7.4, and examined under an operating microscope (Carl Zeiss, Oberkochen, Germany) to detect the presence of any opacity. Lenses without any form of opacity (clear) were used as controls (n = 5), and lenses exhibiting opacity (n = 28) in any portion were classified accordingly as cortical cataract (CC, n = 12), nuclear cataract (NC, n = 11) and subcapsular cataract (SC, n = 5). The WLs were maintained as it is for iron determination and stored at -80 ℃ until further use.
A total of 167 (control, n = 35 and cataract, n = 132) anterior central capsules (ACC) harboring lens epithelial cells (LECs) and lens aspirate containing LECs, primary and secondary lens fiber cells (LFCs) were collected postoperatively from Raghudeep Eye Hospital, Ahmedabad, Gujarat, India. Control samples were obtained mainly from patients suffered from lenticular trauma or subjected for myopic corrections. Through a clear corneal incision (3 mm in length), a continuous curvilinear capsulorhexis (CCC) procedure was performed under local anesthesia (2% xylocaine) and the ACC of 3-5 mm in diameter was removed with viscoexpression. The ACC harboring LECs were collected using forceps to avoid direct damage to the LECs and were either transferred to PBS for comet assay (control, n = 10; cataract, n = 26), or added to corresponding lens aspirates (control, n = 25; cataract, n = 106). Lens aspirate containing LECs and LFCs was transferred to sterile conical centrifugal tubes (BD Biosciences, MD, USA) and centrifuged at 3000 g for 10 min at 4 ℃. The supernatant was decanted, and the pellet was washed twice with PBS and added with 1 ml of TriZol reagent for RNA isolation and stored at -20 ℃ until use.
The level of iron in lenses was determined by the previously described method [41]. Briefly, lenses were collected in acid-washed amber glass vials and dried under reduced pressure at 37 ℃ in a hot air oven for the first one hour followed by drying overnight at 60 ℃ for approximately 16 hours. The dry weight of each lens was measured, digested in a mix of 5 ml of nitric acid: perchloric acid (3:1) in a closed chamber until the solid particle was no longer visible. The digested contents were pre-heated at 100 ℃ in a microwave oven for an hour and then at 200 ℃ till the acid contents became colorless and reduced to 2-3 ml. Then the content was allowed to cool, mixed with the required volume of distilled water, filtered through a Whatman No. 42 filter paper, and made up to 50 ml with HPLC grade distilled water. The quantity of total iron was determined using Spectra AA220 Zeeman flame atomic absorption spectrophotometer (Varian Australia Pty Ltd., Mulgrave, Australia) and expressed as micrograms per gram tissue dry weight.
Fetal Human Lens Epithelial cell line (FHL124) generated from human capsule-epithelial explants [42] was a kind gift from Prof. John Reddan. The human origin of it was authenticated using short tandem repeat (STR) profiling and reported in our previous study [43]. FHL124 cells exhibited 99.5% homology with native human LECs. Further, it was found to show expression of LEC specific and phenotypic markers such as FoxE3, alpha-A-crystallin and pax6 [44]. FHL124 cells from the 15th passage was grown in 1.5 ml of Eagle's minimal essential media (MEM) (Sigma, St.Louis, USA) with 10% fetal bovine serum (FBS) (HiMedia, Mumbai, India) in a six-well plate with an initial seeding of 75 × 103 cells/well. Cells were maintained at 35 ℃ and 5% CO2 until confluence, and then they were serum starved for 24 hours. Cells were divided into two groups: control group and treatment group. In the treatment group, the growth medium was supplemented with 150, 250 and 500 μM (i.e. 25, 50 and 75 μg per ml, respectively) of FeCl3 (Sigma-Aldrich, Bangalore, India). Treatment was continued for 24 hours, and the morphology as well as growth rate of cells were observed. Cells were harvested in 1.5 ml of cold PBS after three washes followed by centrifugation at 2000 g for 30 min at 4 ℃. The cells were collected in 1 ml of PBS and 200 µl of TriZol reagent (Invitrogen Inc, CA, USA) respectively for Comet assay and RNA extraction.
Total RNA was isolated using Trizol reagent as per the manufacturer's instructions with little modification. Samples were homogenized using a motor driven tissue grinder (Genetix Biotech Asia Pvt Ltd, New Delhi, India) fitted with a sterile RNAse free disposable micro-pestle (Himedia, Mumbai, India). The homogenate was incubated at room temperature for 5 minutes, added to 1/5 volume of chloroform, vortexed for 30 seconds, and then kept on ice (4 ℃) for 10 minutes. The upper aqueous phase was separated by centrifugation (BioFuge, Heraeus, Germany) at 14,000 g for 15 minutes. The total RNA was pelleted by the addition of equal volume of cold isopropanol and subsequent centrifugation at 14,000 g for 15 minutes. The RNA pellet was washed using 75% ethanol, centrifuged at 8000 g for 10 minutes, and the air-dried pellet was dissolved in 30 μl of diethyl pyrocarbonate (DEPC) (Sigma-Aldrich, Bangalore, India) treated water. The quantity of total RNA was determined by obtaining optical density at 260 nm and its purity was assessed by estimating the ratio of absorbance at 260/280 nm using a UV-Vis Spectrophotometer (Lambda 25, Perkin-Elmer, USA). First strand cDNA synthesis was carried out in a 20 μl reaction volume containing 1 μg Oligo dT(18) (New England Biolabs, Hitchin, UK), 0.5 μg Random Hexamer (N6) (New England Biolabs, Hitchin, UK), 1 mM dNTPs, (Thermo Fisher Scientific Inc., Waltham, MA, USA), 40U human placental RNase inhibitor (New England Biolabs, Hitchin, UK), and 200U M-MuLV Reverse transcriptase (New England Biolabs, Hitchin, UK) in 1X RT reaction buffer (7.5 mM KCl, 0.3 mM MgCl2, 0.1 mM DTT) for every 1 μg of total RNA. The primers were allowed to anneal with RNA at 70 ℃/5 minutes and the contents were cooled immediately on ice. The reverse transcription step was carried out at 25 ℃/5 minutes, followed by 42 ℃/60 minutes, and 70 ℃/15 minutes. All the thermal steps were performed in a thermal cycler, DICE TP600, (Takara, Shiga, Japan). The synthesized cDNA samples were stored at -20 ℃.
Quantitative real-time PCR was carried out in a 20 μl reaction volume containing 10 μl 2X QRT SYBR mix I (Takara, Shiga, Japan), 10 ng cDNA, and 10 pM each of forward and reverse primers. Amplification was performed in a LightCycler 480II (Roche Diagnostics GmbH, Mannheim, Germany) with the following thermal cycles; one cycle of pre-incubation at 95 ℃ for 1 min, followed by 50 cycles of amplification at 95 ℃/10 sec, 50-60 ℃/10 sec, and 72 ℃/10 sec. A melting curve program was also performed to confirm the specificity of the products, and agarose gel electrophoresis was performed to verify the presence and size of the amplicons. For normalization of level of target gene expression (non-IRE and IRE form of DMT1, FBXL5, FPN, FTH, FTL, IRP1, IRP2 and TFR2), cumulative mean Cp value of four housekeeping genes (ACTB, GAPDH, 18SrRNA and 28SrRNA) were used as reference. The fold change in expression of each target genes was determined utilizing efficiency corrected calculation models by the formula; ratio = (Etarget)ΔCp target (control- sample)/ (Eref) ΔCp ref(control-sample) [45]. Primer sequences, annealing temperatures and the size of the amplicons for all the target and house-keeping genes are given in Table 1.
Table 1: List of qRT-PCR and sequencing primers of target and reference genes. View Table 1
COMET assay was performed to evaluate the DNA damage by adopting the method proposed elsewhere [46] with slight modifications [47]. Before preparation for the comet assay, LEC viability was checked using the tryphan blue exclusion test [48]. Cell suspension of the LECs was prepared using mechanical tapping of ACC-LECs (in 50 μl of PBS), by mild vortexing, for 20 min at 4 ℃ to shed LECs from the lens capsule. After this, the capsule was checked for the presence of adherent cells by PureBlu Hoechst 33342 nuclear staining dye as per the manufacturer's instruction (Bio-Rad, USA). Cell suspension of FHL124 cell lines was prepared by harvesting and washing thrice with PBS and suspended in 50 µl of PBS. All precautions were taken to protect the cells from photo-oxidative damage.
Pre-coated slides were prepared as described elsewhere [46,49]. The LECs or FHL124 cell suspension was mixed with 75 μl of 0.5% low melting point agarose prepared in 1X PBS was and layered onto the pre-coated slides and allowed to solidify at 4 ℃ for 1 minute. Slides were incubated in lysis solution (1.25 mM NaCl, 0.01% N-lauroyl sarcosine, 50 mM EDTA, 100 mM Tris, pH 10) for 1 hour at 4 ℃ to lyse the cells, and then incubated in electrophoresis buffer (300 mM NaOH, 1 mM EDTA, 0.2% DMSO, 0.01% hydroxyquinoline) for 20 minutes to unwind the strands prior to the run. Electrophoresis was carried out at 12V/150 mA for 20 minutes, slides were washed thrice with 0.4 M Tris buffer, stained with 50 μl staining solution (0.25 μM Yo-Pro, 5% DMSO and 5% Sucrose) and examined using a fluorescent microscope (Carl Zeiss, Oberkochen, Germany) under 40X objective with blue light excitation. Individual comet images were captured with a cool charge-coupled device (CCD) camera attached to a microscope. About 50 cells or comets were scored for each sample. The degree of DNA damage was assessed with OpenComet software using various parameters such as tail length, percentage of DNA in the tail, tail moment, Olive moment, etc. [50]. Olive tail moment is defined as the product of the tail length and the fraction of total DNA in the tail and the formula to calculate olive tail moment = (Tail.mean - Head.mean) X Tail%DNA/100. Tail moment incorporates a measure of both the smallest detectable size of migrating DNA (reflected in the comet tail length) and the number of relaxed/broken pieces (represented by the intensity of DNA in the tail) and the formula to calculate extent tail moment = tail length X Tail%DNA/100. Values of all parameters were expressed as mean ± S.E. of median.
The level of iron in lenses was expressed as mean ± SD microgram per gram tissue dry weight, the level of gene expression as mean ± S.E. fold change to control, and the level of DNA damage as mean of medians ± S.E. (micron (μ), percentage (%), and arbitrary units) for all parameters. The student t-test was used to analyze the level of significance between the two groups. A one-way ANOVA test was used to compare the levels of significance between more than two groups. A p-value of less than 0.05 was considered significant.
Source of samples, details of subjects, age, gender distribution, and different types of cataracts were described in Table 2. There was no difference in mean age between controls and cases of donors, while there was a significant difference in mean age of subjects with nuclear (p = 0.01) and posterior subcapsular cataract (p = 0.02) compared to control subjects in patients.
Table 2: Demographic details of subjects recruited for the study. View Table 2
The level of total iron was determined in whole lenses of control and different types of cataract using atomic absorption spectrophotometry (Figure 1 and Table 3). Lenses with cataract showed a higher level of total iron as compared to clear lenses. Among lenses with different types of cataract, cortical cataracts (CC) exhibited the highest level of iron content (58.9 ± 20.6, p = 0.001), almost 4 times that of control lenses (17.8 ± 5.3). Although nuclear (NC) (39.4 ± 27.06, p = 0.10) and subcapsular (SC) (26.1 ± 10.3, p = 0.15) cataracts showed higher levels of iron but were not statistically significant.
Table 3: Determination of Lenticular Iron. View Table 3
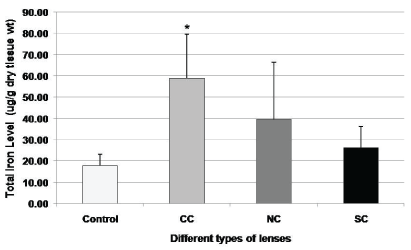 Figure 1: Determination of level of iron in different types of cataracts.
Level of iron was determined by atomic absorption spectrophotometry (AAS) in different types of lenses obtained from cadaveric human donor eye; Control, (n = 5), CC: cortical cataract, (n = 12), NC: nuclear cataract, (n = 11), and SC: subcapsular cataract, (n = 5)). Values are expressed as mean ± S.D. and *indicates p < 0.001 (Student's t-test).
View Figure 1
The Comet assay (Figure 2A) was performed to find the level of DNA damage in LECs of different types of cataract (Figure 2B and Table 4) and also in FHL124 cells treated with different concentrations of FeCl3 (Figure 2C and Table 5). The degree of DNA damage was assessed by four essential parameters such as tail length (u), the percentage of DNA present in the tail, tail moment and Olive moment (Figure 2A). The results showed a significant increase in tail length (79.59 ± 21.31 vs. control, 66.56 ± 15.68; p = 0.0005), olive moment (29.69 ± 10.31 vs. control, 26.97 ± 8.12, p = 0.018), and an insignificant, increase in tail-moment (43.13 ± 18.87 vs. control, 37.85 ± 15.29; p = 0.13) in CC. Nuclear cataract showed a significant decrease in tail DNA (%) (34.77 ± 10.56 vs. control, 40.03 ± 11.40; p = 0.02) and PSC did not show any significant difference in any of the parameters tested (Figure 2B and Table 4).
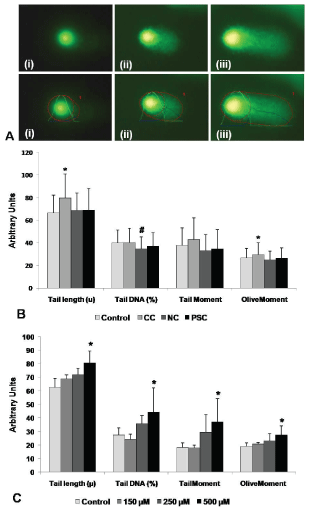 Figure 2: Assessment of DNA damage in human lens epithelial cells (LECs) and FHL124 cell lines.
A) Representative images of Comets showing different degree of DNA damage; i) no, ii) moderate and iii) higher. (B) Analysis of degree of DNA damage in lens epithelial cells of different types of lenses; Control, (n = 10), CC: cortical cataract, (n = 8), NC: nuclear cataract, (n = 11), PSC: posterior subcapsular cataract, (n = 7). (C) Analysis of degree of DNA damage in FHL124 cell lines treated with various concentrations (µM) of FeCl3. Image analyses of various parameters such as %DNA in head and tail, tail length (marked by blue line), tail moment and Olive moment was performed by Open Comet Software. Boundary mark indicates the area selected for the analyses of various parameters; red line indicates Comet length (head area, head diameter, tail area, tail length); green line indicates head DNA content in the comet; blue line indicates tail DNA content in the comet. *-indicates significant increase at p < 0.05; #-indicates significant decrease at p < 0.05.
View Figure 2
Table 4: Assessment of DNA damage in LECs. View Table 4
Table 5: Assessment of DNA damage in FHL124 cell lines challenged with FeCl3. View Table 5
To understand whether the presence of iron in lens epithelial cells plays role in DNA damage in vitro cell culture model using human fetal lens epithelial cell line (FHL124) was utilized. FHL124 cells treated with FeCl3 revealed a significant increase in tail length (p = 0.01), percentage tail DNA (p = 0.05), tail-moment (p = 0.02) and olive-moment (p = 0.02) at higher concentration (500 µM) of FeCl3, a concentration equal to that of lenticular iron level in cortical cataract (Figure 2C and Table 5).
The quantitative real-time PCR (QRT-PCR) analysis was carried out for genes responsible for iron uptake and import (i.e. DMT1 and TFR2), storage (i.e. FTH and FTL), export (i.e. FPN) and homeostasis (i.e. FBXL5, IRP1 and IRP2) in lenses. The level of transcript expression of these genes was compared between clear and different types of cataract (Figure 3 and Table 6).
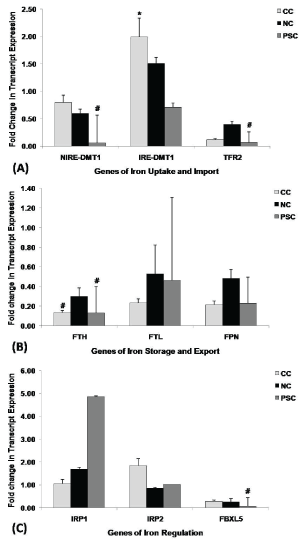 Figure 3: Transcript profiling of iron homeostasis genes in different types of lenses.
Comparison of level of transcript expression of; (A) Iron uptake and import genes, (B) Iron storage and export genes, (C) Iron regulatory genes between control (n = 25) and different types of cataract; CC: cortical cataract, (n = 34); NC: nuclear cataract, (n = 48), and PSC: posterior subcapsular cataract, (n = 25). Controls are subjects with clear lenses undergoing IOL implantation as a corrective procedure after trauma to lens by penetrative injuries or subjects with clear lenses undergoing myopic correction. Value of fold change in transcript expression is given as mean ± S.E to control. *indicates significant increase at p < 0.05; #indicates significant decrease at p < 0.05.
View Figure 3
Table 6: Expression of iron regulatory genes in lenses. View Table 6
Cortical cataract (CC) revealed a significant up-regulation of IRE-DMT1 (fold change to control, 1.99 ± 0.34; p = 0.046) (Figure 3A and Table 6) and down-regulation of FTH (fold change to control, 0.13 ± 0.02; p = 0.01) (Figure 3B and Table 6) gene transcripts. However, although statistically insignificant, it also revealed a down-regulation of FTL (fold change to control, 0.23 ± 0.04; p = 0 .06), FPN (fold change to control, 0.21 ± 0.04; p = 0.09) (Figure 3B and Table 6) and FBXL5 (fold change to control, 0.28 ± 0.05; p = 0.09) (Figure 3C and Table 6) gene transcripts.
Nuclear cataract (NC) did not show any significant changes in any of the genes tested. However, although statistically insignificant, NC exhibited an up-regulation of IRE-DMT1 (fold change to control, 1.51 ± 0.11; p = 0.058) (Figure 3A and Table 6) and down-regulation of FBXL5 (fold change to control, 0.25 ± 0.14; p = 0.07) (Figure 3C and Table 6) gene transcripts.
Posterior subcapsular cataract (PSC) showed a significant down-regulation of NIRE-DMT1 (fold change to control, 0.06 ± 0.50; p = 0.02), TFR2 (fold change to control, 0.07 ± 0.19; p = 0.02) (Figure 3A and Table 6), FTH (fold change to control, 0.23 ± 0.27; p = 0.03) and FBXL5 (fold change to control, 0.07 ± 0.37; p = 0.01) (Figure 3C and Table 6) gene transcripts.
In vitro validation on effect of challenge with iron supplementation on expression of iron regulatory genes was performed using human lens epithelial cells line (FHL124). QRT-PCR analyses of FHL124 cells challenged with FeCl3 revealed a dose-dependent increase in gene transcripts of NIRE-DMT1 (Figure 4A), FTH, FPN (Figure 4B), and FBXL5 (Figure 4C and Table 7) and a dose dependent decrease in IRE-DMT1 (Figure 4A) gene transcripts. The level of FTL gene transcript is found to be significantly up-regulated at 500 µM FeCl3 supplementation (Figure 4B and Table 7), while no significant difference in level of expression was observed with gene transcripts of TFR2, IRP1 and IRP2 (Figure 4A, Figure 4C and Table 7).
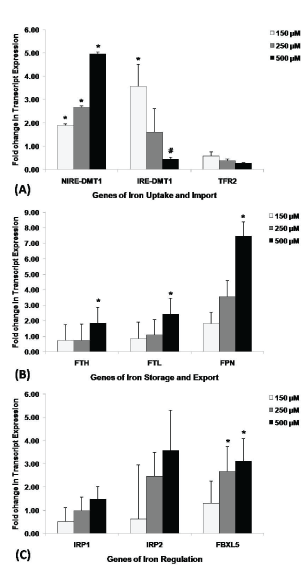 Figure 4: Transcript expression of iron homeostasis genes in FHL124 cell lines upon exogenous iron supplementation.
Comparison of level of transcript expression of; (A) Iron uptake and import genes, (B) Iron storage and export genes, (C) Iron regulatory genes between control (n = 3) and different types of treatment groups (150, 250 and 500 µM). Value of fold change in transcript expression is given as mean ± S.E to control. *indicates significant increase at p < 0.05; #indicates significant decrease at p < 0.05.
View Figure 4
Table 7: Expression of iron regulatory genes in FHL124 cells upon iron challenge. View Table 7
Oxidative stress mediated by redox-active transition elements is one of the major pathways in cataractogenesis [51, 52]. It was suggested that when a tissue's storage capacity is persistently exceeded, un-sequestered iron catalysis the formation of reactive oxygen species via Fenton reaction, which leads not only to irreversible tissue damage with clinical manifestations but also to a higher risk of age-related diseases [34,53,54]. The present study reveals an increased level of iron in cataractous lenses, especially in cortical cataracts (CC) and a plethora of studies support the current finding [52,54,55-63]. As age-related cataracts, in part, were a result of oxidative modification of lens proteins, we presume that the excess iron could be one of the factors responsible for oxidative modifications and subsequent opacification of lenses, especially in cortical cataracts.
To delineate the potential role of iron in the process of oxidative damage, we performed COMET assay for assessing oxidative stress by means of degree of DNA damage, in both human lens epithelial cells (hLECs) and cell lines (Fetal Human Lens epithelial cell line 124). The use of LECs for detecting oxidative DNA damage was applied in several studies [64-66] as epithelial cells were suggested to be better bio-matrices for analyzing Comet assay [67]. In the present study, highest level of DNA damage was observed in LECs of CC, similar to the results obtained by Sorte and co-workers [64], and at a higher concentration (500 µM) of iron supplementation in FHL124 cell lines. These observations highlight a potential role of free iron in generation of oxidative stress and subsequent oxidative damage to macromolecules in cells.
To understand the possible mechanism of iron-overload in lens tissues, we performed transcript profiling and expression status of genes responsible for iron homeostasis (i.e. DMT1, TFR2, FTH, FTL, FPN, IRP1, IRP2 and FBXL5) in human lenses. The lenses of cortical cataract exhibited an elevated level of IRE-form of DMT1 (IRE-DMT1), and a diminished level of FTH gene transcripts, while lenses of subcapsular cataracts showed a diminished level of non-IRE form of DMT1 (NIRE-DMT1), TFR2, FTH and FBXL5 gene transcripts. The uptake of iron inside the cell is mediated by two specific transporters namely divalent metal ion transporter 1 (DMT1) and transferrin receptor (TFR). DMT1 is a single transmembrane transporter and is also located in transferrin-cycle endosomes [68]. DMT1 is encoded by the gene, SLC11A2, and expressed in four major isoforms: 1A/+IRE, 1A/-IRE, 1B/+IRE, and 1B/-IRE. It was found that IRE-DMT1 is expressed predominantly by epithelial cell lines, whereas NIRE-DMT1 is expressed by blood cell lines [69]. Nevertheless, these two isoforms, IRE- and NIRE-DMT1, are known to be of physiological importance in the maintenance of cellular iron homeostasis by bringing iron into cells. A few reports are available to confirm the occurrence of TFR in lenses and other ocular tissues [70,71] and the presence of transferrin in the aqueous and vitreous humor [71,72] suggesting the existence of transferrin receptor-mediated iron-uptake in LECs [73]. However, the existence and localization, or expression of DMT1 in the lens is yet undetermined [74]. This report is the first of its kind showing the expression of both the form of DMT1 in human lens tissues. To confirm the presence of full length DMT1 gene transcripts we performed polymerase chain reaction using gene specific primers (sequences can be availed upon request) and to confirm the sequence homology we performed bidirectional Sanger's sequencing. The full length DMT1 transcript sequence has shown 100% homology to isoform 2 (i.e. NIRE DMT1) and has been submitted to GenBank (accession number KT455015). The presence of NIRE-DMT1 transcripts in lenses indicates a possible role of DMT1 in modulating iron translocation in response to cellular demands as in other tissues. Mutations in the IRE of L-ferritin (FTL) mRNA are reported to abrogate IRP binding, promote accumulation of non-functional L-ferritin homopolymers in the lens, and result in hereditary hyperferritinemia-cataract syndrome (HHCS) [75]. As the mRNA level of FTL did not change significantly in any type of cataract, the role of L-ferritins in the causation of cataract could not be established in the present study. Further none of the selected cataract cases in the present study are reported to have HHCS.
The results of an in vitro analysis indicate that when the threshold level of intracellular iron concentration is reached, the cell starts synthesizing proteins responsible for sequestration and exportation, while abrogating the synthesis of proteins responsible for iron uptake. It was reported that when the cytosolic iron concentration becomes high, IRPs abrogate the translation of DMT1 and induces the synthesis of ferritin storage proteins [76]. This pattern, at least at mRNA level, was observed in the present study when the FHL124 cells were treated with increasing concentration of iron. Therefore, it is evident from the in vitro analysis that human lens epithelial cells exhibit a conventional coordinated regulation of genes responsible for iron metabolism when they are challenged with exogenous supplementation of iron.
From the current findings, it could be hypothesized that the increased inflow of iron (owing to increased expression of DMT1 transcripts) and compromised lens iron storage capacity (owing to diminished expression of FTH transcripts) in cortical cataract might resulted in excess of un-sequested iron in the cell. This could have led to lenticular opacification due to increased oxidative damage to macromolecules. However, the present study has a few limitations to conclude the causal association of current findings with the cataractogenesis. First, the unavailability of sufficient donor eyes and/or control lenses for determination of the lenticular iron; second, selection of COMET assay alone for determining oxidative stress; third, absence of protein data on expression of iron homeostasis genes. This is a preliminary pilot study to correlate the level of iron and transcript expression of iron regulatory genes with different types of cataract. However, a future study shall be conducted to unravel the correlation between level of lenticular iron and expression status of iron regulatory genes at each grade of specific cataract type including the protein expression profiles of all iron homeostasis genes with large sample size.
We highlight a potential role of iron in oxidative DNA damage and differential expression of iron homeostasis genes in cataracts, especially in cortical cataracts. If these facts are well established in large cohorts of cataract population, it could provide an avenue to formulate therapeutics to prevent the formation of iron-mediated cataractogenesis. The up-regulation of IRE-DMT1 in lenses of cortical cataract further warrants the necessity of a systemic study involving physiological, environmental, and genetic factors to understand the exact underlying mechanisms.
This work was partly supported by a grant to S.R.K. from the Indian Council of Medical Research, New Delhi (F.N.5/4/6/2012-RMC). The funding agency did not have any role in study design, sample collection, analysis, interpretation of data, writing the manuscript and decision to submit the paper for publication. We thank Geereddy Bhanuprakash Reddy and Rajendran Anandhan, National Institute of Nutrition, Hyderabad for atomic absorption spectrophotometry analysis, Bijay Kumar Behera, ICAR-Central Inland Fisheries Research Institute, Kolkata for real-time PCR facilities and Kamalakannan Dhati Radhakrishnan, Thiagarajar College, Madurai for his contribution in manuscript preparation. The authors do not have any conflict of interest.