The objective of this report is to quantify left eye to right eye refractive state differentials resulting from the accumulation of naturally occurring random fluctuations.
Clinical SER data from adolescent emmetropic human subjects are measured and analyzed in terms of ensemble and time-series
Results include random fluctuations for left and right eyes of human subjects age 11 to 23 years. Ensemble R - L differential measurement for this group is +/- 0.21 diopters RMS. Left-Right coupling ratio is CR = 0.88 for both the differential
Ensemble and time-series results show that 15.9% of emmetropic adolescents are expected to progress into myopia during ages 12 to 22 years. Substantial shifts of greater than +/- 0.4 diopters will produce a negative myopic exponential time constant response of the focal status of the eye. The aim of this study is to analyze cross-sectional (ensemble) and longitudinal (time series) results, both in terms of the
Cross-sectional ensemble data, Longitudinal time-series data, Emmetropization, Progressive myopia, Feedback control systems, Left-right correlation, Refractive state data
The equivalency of cross-sectional data (ensemble) and longitudinal data (time series) is a useful simplification, finding application in the study of emmtropization and myopia progression. In this report, RMS refractive state fluctuations, including
Irving, et al. [1], Li, Zhu, et al. [2], Goss & Cox [3], Medina [4], and Greene & Medina [5] present refraction-time data, addressing the basic problems of cross-sectional and longitudinal data for emmetropes and myopes.
Greene & Medina [5] show that cross-sectional data indicates myopia progression at a yearly rate of -0.49 diopters/year, consistent with the longitudinal data of Goss & Cox [3] showing -0.40 diopters/year myopia progression rate. Zadnik, et al. [6] show that a single refraction data point R(t = to) can determine the future likelihood of myopia progression. One of the best reports is by Fledelius & Christensen [7] (N = 126 subj.) where longitudinal ocular growth rates are mathematically determined from cross-sectional data. Oakley & Young [8] and Greene, Grill & Medina [9] report myopia rates of -0.50 diopters/year, using both cross-sectional (ensemble) and longitudinal (time series) data techniques.
Ray & O'Day [10] discuss the important problem of the statistical independence and correlation of left and right eye experimental data. Hung & Ciuffreda [11] present a very detailed analysis and review of accommodation control systems and the stabilizing effects of plus lenses in the range +1.0 to +3.0 diopters. McBrien & Adams [12] investigate cross-sectional and longitudinal techniques for determining myopia onset and progression in adults (ages > 21 yrs.), finding a refractive state change of -0.58 diopters of myopia over 2 years for 39% of the population sampled (N = 37 subjects).
Hooker, et al. [13] report refractive state fluctuations of +/- 0.30 diopters RMS. Hung & Smith [14] demonstrate that negative and positive lenses of strength -3.0 and +3.0 diopters can alter the refractive state of primates to the same amount as the strength of these applied lenses, on a time scale of 60 to 90 days.
In terms of myopia prevalence, Vitale, et al. [15] and Greene & Medina [5] report that 38% to 42% of the U.S. population is myopic. Lin, et al. [16], Saxena, et al. [17], Pan, et al. [18], Saw, et al. [19] and Fan, et al. [20] present data from various demographics in Asia, indicating extreme myopia prevalence's of 40% to 95%, according to the populations sampled. Interestingly, several studies report that myopia is correlated with I.Q. *, +
Medical problems similar to, but distinctly different from normal subject statistics presented here include amblyopia, anisometropia, and anisomyopia. It is emphasized that the data presented in Appendix Table 1 are from normal uncorrected emmetropic subjects. Sometimes after correction, these types of problems may result in a permanent R-L differential.
Table 1: Coupling Ratios, +/- RMS fluctuations.View Table 1
The objective of this study is to analyze cross-sectional (ensemble) and longitudinal (time series) results, both in terms of the
The normal human and primate eye maintains long-term focal accuracy in the presence of focal perturbations. Making reasonable assumptions based on a physiological model, produces an accurate value for the eye's focal accuracy.
Laboratory experiments demonstrate that the normal eye adjusts its long-term focus by a dynamic process [21]. The exponential time-constant response of the eye to a focal perturbation in the eye's optical system is given by [22,23]
Eq. (1) R(t) = Offset + Accom – Perturbation * EXP (- t/τ)
While the equation can account for the eye's response, it cannot yield a direct measure of the eye's focal accuracy. The eye must overcome continuous micro-perturbations while growing to maintain accurate focus.
There is experimental evidence which suggests that each eye sets its long-term focus independently of the other eye [24]. In this study of myopia development, accommodation in one eye was prevented with atropine while the other was not. The results show the atropinized eye stabilized while the non-atropinized eye progressed into myopia. The model treats the left and right eye as two independently tracking mechanisms. Each eye uses its own accommodation signal to drive the long-term focal setting system [23]. Each eye has random noise in the actuator, i.e. perturbations in the focal status of the eye, Figure 1.
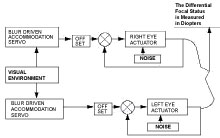 Figure 1: First-order closed-loop control systems are used to predict the behavior of the left and right eyes. Actuator noise perturbs the eye's focal state. View Figure 1
Sources of random noise in the optical system may include ordinary blinking, tear film variations, varying lighting conditions, contact lenses, so-called "spectacle blur" after removing contact lenses, variable intraocular pressure, seasonal variations, febrile disease, medical problems, the student's academic schedule, excessive use of alcohol, tobacco, marijuana, caffeine, drug side-effects, excessive close work, etc.
The function 1/(τ s + 1) for the eye's behavior has an exponential time-constant of ~ 100 days. The offset of the normal eye has a value of ~ 1.5 diopters. A Bode graph of this transfer function is shown, Figure 2. The high frequency components of noise fluctuations are attenuated. The eye's focal status will change very slowly on a daily basis, -0.01 to -0.001 diopt/day.
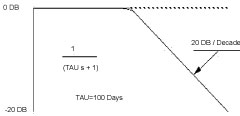 Figure 2: Bode plot showing the frequency response characteristics of a first-order control system with time constant τ = 100 days. View Figure 2
The closed loop frequency response shows a break point at 100 days, and a frequency roll-off of -6 DB/Octave. This transfer function can be modeled by an analog computer, Figure 2 and Figure 3.
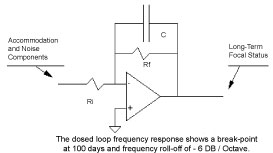 Figure 3: Analog computer representation of 1-st order control system with R-C feedback network. View Figure 3
The focal states in Appendix Table 1 show the focal status of 20 individuals selected at random from the age of 11 to 23. The RMS value is calculated from the differential measurement. Refractive state data in Appendix Table 1 are provided by the Berger Clinic [23] randomly selected from patient files. SER (spherical equivalent) refractions were subjective, non-cycloplegic, accurate within +/- 0.25 D. Patients with normal vision were chosen for the statistical sample. Subject I.D. is deleted from the data record to maintain patient confidentiality. I.R.B. approval was granted.
If the eye's control system were perfect, the focal setting of the left eye would be identical to the right. The extent to which this is not the case will give us a means to determine the eye's tracking accuracy.
We can measure the differential focal status developed between the left and right eye. This technique is based on the statistical principle that the squares of noise sources may be added algebraically.
Eq. (2) Differential ^2 = Left Eye ^2 + Right Eye ^2
The same factors that produce perturbations in the left and right eye are equivalent for both eyes, assuming the underlying noise process is ergodic, which is highly probable for all normal eyes. Therefore, combining the noise statistic of the left and the right eyes:
Eq. (3) Differential ^2 = 2 * Individual ^2
Taking the square root of both sides:
Eq. (4) Differential * 0.707 = RMS noise in each eye
Using the equation in this form allows measurement of the differential focal status of an individual over a period of months. This sequence of measurements produces a continuing account of the eye's tracking accuracy, even though the average visual environment is changing. Measurement of noise by this technique is called the longitudinal or time-series of a stationary random process.
To simulate time-series random fluctuations in refractive state of the left and right eyes, randomly oscillating voltage signals are created using standard chipsets and operational amplifiers available from Radio Shack (Archer Electonic Components). A 2-MHz digital storage oscilloscope was used, model DSO 112, manufactured in China. The quad op amps were #324, with a band width of 10 kHz. Initial voltages supplied to the chips are +10- and -10-volts DC, yielding randomly fluctuating signals in the range Vpp = 150 millivolts. Simulated signals are shown in Figure 4. AC voltage measurements of RMS confirm the basic equation for sums and differences sqr [< ( R – L ) ^ 2 >] and sqr [ < R + L > ) ^ 2].
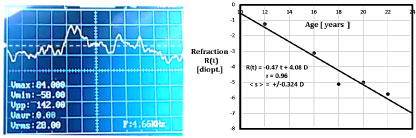 Figure 4: (a) Storage oscilloscope trace of stationary random time series, showing average = ~ 0.0 volts, RMS = +/- 27 mV; (b) Longitudinal time-series refraction data from college student showing RMS = +/- 0.32 D [Ref. 10]. View Figure 4
In order to demonstrate how the changing focal status of the left and right eye generates a third differential noise statistic, a QBasic random number generator is programmed to simulate the noise in the left and right eyes, Figure 5. L(t) and R(t) are assumed to fluctuate independently App. I. The program then calculates the differential measurement by subtracting the left eye's focal status from the right eye's focal status.
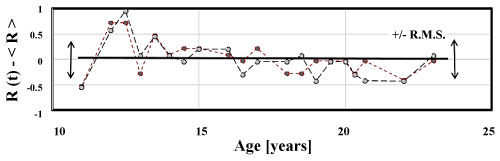 Figure 5A: Right R(t) and Left L(t) refractive states fluctuate about mean values
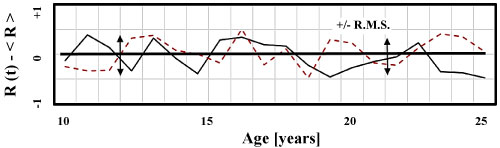 Figure 5B: Computer generated Right R(t) and Left L(t) refractive states fluctuate about mean values
Eq. (5) Differential ^2 = Left ^2 + Right ^2
(.213) ^2 = (.151) ^2 + (.151) ^2
The individual noise values in the program that produce the differential noise statistic are:
Eq. (6) Left = +/- 0.124 diopt Right = +/- 0.174 diopt
The average of these two numbers is 0.149 diopters RMS. Our estimate, calculated from the differential value, is +/- 0.15 to +/- 0.35 diopt. RMS.
In dealing with stationary random processes, time averages are equivalent to ensemble averages. This is the classical Ergodic Theorem of statistics [25-30].
The ensemble differential measurement for this group of individuals is +/- 0.213 diopters RMS. The differential equation allows the calculation of the noise level in each individual eye:
Eq. (7) DIFFERENTIAL * .707 = INDIVIDUAL EYE NOISE
(.213) * .707 = +/- 0.151 Diopters RMS
Table 1 displays 4 comparable studies from the literature, showing that L-R fluctuations from +/- 0.2 to +/- 1.6 diopt. RMS are a normal part of the development process.
Troilo, Totonelly and Harb [27] present data from marmosets showing left-right differentials of +/- 1.70 diopt. RMS during development, Table 1. Similarly, the random number function RND(t) is readily converted to a stationary random time-series R(t) = RND(t) – 0.5 diopt. This produces totally independent L and R signals, with coupling ratio CR = 0.0 and <(L-R)^2> = +/-0.3 diopt RMS, as shown in Table 1. Hooker, et al. [13] show random fluctuations in the range +/- 0.3 to +/- 0.6 diopters.
One limitation of the Ergodic Theorem from statistics, as applied here to the time course fluctuations of human emmetropization data, is that while these statistical techniques accurately determine the average time series and RMS fluctuations about the trend line, they cannot predict the frequency or time-scale of these fluctuations (see Fig. 4). The reason for this is simple. With a single "snap-shot" of the cross-sectional data, the time scale is simply not available. However, our preliminary numerical work to date, using an FFT program, indicates that Fourier analysis of the cross-sectional data does indeed reveal all the fundamental harmonic time components, for frequencies less rapid than the sampling frequency. In other words, in terms of retrieving maximum information from the data, the situation is better than expected, improving with large sample size, at smaller time intervals. Future work may try to address this challenging problem, in terms of extracting the Fourier component spectrum.
Figure 6, correlating left and right refractions, deserves some additional explanation. For this N = 20 subj. data set, it is only a co-incidence that both the line slope b and regression r have values about ~0.8. Strictly speaking, the regression line slope (b = 0.80 for Figure 6) is an indicator of the independence of the Left and Right refractions, whereas the correlation (r = +0.82 for Figure 6) coefficient is an indication of the quality, accuracy, or distribution of the data about said line. Note that for larger and larger data sets, the significance value (p < 0.05) can improve to p < 0.0001.
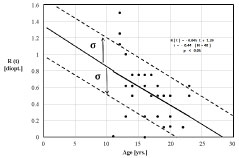 Figure 6A: Refractive status for N = 40 student eyes. Regression trend line indicates refractive state proceeds as R(t) = -0.045 t + 1.29 diopters. Statistics (+/- σ) indicate 15.9% are expected to progress into myopia during the period 12 to 22 years. An additional 34.1% will likely trend into myopia from 22 to 27 years. View Figure 6A
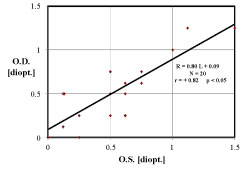 Figure 6B: Emmetropic human subjects have Left Eye (OS) refractive state L [ D.] partially correlated with the Right Eye (OD) R [ D.], correlation coefficient r = 0.82, p < 0.05. The Left-Right disparity ratio is the regression slope 0.80, indicating that the left and right refractions are approximately the same, within ~20%. Haegerstrom, et al. [25] present comparable results. View Figure 6B
Previous experiments show the normal eye sets its long-term focus by a dynamic process. Physiological systems are complex and contain parameters which are not always clearly defined nor easily measured. Therefore, assumptions and simplifications are necessary in order to understand the long-term behavior of the normal eye. This requires insight into the fundamental behavior of optical systems in the presence of perturbations. Advanced statistical techniques establish the tracking accuracy of the normal eye Appendix 1.