

International Journal of Radiology and Imaging Technology
Comparison of Arterial Spin Labeling and Dynamic Susceptibility Contrast-Enhanced MR Perfusion in Differentiating Tumor Recurrence from Treatment-Related Changes
Robert J Bert1*, William Colantoni III2, Douglas E Ney3,4, Denise M Damek3,4, Bette K Kleinschmidt-DeMasters3,4,5 and Manuel Thomas Borges2
1Department of Radiology, University of Louisville, USA
2Department of Radiology, University of Colorado Denver Anschutz Medical Campus, USA
3Department of Neurology, University of Colorado Denver Anschutz Medical Campus, USA
4Department of Neurosurgery, University of Colorado Denver Anschutz Medical Campus, USA
5Department of Pathology, University of Colorado Denver Anschutz Medical Campus, USA
*Corresponding author: Robert J Bert, Ph.D, Department of Radiology, University of Louisville, 530 South Jackson Street, Suite C07 Louisville, KY 40202, USA, Tel: 502-852-6619, Fax: 502-852-1754, E-mail: rjbert03@louisville.edu
Int J Radiol Imaging Technol, IJRIT-3-022, (Volume 3, Issue 1), Original Research
Received: February 07, 2017 | Accepted: February 21, 2017 | Published: February 24, 2017
Citation: Bert RJ, William C III , Ney DE, Damek DM, Kleinschmidt-DeMasters BK, et al. (2017) Comparison of Arterial Spin Labeling and Dynamic Susceptibility Contrast-Enhanced MR Perfusion in Differentiating Tumor Recurrence from Treatment-Related Changes. Int J Radiol Imaging Technol 3:022.
Copyright: © 2017 Bert RJ, et al. This is an open-access article distributed under the terms of the Creative Commons Attribution License, which permits unrestricted use, distribution, and reproduction in any medium, provided the original author and source are credited.
Abstract
Introduction: MR dynamic susceptibility contrast-enhanced perfusion (DSC) has demonstrated utility in the evaluation of follow-up malignant CNS neoplasms. Preliminary studies suggest Arterial Spin Labeling (ASL) perfusion may be equivalent for this purpose. Using a retroprospective, blinded test design, we compared interpretations of ASL and DSC in tumor follow-up.
Methods: Follow-up studies from fifty patients with primary CNS tumors (76 total studies) were evaluated: 75 studies with ASL and 28 with DSC. Of these, 27 were synchronous studies. Three trained neuroradiologists evaluated and graded the studies using a 3-point scale: 1 = increased perfusion (persistent, progressive or recurrent tumor), 2 = equivocal perfusion (inconclusive), 3 = low perfusion (treatment necrosis or persistent low grade). Observer and technique concordances were calculated, along with observer accuracy. Radiologic grading was compared to the final clinical or pathologic diagnosis.
Results: In the synchronous cohort, inter-observer agreement was 78% for ASL and 70% for DSC, with Fleiss' free marginal kappa 0.67 for ASL (substantial agreement) and 0.56 (moderate agreement) for DSC. Individual observer concordances between ASL and DSC, using Cohen's kappa, ranged from 0.58 (moderate) to 0.86 (near perfect). There was one complete discordant score set (1 vs. 3 ratings) between readers for the DSC study limb and none for the ASL limb. Accuracy for 21 unequivocal synchronous cases was 92% for ASL and 88% for DSC. The extended cohort accuracy for ASL was 86% (60 unequivocal cases).
Conclusions: ASL perfusion is a promising alternative to DSC in primary malignant CNS neoplasm follow-up.
Introduction
Differentiating treatment-related changes from tumor recurrence in cases of cerebral gliomas has been a long-standing difficulty [1,2]. Recent advances in the treatment of high grade primary brain tumors has significantly increased the challenge of interpreting follow up MR imaging used for monitoring disease progression, tumor response and prognostication for these patients [3-5].
In addition to the formidable problem of differentiating treatment-related necrosis from tumor recurrence, referred to as pseudo-progression, the use of antiangiogenic agents has lead to decreased contrast enhancement in the presence of existing tumor, referred to as pseudo-response. These problems have resulted in the development of new criteria for evaluation, under the acronym for Response Assessment in Neuro-Oncology criteria (RANO) [6,7].
Distinguishing true tumor progression from treatment-related changes is very important in managing these complex patients. Misinterpretation can result in unnecessary surgical interventions on one hand, or withholding needed therapy on the other. Pseudo-response can lead to incorrect prognostication for patients, leading to delay in end of life management and disappointment for a patient. Furthermore, it can lead to misinterpretation of data during clinical trials.
These diagnostic dilemmas now occur relatively frequently, when conventional imaging is performed alone for tumor follow up. However, Dynamic Susceptibility Contrast-enhanced (DSC) perfusion imaging has demonstrated its utility in differentiating central nervous system recurrent tumors from treatment-related changes [8,9].
Arterial Spin Labeling (ASL) perfusion has been recently FDA approved for three MRI manufacturers (Siemens, GE, Philips). ASL, however, is a costly software package and its general utility is only now being tested. It has some advantages over DSC, in that it is performed without contrast, it has less venous contamination (depending on supplier) and image co-localization with structural images can be routinely performed. The added imaging time of ASL is small and in our experience, offset by time saved performing DSC, which requires pressure contrast injection and more complex post processing. An important question is whether or not ASL performs as well as DSC in differentiating recurrent or residual neoplasm from pseudoprogression and pseudoresponse.
Preliminary studies and vendor-supplied literature suggest that ASL may be equal to DSC in estimating tumor blood flow in the central nervous system [10-13]. A limited pilot study has been reported comparing ASL and DSC in differentiating tumor progression from treatment response for a small group of patients undergoing proton beam radiotherapy [14]. These investigators reported a possible advantage of ASL over DSC. However, in that study, only a single slice image was selected for comparison, and this slice was chosen based on T2-weighted images rather than contrast enhancement on T1-weighted images [10,15].
Contemporary clinical practice often does not permit time for quantitative assessment of perfusion images but DSC images are often acquired and evaluated subjectively. In our clinical experience, subjective evaluations have provided useful information to our referring clinicians in differentiating tumor from treatment-related changes. At the request of our referring physicians, we were asked to clinically evaluate ASL for its use in brain tumor follow up, and for a period of time, we obtained both ASL and DSC images on brain tumor. While the clinical utility of ASL became rapidly apparent, we decided to formally compare these two imaging techniques using a blinded retrospective paradigm.
Methods
IRB exemption was obtained to collect and re-evaluate tumor studies from our PACS database, from 2/23/2011-4/26/2012.
Patient selection and data confidentiality
We retrospectively screened our existing PACs database (McKesson, San Francisco, CA) using dates and referring physicians. Inclusion criteria were primary brain neoplasms currently being treated in the age range of 18-90. Exclusion criteria were WHO grade I neoplasms, non-glial tumors, metastasis, age less than 18 years, extra-axial tumors (such as meningiomas) and vulnerable populations.
A primary cohort of patients was chosen where ASL studies had been performed using commercial imaging sequences from one of two vendors (Philips Medical Systems, Seattle WA; GE Healthcare, Waukesha, WI). A comparison cohort of DSC studies was selected from the same patient database. Twenty-seven patients had both DSC and ASL performed on the same date and these are referred to as synchronous studies, i.e. both DSC and ASL were performed on the patient minutes apart on the same scanner. ASL was performed as the last noncontrast sequence, followed by DSC, which was then performed as the first post contrast sequence.
The primary cohort, however, contained a large number of patients where only ASL had been used in the evaluation of primary tumor patients. We thus created a larger cohort of ASL studies in primary tumor patients that included both the ASL studies from the synchronous cohort and those patients where only ASL sequences had been obtained. We refer to this larger data set as the expanded cohort. The additional non-synchronous ASL studies had all been performed on the 3T system. This larger cohort presented the opportunity to evaluate the statistical stability of the synchronous findings for ASL from the smaller sample.
Cases were stored in the teaching files section of our PACS system, de-identified and protected by the University of Colorado Hospital firewall. De-identified scoring data sheets were also kept behind the University of Colorado Hospital firewall. Analyzed data were listed by exam date only, with no identifiable parameters.
Technical parameters
All patients had undergone standard MRI clinical structural imaging:
1) Whole brain, pre-contrast, 5 mm axial T1, T2 TSE, T2 FLAIR, T2 Gradient Refocused Echo (GRE) images, Diffusion-Weighted Images (DWI) and Apparent Diffusion Coefficient maps (ADC);
2) Whole brain post contrast 5 mm axial, sagittal and coronal T1-weighted images. Standard Gadolinium single doses given were 0.1 millimole/kg.
MRI ASL systems: Patients were imaged either with (predominantly) 3.0 Tesla pseudo-continuous ASL or 1.5 Tesla pulsed ASL (GE HD16.0 V01 1108.b; Signa HDx, GE Healthcare, Waukesha, WI, or Philips Achieva 3.2.1, Philips Medical Systems, Seattle, WA). The GE patient studies were imaged with a 3T axial, pulsed-continuous, single delay time (GE offers three choices for delay time: pediatric, adult, late adult. The "adult" setting was chosen), spin echo acquisition with spiral readout (TR = 4537/TE = 10.244/FA 155/TI = 1525/ETL = 1/4 mm slice, no gap/FOV = 240 × 240 mm/NEx = 3/matrix = 512 × 512 × 8/16 bit;/slice thickness = 4 mm/bandwidth = 500 kHz, Signa HDx, software version 16.0, GE Healthcare, Waukesha, WI). Post processing was performed using the commercially-available corresponding vendor software (GE HD16.0 V01 1108.b).
The 1. 5 Tesla system used pulsed ASL with echo-planar readout, first running a multiphase sequence to optimize capillary signal with the following parameters: FOV = 240 × 240 mm/matrix 68 × 68/TR = 250 msec/TE = 20 msec/FA = 35/ETL = 33/slice thickness 10 mm/bandwidth = 81.192/48 slices. Delay times were chosen to optimize the capillary phase at the slices of interest and varied from 1200 msec to 2500 msec, depending on cardiac output.
DSC imaging: DSC images obtained on the 3T system used echoplanar readout with the following parameters: FOV = 220 × 220/matrix 96 × 128/ETL = 1/TR = 2000/TE = 20.7/FA = 60/slice thickness = 7 mm/bandwidth = 500 kHz/number of phases = 34, injection 20 mL @ 5 mL/sec, Multihance Bracco Diagnostics, Milan, Italy, (HDx, GE Medical Systems, Milwaukee, WI). Post processed maps of CBV (negative integral), CBF, MTT and TTP (time to minimum) were constructed using a standard software package (Software version 15.0 M4A, Func tool, GE Healthcare, Waukesha, WI).
DSC images obtained on the 1.5T system used echoplanar readout with the following parameters: FOV = 224 × 224 mm/matrix 88 × 88/ ETL = 47/TR = 1524/ TE = 40/FA = 75/slice thickness = 7 mm/bandwidth = 179 kHz/number of phases = 40, injection 20 mL @ 5 mL/sec, (Multihance Bracco Diagnostics, Milan, Italy). Post processed maps of CBV, CBF, MTT and TTP (time to minimum) were constructed using the standard Phillips software package (software version 3.3.2). Note that manufacturer recommendations are 7 mm thickness, compared to 5 mm thickness used for structural images.
Data scoring and analysis
Each study was evaluated by three trained neuroradiologists using a three-point grading scale: 1 = recurrent or persistent tumor, 2 = indeterminate, 3 = treatment-induced tissue injury. The interpretations were rendered and scored blindly. That is, the neuroradiologists were not allowed to see the original reports, any clinical data (such as biopsy results) or radiographic followup. They were given access to structural images for correlation and perfusion-weighted images but not allowed to review any spectroscopy data that might have been collected. The three neuroradiologist were of different levels experience. Reviewer 1 was a neuroradiology fellow at the end of his first year of training. Radiologist 2 was a senior neuroradiologist who had graduated from a two-year neuroradiology fellowship program and had been in practice 12 years. Neuroradiologist 3 graduated from a two-year fellowship program and had 2-3 years post graduate experience.
Structural evaluation: As a first step for each cohort, structural MR images from the CNS tumor patients were reviewed and assessed for contrast enhancement and areas of increased signal on T2 FLAIR images. Cerebral blood volume (DSC) and cerebral blood flow (ASL) images were then reviewed with specific attention paid to the entire regions of abnormality throughout the entire brain. The PACs system provided a tool for cross-referencing of ASL and structural images. Post processed DSC images could not be exactly cross referenced on the PACs system, so similar locations had to be estimated anatomically by the trained observers.
Categorical assignments: Categories described above were assigned subjectively, based on the perceived degree of enhancement, in an attempt to mimic how perfusion imaging is used in a busy radiology practice. Category 1 was assessed when at least one clear focus of hyper-perfusion, in white or gray matter, was grossly increased relative to the corresponding region of the opposite hemisphere or the immediately surrounding brain tissue. Category 3 was assigned when enhancing or increased T2 signal regions clearly demonstrated hypo-perfusion, relative to the corresponding region of the opposite hemisphere or the immediately surrounding brain tissue. Grade 2 was assigned when perfusion signal in enhancing or increased T2 signal regions were judged as equivocal or mildly increased, relative to the corresponding region of the opposite hemisphere or the immediately surrounding brain tissue.
Inter-observer agreement: The grading from each of the 3 independent reviewers was recorded for each study. Raw numerical agreement percentages were calculated for complete agreement (i.e., all observers give same score), partial agreement (i.e., scores of 1 & 2 or 2 & 3) or complete discordance (i.e., 1 & 3). Additionally, both the group concordance using Fleiss’ Kappa and pair-wise concordances using Cohen’s Kappa were scored.
Perfusion technique agreement: For the 27 cases where both ASL and DSC images were obtained, the two techniques were numerically compared by calculating the raw percentage of agreement and by calculating Cohen’s Kappa for each observer. Overall raw percentage agreement between ASL and DSC were calculated in a manner similar to the inter-observer agreement: complete agreement percentage, partial agreement percentage and disagreement. Cohen’s kappa was linearly weighted to reflect that 1-3 scores were more discordant than 1-2 and 2-3 scores.
Clinical accuracy: Once scoring had been performed, one neuroradiologist was assigned to review follow up studies, pathology and clinical course. Final consensus of the actual outcome was then obtained after review with all three observers. Cases that were graded indeterminate by two of three scorers, or that were indeterminate as to the final outcome were not scored for accuracy and are discussed separately below. Follow up confirmation or discrepancy of the original scoring was used to calculate positive predictive value (PPV), negative predictive value (NPV) and accuracy for each original reading of each of the two cohorts (ASL and DSC) of the studies using a simple 2 × 2 table model. True positive and true negative scores were awarded when at least two of the three scores agreed with the final outcome. Likewise, false positive and false negative scores were awarded if at least two of the three scores disagreed with the final outcomes.
Results
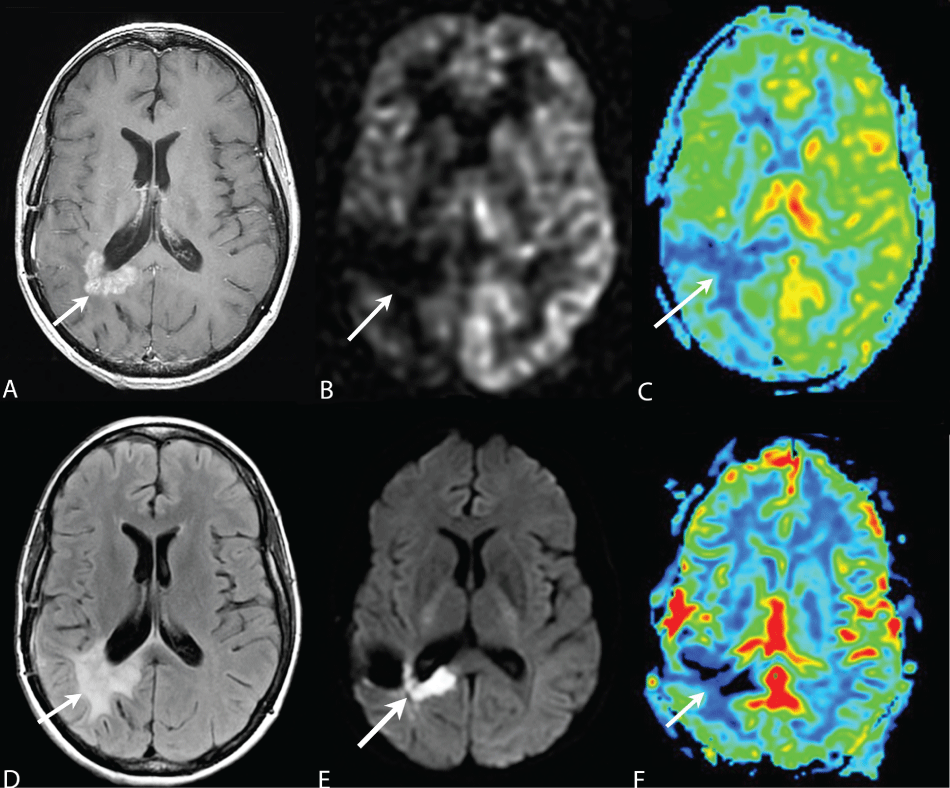
A total of 51 patients and 76 studies were evaluated. All had glial tumors: 8 WHO Grade II, 19 WHO Grade III, 23 WHO Grade IV and 1 indeterminate WHO Grade III or Grade IV. Figure 1 demonstrates a typical case of ASL and DSC images interpreted by all three readers as radiation necrosis. In this case, radiation necrosis was confirmed pathologically after biopsy. Notably, there was associated strongly restrictive diffusion along a portion of the enhancing lesion. Also note worthy is the minimal mass effect on the right atrium, demonstrated on structural images, considering the size of the enhancing lesion.
.
Figure 1: Path proven radiation necrosis. (3T images from HDx scanner, GE Healthcare, Waukesha, WI). The area of contrast enhancement (arrow A) and confluent increased T2 FLAIR signal (arrow D) demonstrates hypo-perfusion on ASL (arrows B, C) and DSC (arrows F) images. Note that a small portion of the lesion shows restricted diffusion, consistent with necrosis (arrow E).
A) Post contrast T1-weighted image; B) ASL black and white cerebral blood flow image (SE, pseudocontinuous, GE Healthcare, Waukesha, WI); C) ASL color map (post processed with Functool, GE Healthcare, Waukesha, WI); D) T2 FLAIR image; E) Trace DWI image, B value 1800; F) Negative enhancement integral (cerebral blood volume) color map from Dynamic Susceptibility Contrast enhanced perfusion study (post processed with Functool, GE Healthcare, Waukesha, WI). Note that minor differences in appearance of F are attributable by variations in slice thickness, echoplanar distortion and post processing.
View Figure 1
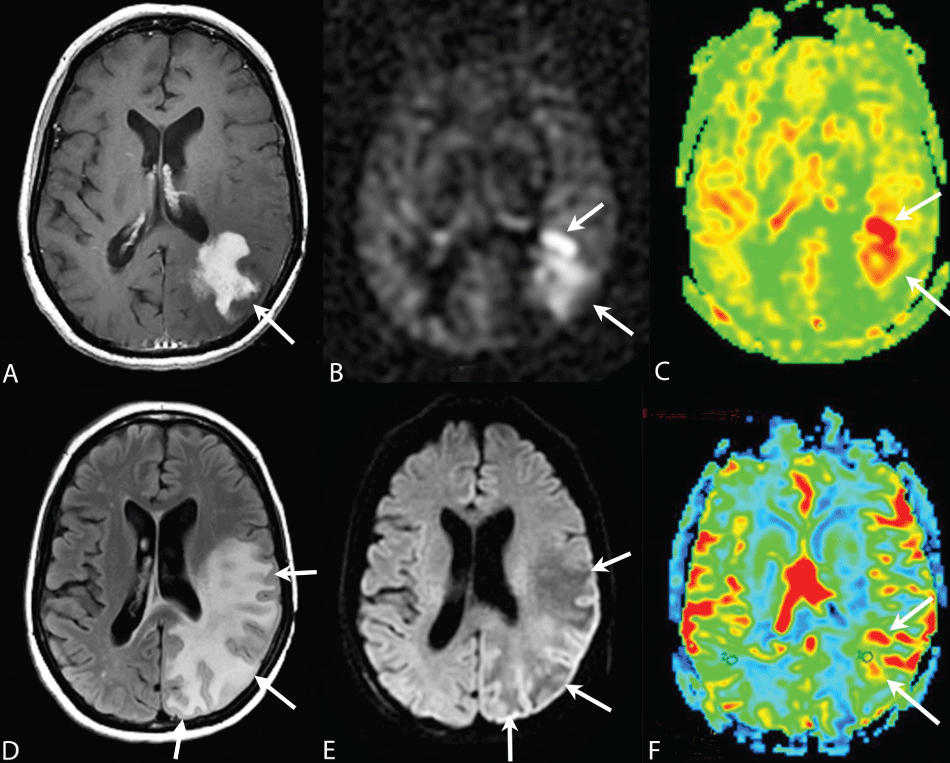
Figure 2 demonstrates a case showing ASL and DSC findings interpreted as tumor by all three readers. Of note, the diffusion-weighted images showed minimal or no diffusion restriction and extensive surrounding vasogenic edema. Mass effect on the left atrium was significantly greater than on the previous case. The diagnosis was confirmed by resection and pathologic diagnosis.
.
Figure 2: Path Proven Tumor. (3T images from HDx scanner, GE Healthcare, Waukesha, WI). The area of contrast enhancement (arrow 2A) demonstrates a region of hyper-perfusion on ASL (arrows B, C) and DSC (arrow F) images. Note there is no evidence of necrosis on the correlating DWI image (E). Perfusion in the non-enhancing portion of T2 FLAIR signal abnormality (arrowheads D) demonstrates vasogenic edema on DWI images (arrowheads E) and perfuses normally anteriorly but hypoperfuses posteriorly (arrowheads B, C, F).
A) Post contrast T1-weighted image; B) ASL black and white cerebral blood flow image (SE, pseudo continuous, GE Healthcare, Waukesha, WI); C) ASL color map (post processed with Functool, GE Healthcare, Waukesha, WI); D) T2 FLAIR image; E) Trace DWI image, B value 1800; F) Negative enhancement integral (cerebral blood volume) color map from Dynamic Susceptibility Contrast enhanced perfusion study (post processed with Functool, GE Medical Systems, Waukesha, WI). Note that minor differences in appearances of B, C and F are from variations in slice thickness 7 mm perfusion vs. 5 mm for structural images and slight head movement of patient.
View Figure 2
![]()
Table 1: Observer concordance for 27 Synchronous Studies. Overall agreement = percent agreement between pairs of observers (1-2, 1-3, 2-3). Complete agreement = exact grading agreement between all observers. Partial Discordance = one observer giving a one-grade difference from the other two observers. Complete discordance = at least one observer giving a two point grade difference from at least one other observer. Kappa interpretation: almost perfect (0.81-1.0), substantial agreement (0.61-0.80), moderate agreement (0.41-0.60).
View Table 1
Table 1, table 2 and table 3 present inter-reader variability, inter-technique variability and test accuracies for the two different perfusion techniques.
![]()
Table 2: Technique concordance by observer. Partial Discordance = an observer giving a one-grade difference between the two techniques. Complete discordance = a two point grade difference between the two techniques. Concordance = exact grading agreement for both techniques. Cohen's linear kappa interpretation: almost perfect (0.81-1.0), substantial agreement (0.61-0.80), moderate agreement (0.41-0.60).
View Table 2
![]()
Table 3: 2 × 2 table values for ASL and DSC. The top two tables are the synchronous cohorts of ASL and DSC i.e. both DSC and ASL were performed on the patient minutes apart on the same scanner. ASL was performed as the last noncontrast sequence, the followed by DSC as the first post contrast sequence. The bottom tables are the subset of 24 synchronous studies where both ASL and DSC were performed, censored by exclusion of three patients whose outcomes remained indeterminate over the study period.
View Table 3
In the synchronous cohort of patients (27 patients imaged at the same appointment on the same scanner), complete agreement between all three observers for ASL was 67% and DSC was 54%. Partial discordance, defined above, between at least 2 of the three observers for a study occurred 33% of the time with ASL and 44% of the time for DSC. Complete discordance, with at least 2 of the three observers scoring 1 vs. 3 for a single study, did not occur in the ASL studies and occurred only 4% of the time (single case) in the DSC studies. Fleiss' free margin kappa for the three observers was 0.67 using ASL (substantial agreement) and 0.56 (moderate agreement) for DSC.
Comparison of an individual reader's interpretation between the two techniques (ASL vs. DSC) was evaluated using Cohen's kappa with linear weighting. Individual data for the three scorers are shown in table 2. Cohen's kappa ranged from 0.58 (moderate) to 0.86 (near perfect) between the three readers. Individual concordances for the two techniques varied from 67% to 89%. This was mostly due to partial discordances, which varied from 11% to 30%. There were two completely discordant readings (2%) between ASL and DSC, one by each of two different readers. Summing the results for the three readers, complete concordance between the two techniques was observed 76% of the time, while partial discordance was observed 21% of the time. Complete discordance occurred for only 2% of the readings.
Two × two tables for ASL and DSC are shown in table 3. Both ASL and DSC were generally accurate, in those cases with current available definitive diagnoses. In the expanded cohort of 75 cases evaluated with ASL, twelve cases were indeterminate by the scorers and five cases had indeterminate outcomes. In the 27 cases evaluated with DSL, there were four cases scored indeterminate and three additional cases had indeterminate outcomes. The tables were constructed assuming that an indeterminate score was assumed to be negative test result. In table 3A and table 3B, an indeterminate result was assumed to be a negative condition, i.e. treated as radiation necrosis in the table, not tumor recurrence. In table 3C and table 3D, intermediate scores were also treated as a negative test result but the data was censored to exclude three tests where the outcomes remained indeterminate over the study period. Accuracy for ASL was 89% in the uncensored data and 92% in for the censored data. Positive predictive value (PPV) was 83% uncensored, 100% censored, and the negative predictive value (NPV) was 90% uncensored and 89% censored. Sensitivity was 71% for both censored and uncensored groups. Specificity was 95% for the total uncensored cohort and 100% for the censored subset.
Accuracy for DSC was 85% uncensored and 88% censored. PPV was 83% uncensored and 100% censored. NPV was 86% censored and 85% uncensored. Sensitivity was 63% for the total uncensored cohort and 57% for the censored subset. Specificity was 90% for the total uncensored cohort and 100% for the censored subset.
Finally, kappa, agreement, accuracy, PPV, NPV, sensitivity and specificity were calculated for the expanded cohort of ASL studies, for both the total cohort of 75 studies and a censored cohort removing the five cases where the final outcome remained indeterminate at the end of the study period. Fleiss' free margin kappa was 0.69 for the uncensored data and 0.70 for the censored data, both in the substantial agreement range. Complete agreement was 69% for the uncensored cohort and 70% for the censored subset. PPV was 78% uncensored and 88% for the censored subset. NPV was 86% uncensored and 85% censored. Sensitivity was 64% uncensored, 64% censored, and specificity was 92% uncensored, 64% censored. Accuracy was 84% uncensored and 86% censored (Table 4).
![]()
Table 4: Observer concordance and 2 × 2 table values for Extended ASL cohort with both 3.0 T and 1.5 T systems. Observer concordance is defined as in table 1. The left 2 × 2 table is for the entire extended cohort of ASL studies, while the right table is censored, excluding 5 study results that were ambiguous, i.e., outcome was not be definitive by the study's end.
View Table 4
Discussion
Limitations
Two limitations in our study design were the use of only commercially available, FDA approved sequences and widening our database to include cases obtained on both 1.5T and 3.0T systems from different manufacturers. These factors certainly influence S/N and would be legitimate criticisms if our study had attempted to uncover subtle improved efficacy of DSC vs. ASL. Making such a comparison, we believed, would be not only arduous, but the results would not likely be accurate if applied across platforms. Technical aspects of manufacturer's products for both ASL and DSC vary considerably and multiple factors affect S/N. Just a few of the differences between the GE and Philips products are PCASL vs. PASL acquisition, multiphase (multiple time delays) tuning before single phase acquisition vs. single phase with three fixed delay timing selection, 3D vs. 2D acquisition, SPIRAL vs. EPI acquisition, head coil construction and point of A/D conversion. Additional variables affect S/N obtained from other manufacturers. The number of variables and constant technological improvements in S/N would make any attempt at quantitative comparison short lived at best and irrelevant at worst.
A third consideration is that we did not attempt to obtain quantitative ROI statistics for comparison to our subjective observations. Instead, we chose to compare our results directly to the gold standards: pathology and clinical outcome, in order to obtain PPV, NPV, accuracy, sensitivity and specificity. Since the results were assessed directly against these gold standards, comparison to ROI statistics offered no meaningful insights into the subjective measurements used and might prove confusing. We would point out that ROI statistics are not a gold standard and are ladened with subjective choices, such as: choice of control area, choice of test areas (hyperperfusing tumor may not enhance or occur outside of enhancing regions), choice of proper border (border of enhancement or perfusion), choice of S/N that defines the border, choice of regional volume or slice cross section for comparison, choice of smoothing algorithms employed by the manufacture, choice of manufacturer methods of auto-scaling and choice of control for image distortion in echoplanar acquisitions. Additionally, it is not completely understood how much distortion is introduced by the negative contrast in DSC. Finally, leakage correction was not available in the manufacturers' FDA-approved DSC packages at the time of the study.
It has not been clearly established that ROI analysis outperforms subjective radiological interpretation. In many instances, such as stroke perfusion imaging, extensive efforts to make quantitative methods meaningful have not been entirely clinically successful, despite years of research and development. It is our own experience that automated quantitative stroke imaging products fail quite commonly. The quantification problems are only amplified in treated tumors, which have highly variable heterogeneity. While ROI analysis may seduce radiologists into thinking that the results are meaningful, any such reassurance can be questioned. Because our results were compared to the true gold standards of clinical outcome and pathology, they stand regardless of any ROI statistical correlation.
ROI statistics, however, have been used previously to compare ASL and DSC [10] analyzing single slices. In this prior study, data were collected with custom software and custom acquisition, and evaluation was limited to contrast-enhancing regions. Despite the differences in protocols, our results are in agreement with this previous study.
Finally, we would add that ROI analysis is very time consuming and not clinically practical in current clinical environments. ROI analysis is only rarely used in daily clinical interpretation, and in most busy centers, it is not a practical option. Thus the two important questions we asked were:
1."Could a simple clinical grading system be used with ASL and DSC to help distinguish tumor recurrence, pseudo-recurrence and pseudo-progression?"
2. "What would be the accuracy and limitations of such a method, with respect to the true gold standards, clinical outcome and pathology results?"
Our results provide good preliminary evidence that at least two manufacturers have developed clinically reliable ASL sequences that are the equivalent of DSC, with regard to subjective differentiation of recurrent tumor from treatment-related enhancement. This statement is supported by the results from the censored cohort of 24 studies where both ASL and DSC had definitive results, where the two techniques showed similar accuracies, PPV and NPV, when at least two of the three readers agreed on the scoring. The accuracy, PPV and NPV fell slightly in the much larger cohort of ASL studies, but remained comparable. While this is undoubtedly partially a statistical phenomenon, certain sources of potential complications in interpretation became apparent when some cases from the larger cohort were reviewed with clinical and pathology colleagues. One of the complicating factors was the development of small telangiectasias after optimal radiation treatment, demonstrated pathologically. While this was not a frequent occurrence, it did result in a few false positive results in tumors classified as WHO grade III, who had longer post treatment life spans. Another factor leading to false positive studies in the larger cohort were enhancing regions near the temporal horns. The normal high perfusion of the choroid plexus, within the choroidal fissure, was sometimes confused with hyper perfusion in the nearby enhancing region, as a result of volume averaging.
Concordance between readers and the two techniques was quite good when hyperperfusion or hypoperfusion was clear. Our overall concordance results are similar to previous studies that compared high-grade tumor perfusion in DSC and ASL [14]. In our study, however, ASL demonstrated less variability between scorers than DSC, as demonstrated by the higher Fleiss’ Kappa values for ASL. All three readers did agree that interpreting the ASL images was more straightforward, as venous contamination, which occurs with DSC, did not complicate the interpretations. It should be noted that this is vendor specific, since not all ASL software vendors have eliminated venous and CSF pulsation contamination. There were no completely discordant scores between the readers in the larger ASL cohort but there was a single completely discordant reading in the smaller DSC cohort. The significance of this small variation is questionable. Totals for all three observers showed complete concordance of scoring for the two techniques 67% of the time for ASL and 54% of the time for DSC in the synchronous cohorts. In the expanded ASL cohort this reached 70%. Complete or partial concordance was nearly universal with both techniques, with complete discordance never occurring with ASL, even in the expanded cohort, and occurring only 4% of the time with DSC.
Partial discordance did occur between our readers, for both ASL and DSC, when mild relative hyperperfusion was observed in the white matter. This typically occurred when relative perfusion was mildly increased in white matter regions that had been treated and was surrounded by white matter that was hypoperfused. This often led to interpretations that were intermediate or indeterminate. How we treated these intermediate values had the greatest impact on sensitivity. Since these patients had already received optimal treatment, false positive tumor recurrence interpretation could have a significant impact on quality of life. Additional surgery, chemotherapy and radiation all have substantial consequences for these patients, while delaying treatment until tumor recurrence is confirmed would have a lesser impact. Thus, we thought it justifiable to treat intermediate values as “test negative”, which sacrificed sensitivity. However, the outcome of such intermediate perfusion (mild hyperperfusion) was variable, sometimes representing residual tumor responding to treatment and other times representing early recurrence. This may be reflecting what is commonly observed in pathological specimens from treated glial tumors. A relatively high percentage of biopsy specimens yield tissue that contains both necrotic tissue and residual tumor. Thus imaging voxels might contain tissue both de-vascularized and re-vascularized by angioneogenisis. Whether the residual tumor will continue to grow or succumb to apoptosis might not be predictable at this intermediate stage. Our current clinical and radiographic decision on such imaging findings is to follow these cases on serial imaging. In our experience, some of these regions eventually resolved, while others grew or initially decreased in size but then grew at a later time. Given the latter, it seems important that any surgical biopsy should include the hyperperfusing tissue to avoid sampling errors.
Another source of variability for which we had discrepancies was combined areas of tumor and treatment changes with substantial nearby gray matter. Our ASL images offered some advantages in this regard, because our PACs system provided accurate cross-referencing for the ASL images, but not for the post processed DSC images.
Final considerations are the blinded retrospective design of our study and its limitation to a single institution. The blind re-evaluation of the imaging by independent observers can help decrease biases, but it cannot assure that all bias was avoided. The single academic institutional nature of the study cannot control for regional and referral biases in the original data set. The advantage however, is that standards for consistent interpretation were likely more readily established than might be possible for multiple centers.
Throughput
For our workflow, ASL sequences had no significant impact compared to DSC. The ASL imaging time was about 6 minutes, compared to a 1-2 minute time for DSC perfusion. There was, however, an additional small setup time penalty for DSC that averaged 1-2 minutes, as DSC requires some time for communication with the patient (via intercom) and the injector had to be armed. Post processing time for the different perfusion techniques was about the same.
Conclusions
ASL perfusion has promise as a reliable alternative to DSC in differentiating recurrent/persistent neoplasm from radiation necrosis and accurately predicts tumor progression. Both techniques have substantial accuracy, PPV, NPV and specificity. Sensitivity is sacrificed when indeterminate studies are treated as no tumor recurrence with either technique. This may be the best choice in patient management, since additional treatment carries substantial side effects and delaying treatment during follow-up produces little additional risk to the patients. We believe a controlled prospective study would be needed to establish optimal patient management schemes with both ASL and DSC as important additions to RANO criteria. Many factors will need to be addressed before quantitative evaluations could become meaningful.
References
-
Dooms GC, Hecht S, Brant-Zawadski M, Berthiaume Y, Norman D, et al. (1986) Brain radiation lesions: MR imaging. Radiology 158: 149-155.
-
Fiegler W, Langer M, Scheer M, Kazner E (1986) Reversible computed tomographic changes following brain tumor irradiation induced by the "early-delayed reaction" after radiation. Radiologe 26: 206-209.
-
Knudsen-Baas KM, Moen G, Fluge O, Storstein A (2013) Pseudoprogression in high-grade glioma. Acta Neurol Scand Suppl 31-37.
-
Siu A, Wind JJ, Iorgulescu JB, Chan TA, Yamada Y, et al. (2012) Radiation necrosis following treatment of high grade glioma-a review of the literature and current understanding. Acta Neurochir (Wien) 154: 191-201.
-
Payer F (2011) Pseudoprogression or pseudoresponse: a challenge for the diagnostic imaging in Glioblastoma multiforme. Wien Med Wochenschr 161: 13-19.
-
Fink J, Born D, Chamberlain MC (2011) Pseudoprogression: relevance with respect to treatment of high-grade gliomas. Curr Treat Options Oncol 12: 240-252.
-
Wen PY, Macdonald DR, Reardon DA, Cloughesy TF, Sorensen AG, et al. (2010) Updated response assessment criteria for high-grade gliomas: response assessment in neuro-oncology working group. J Clin Oncol 28: 1963-1972.
-
Gahramanov S, Raslan AM, Muldoon LL, Hamilton BE, Rooney WD, et al. (2011) Potential for differentiation of pseudoprogression from true tumor progression with dynamic susceptibility-weighted contrast-enhanced magnetic resonance imaging using ferumoxytol vs. gadoteridol: a pilot study. Int J Radiat Oncol Biol Phys 79: 514-523.
-
Vöglein J, Tüttenberg J, Weimer M, Gerigk L, Kauczor HU, et al. (2011) Treatment monitoring in gliomas: comparison of dynamic susceptibility-weighted contrast-enhanced and spectroscopic MRI techniques for identifying treatment failure. Invest Radiol 46: 390-400.
-
T Hirai, M Kitajima, H. Nakamura, Okuda T, Sasao A, et al. (2011) Quantitative blood flow measurements in gliomas using arterial spin-labeling at 3T: intermodality agreement and inter- and intraobserver reproducibility study. AJNR Am J Neuroradiol 32: 2073-2079.
-
Alsop D, Shankaranarayanan A (2010) Advances in non-contrast enhanced perfusion assessment. A GE Healthcare MR Publication, Spring 51-54.
- van Westen D, Petersen ET, Wirestam R, Siemund R, Bloch KM, et al. (2011) Correlation between arterial blood volume obtained by arterial spin labeling and cerebral blood volume in intracranial tumours. MAGMA 24: 211-223.
-
Lehmann P, Monet P, de Marco G, Saliou G, Perrin M, et al. (2010) A comparative study of perfusion measurement in brain tumours at 3 Tesla MR: arterial spin labeling versus dynamic susceptibility contrast-enhanced MRI. Eur Neurol 64: 21-26.
-
Ozsunar Y, Mullins ME, Kwong K, Hochberg FH, Ament C, et al. (2010) Glioma recurrence versus radiation necrosis?: a pilot comparison of arterial spin-labeled, dynamic susceptibility contrast enhanced MRI, and FDG-PET imaging. Acad Radiol 17: 282-290.
-
Warmuth C, Gunther M, Zimmer C (2003) Quantification of blood flow in brain tumors: comparison of arterial spin labeling and dynamic susceptibility-weighted contrast-enhanced MR imaging. Radiology 228: 523-532.
