Cerebral stroke is a worldwide concern, it's classified as the most second cause of death in 2008. In this year 5.7 million deaths and about nine million patients had cerebral strokes events with resultant variable degrees of disabilities. The primary goal in stroke management is to reach an early accurate diagnosis for the patients, which will affect the choice of the treatment lines among the newly developed programs and the end stage recovery. The DTI & DTT are MRI techniques used for the 3D virtual reconstruction of fibers tracts in the white matter. This study was done on 100 patients suffering from cerebral infarctions during the first week of the incidence after being evaluated clinically by the NIHSS at the time of admission and after 14th day or at the discharge time, then the radiological results and the clinical outcome were compared at the time of the discharge. The goal of the study to predict the integrity of the fiber tracts in the territory of the infarction by the DTI and MR tractography and the expected clinical outcome, the cortico-spinal tract was given special attention as it carries the motor fibers. This study concluded that this new modality is simple non- invasive with successful matching with the clinical results and outcome.
Diffusion tensor imaging DTI, MR tractography, Cerebral infarctions, Cerebral strokes
Cerebral stroke is a worldwide concern, it's classified as the most second cause of death in 2008. In this year 5.7 million deaths & about nine million patients had cerebral strokes events with resultant variable degrees of disabilities [1].
The primary goal in stroke management is to reach an early accurate diagnosis for the patients, which will affect the choice of the treatment lines among the newly developed programs and the end stage recovery [2].
The DTI & DT based tractography are new techniques depend on the directional movement of water which is determined by the brain micro-structures and imaged on the diffusion sensitive MRI to generate virtual, three dimensional representations of the white matter fiber tracts. The ability of the trace of the white matter pathway in non-invasive way is the reason why the tractography has generated much enthusiasm and high expectations [3].
The diffusion tensor is a mathematical description of the magnitude and directionality (anisotropy) of the movement of water molecules in a three-dimensional space. In the brain white matter, diffusion is directional (anisotropic) along the fibres because molecules move more easily parallel to tracts and are mostly hindered or restricted in their movement perpendicular to tracts. Therefore, the diffusion tensor gives two important pieces of information in each imaging voxel: the magnitude of diffusion anisotropy and the orientation of the maximum diffusion. Tractography algorithms use this information to track the whole white matter pathway by inferring the continuity of fibre paths from voxel to voxel in the brain [3]. This study is aiming to evaluate this new technique in ischemic cerebral strokes patients and its effectiveness in predicting the clinical outcome in such cases.
A hundred patients were recruited to this study, which was done in Kobbery El Kobba medical military compound. All patients were admitted to the neurological department complaining of ischemic cerebral strokes with variable degrees of neurological manifestations. The inclusion criterion was: Patient with symptoms or signs ischemic stroke proved by CT & conventional MRI. The exclusion criteria were: Previous history of stroke or brain injury and, or other neurologic disease. The patients were evaluated clinically by using the national institute of health stroke scale (NIHSS). The NIHSS was done for all patients at first day of admission either in the acute phase or early sub-acute phase (< 7 days after the onset of symptoms) also at the time of discharge or within the 14th day of admission. Then these patients were referred to the radio-diagnosis department for evaluation by MRI during first seven days of admission. The study was done using MRI whole-body scanner (Philips achievia 1.5 tesla, 16 multi-channel), sense-8 phased array head coil, Then the data is transferred to a workstation (Philips MR workspace release 2.6.3, veenplus) to reconstruct the neurological tracts by using the fiber tracking program. The diffusion tensor imaging (DTI) sequence consisted of single-shot spin echo-planar imaging with the following parameters: TR = 8830 ms, TE = 80 ms, Acquisition matrix 112 × 110 mm, Acquisition voxel = 2.00/2.03/2.00 mm, FOV: Right-left 224 mm, antro-posterior 224 mm, Feet-head 120 mm, Voxel size: Right-left 2 mm, Antro-posterior 2 mm, Slice thickness is 2 mm, Reconstruction voxel size 1.75 mm, gradient direction is 32, b-value 800 mm/s & number of Slices is 60. Total scan time 9:51 minutes. The DTIs were transferred to the workstation, where they were converted to colour coded map images, the region of interest (ROIs) drawing strategies was done according to the fiber assignment by continuous tracking method (the FACT method) described by Mori, et al. in 1999 [4]. In this method, multiple ROIs - at least two- are drown in a known anatomical points in the course of specific tract, it was applied for all cases by placing the ROIs in the anatomically known course of the aimed tract adjacent to the lesion and reconstruct its fibers and evaluate the relation and the effect of the ischemic stroke on its integrity. Our main concern in this study was the cortico-spinal tracts (CST) being the carrier of the motor fibers and considered the most valuable in the subacute stage [5] Figure 1, Figure 2, and Figure 3.
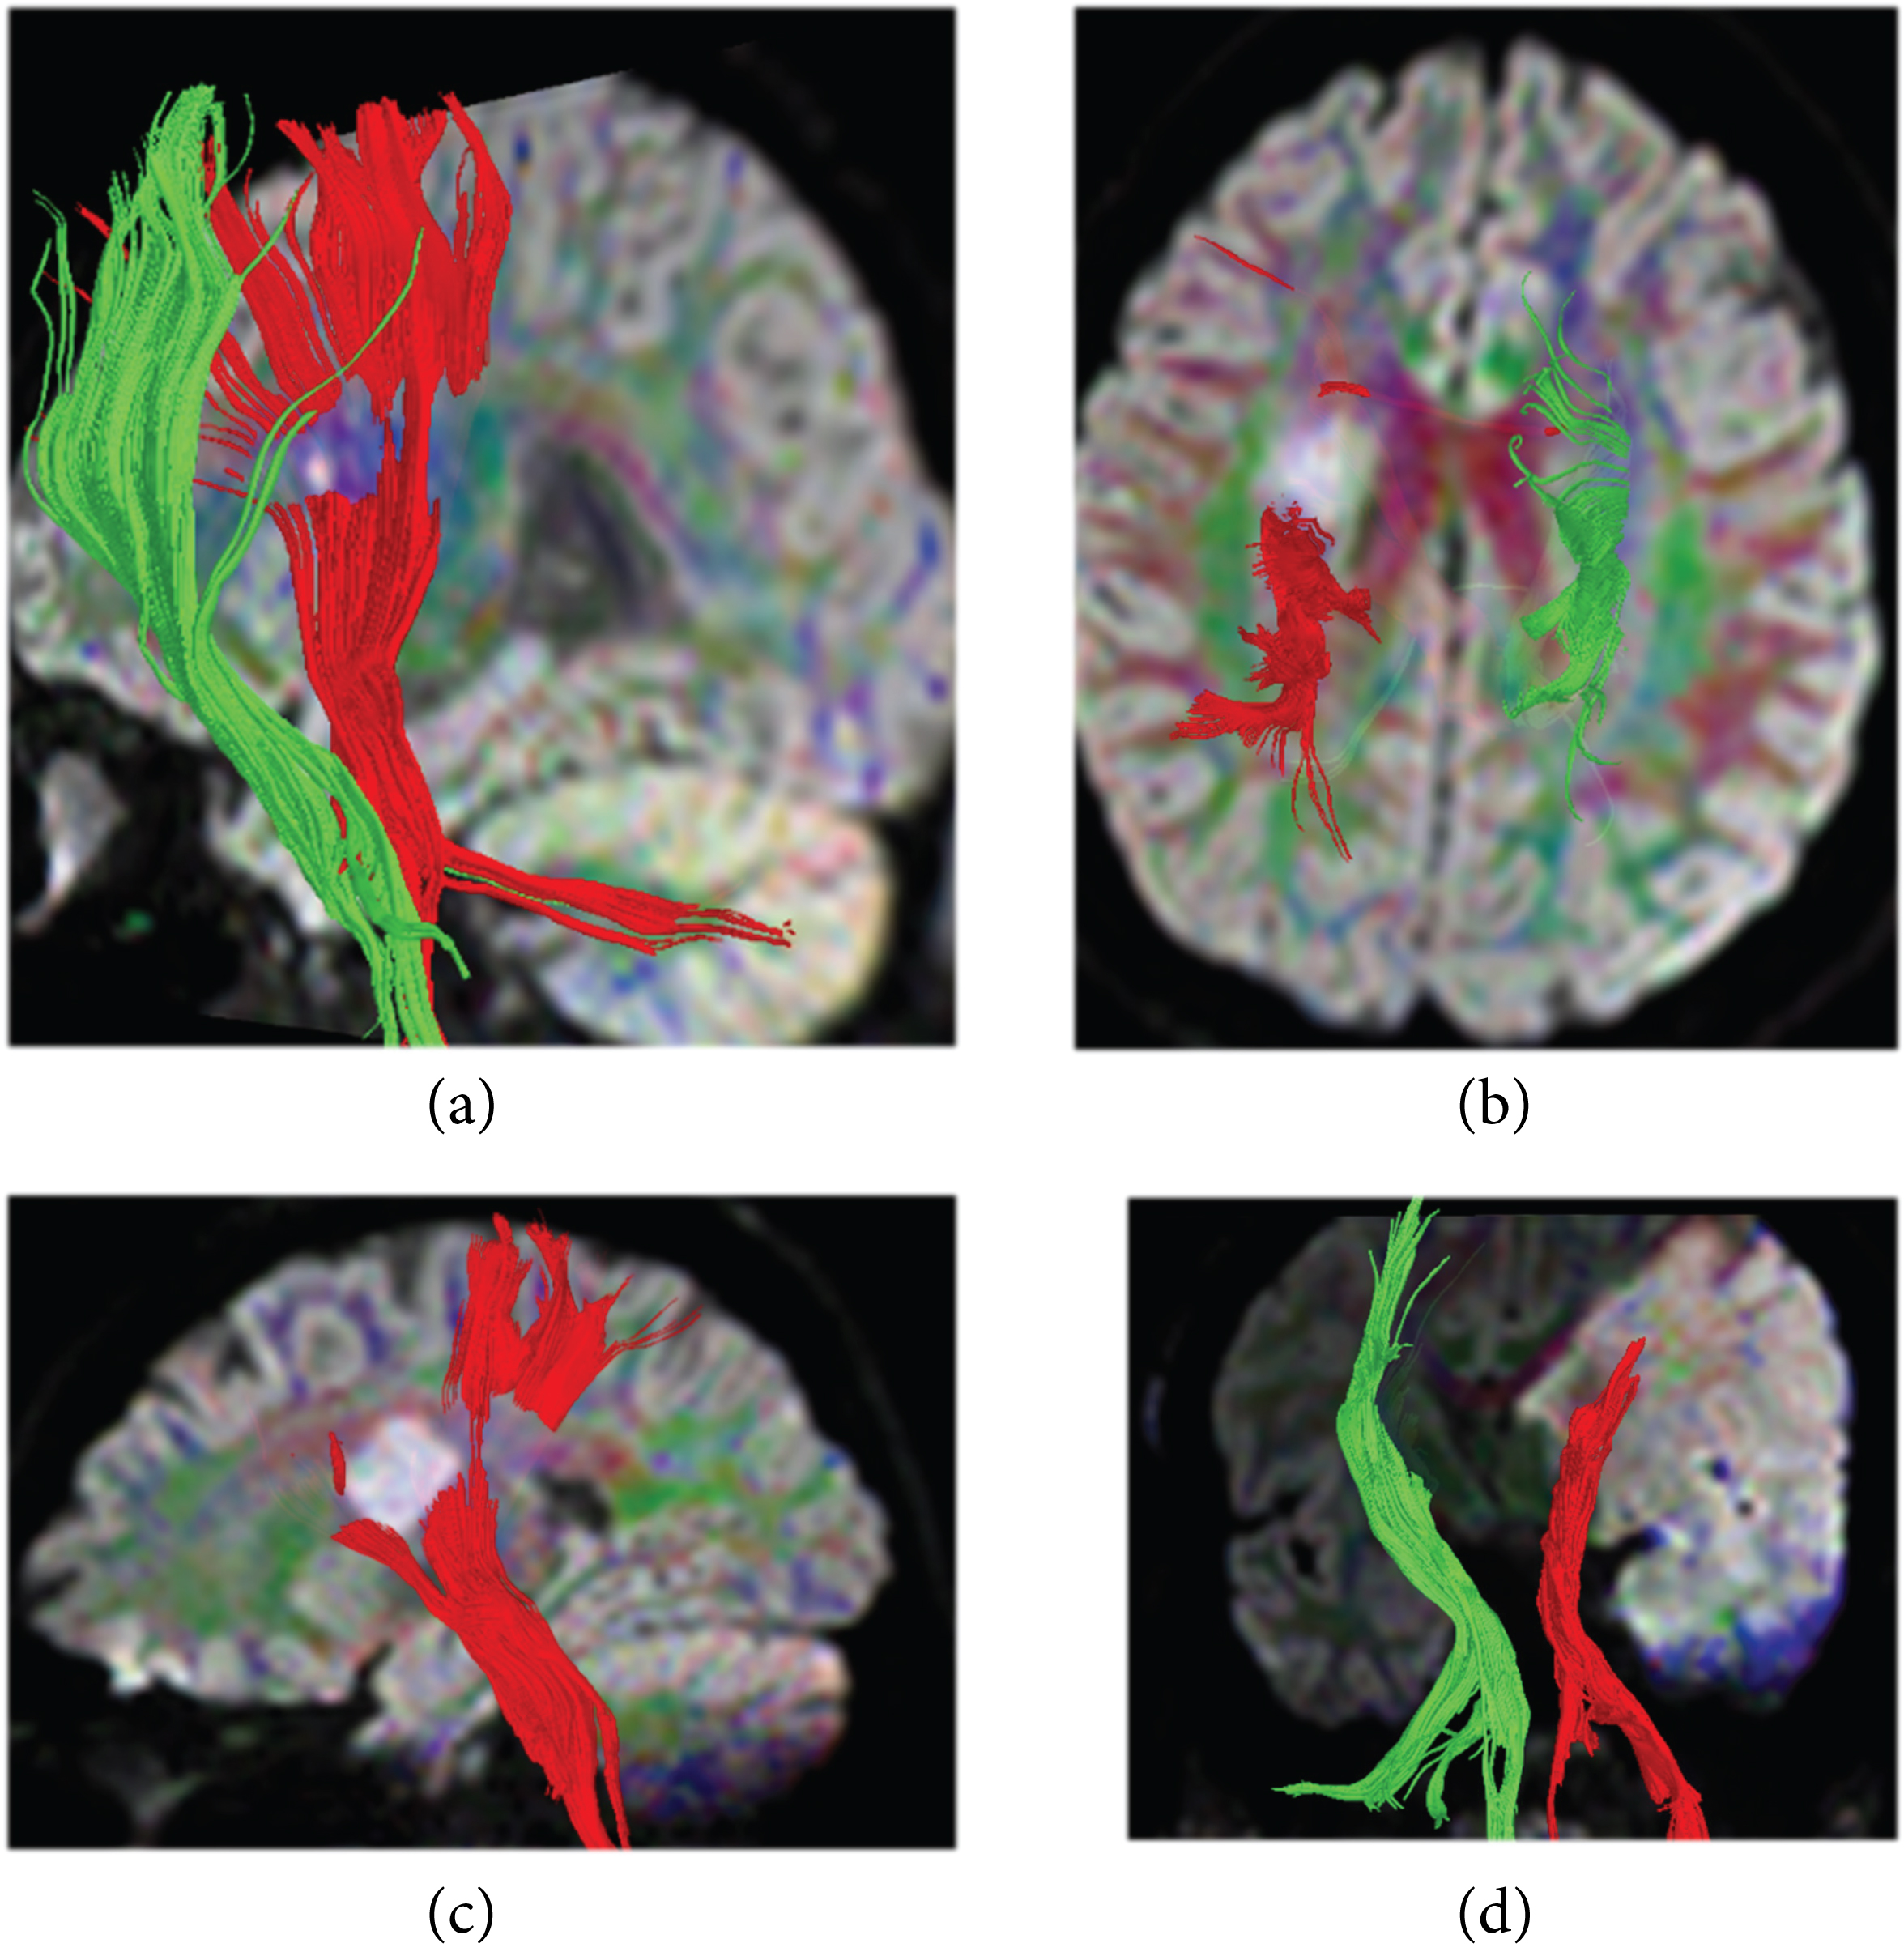 Figure 1: Four different cases showing the CST reconstruction superimposed on DWIs the tract on the affected side is given the red colour and on the healthy contralateral side is the green colour a) saggital oblique view on the affected side (red) is intact; b) axial view showing the tract is partially affected by the infarction; c) sagittal image showing the tract is partially affected d) the coronal view shows that the tract is completely damage.
View Figure 1
Figure 1: Four different cases showing the CST reconstruction superimposed on DWIs the tract on the affected side is given the red colour and on the healthy contralateral side is the green colour a) saggital oblique view on the affected side (red) is intact; b) axial view showing the tract is partially affected by the infarction; c) sagittal image showing the tract is partially affected d) the coronal view shows that the tract is completely damage.
View Figure 1
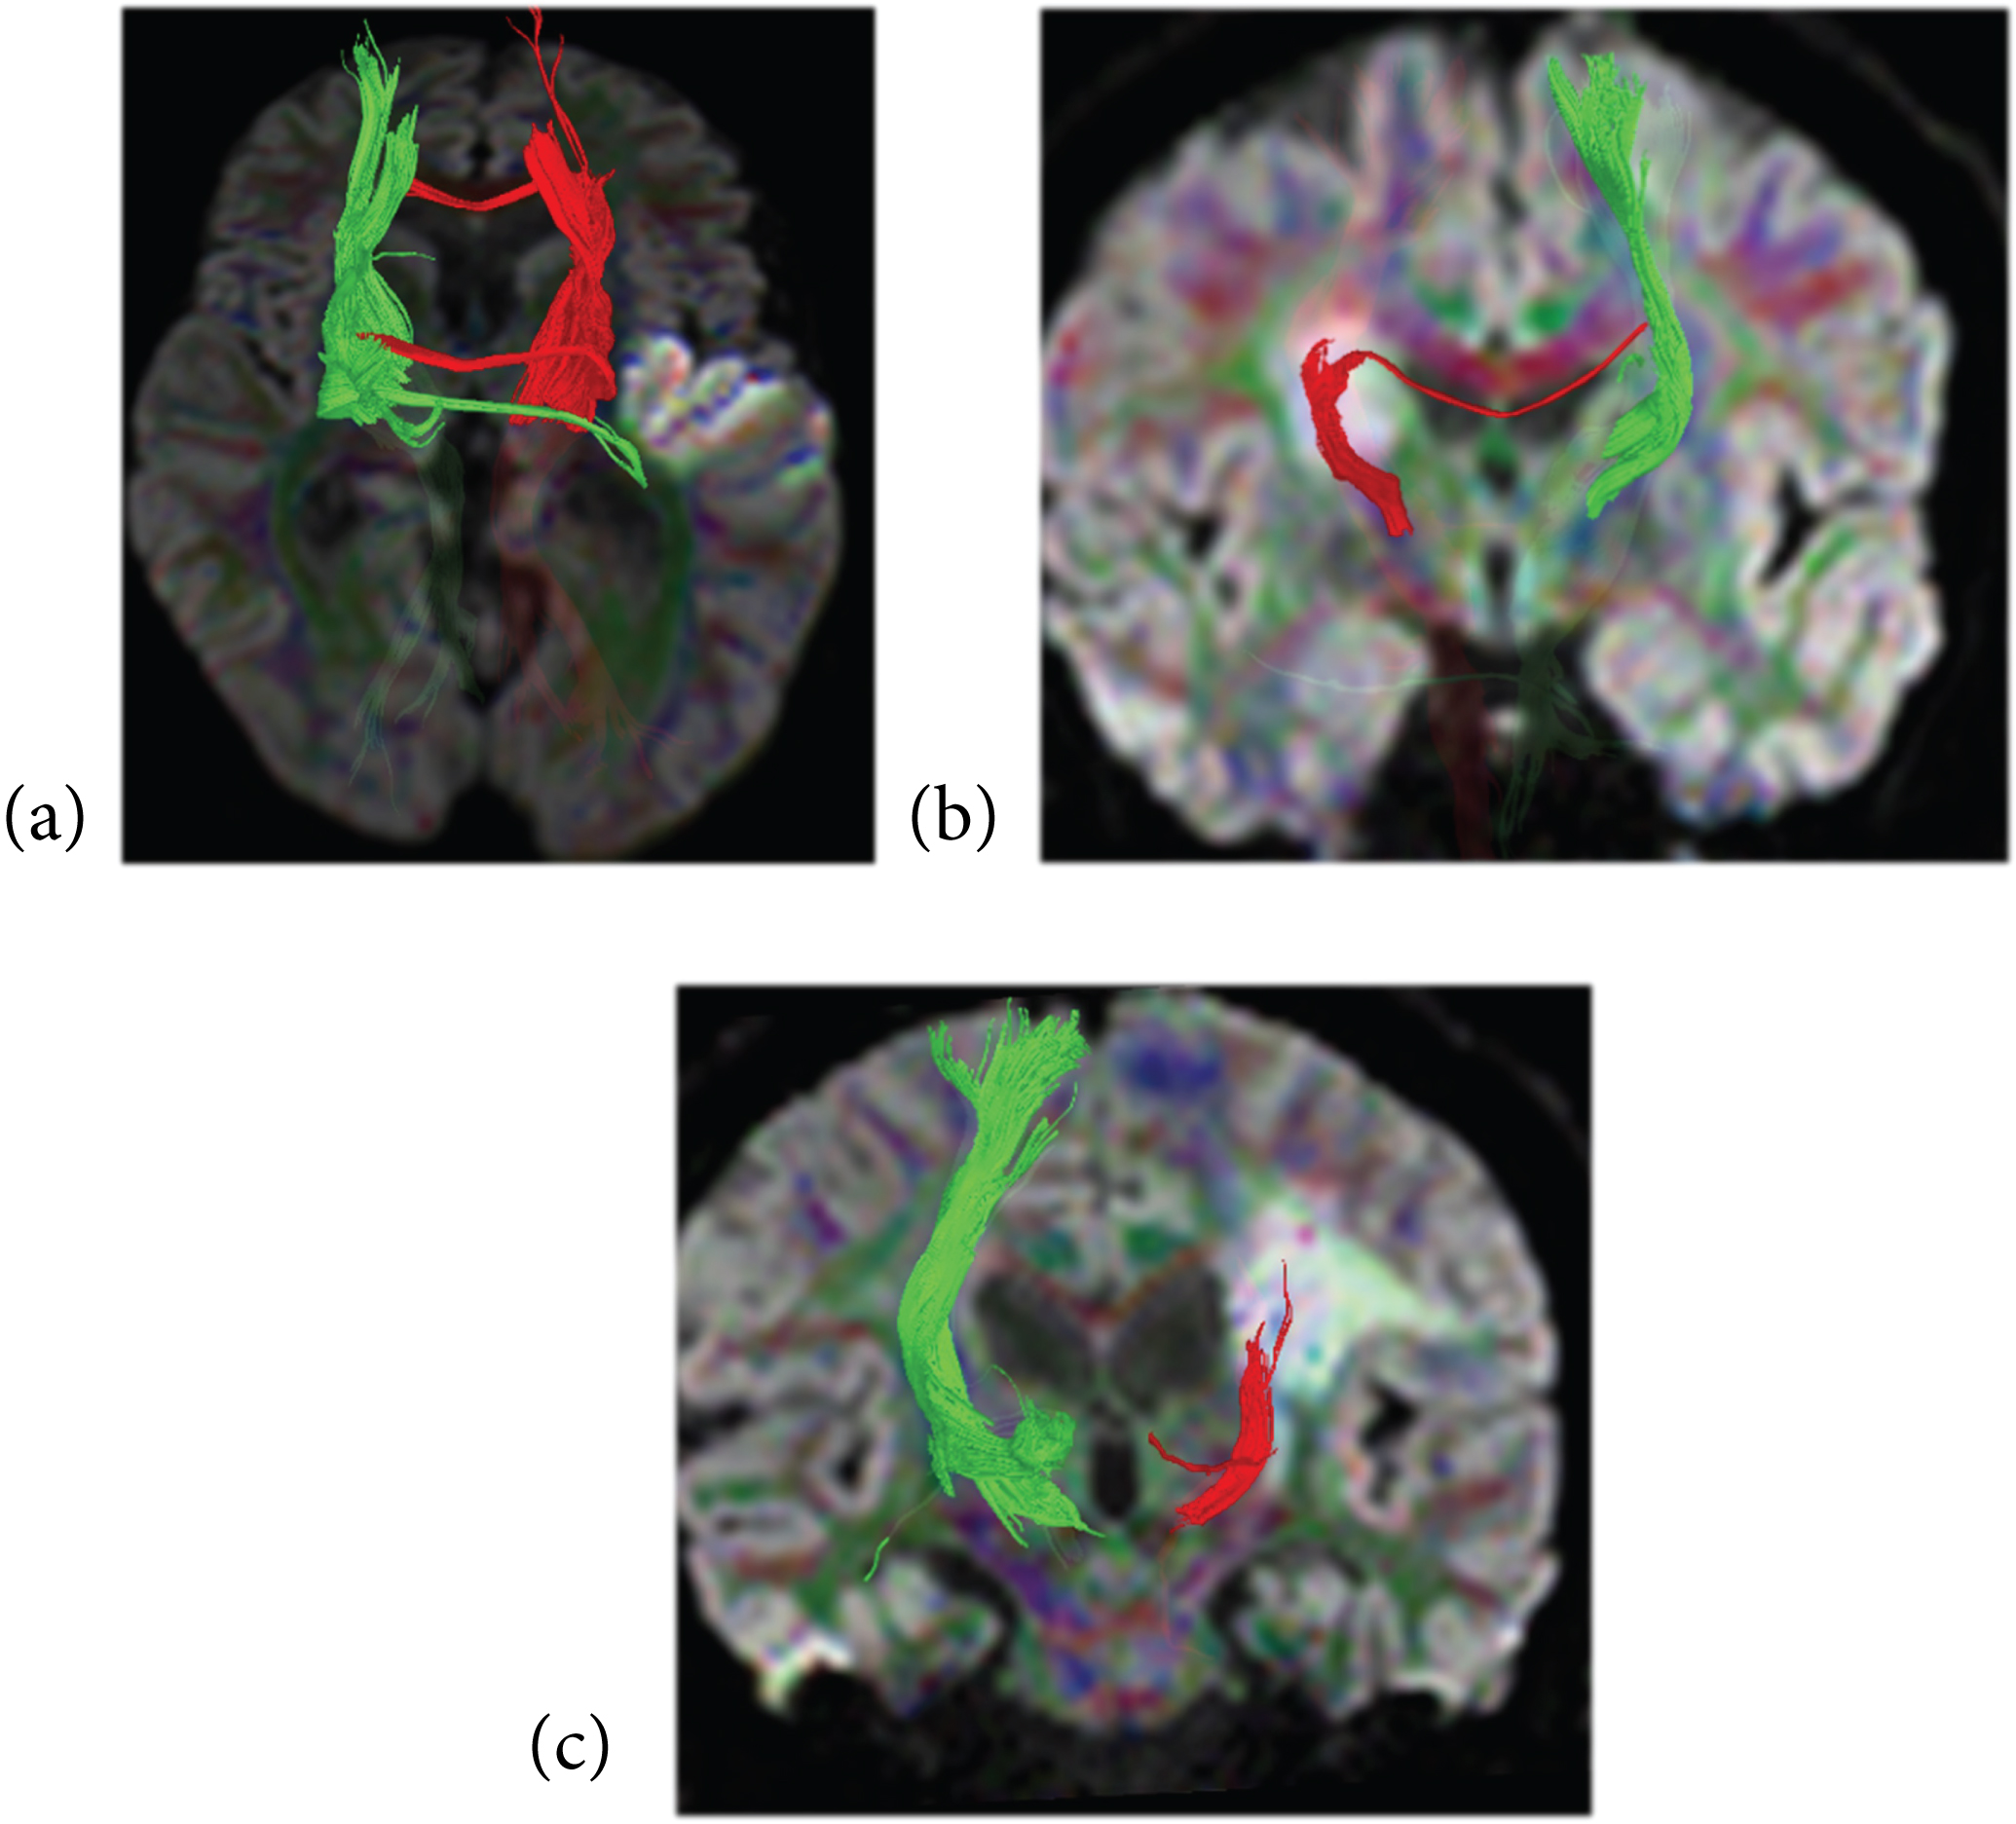 Figure 2: Three different cases suffering from subacute infarction with 3-D reconstruction of the thalamic radiation superimposed on DWIs, a) axial image showing intact tract in relation to the adjacent lesion; b) the tract is partially affected by the lesion; c) the tract is seen completely affected by the lesion.
View Figure 2
Figure 2: Three different cases suffering from subacute infarction with 3-D reconstruction of the thalamic radiation superimposed on DWIs, a) axial image showing intact tract in relation to the adjacent lesion; b) the tract is partially affected by the lesion; c) the tract is seen completely affected by the lesion.
View Figure 2
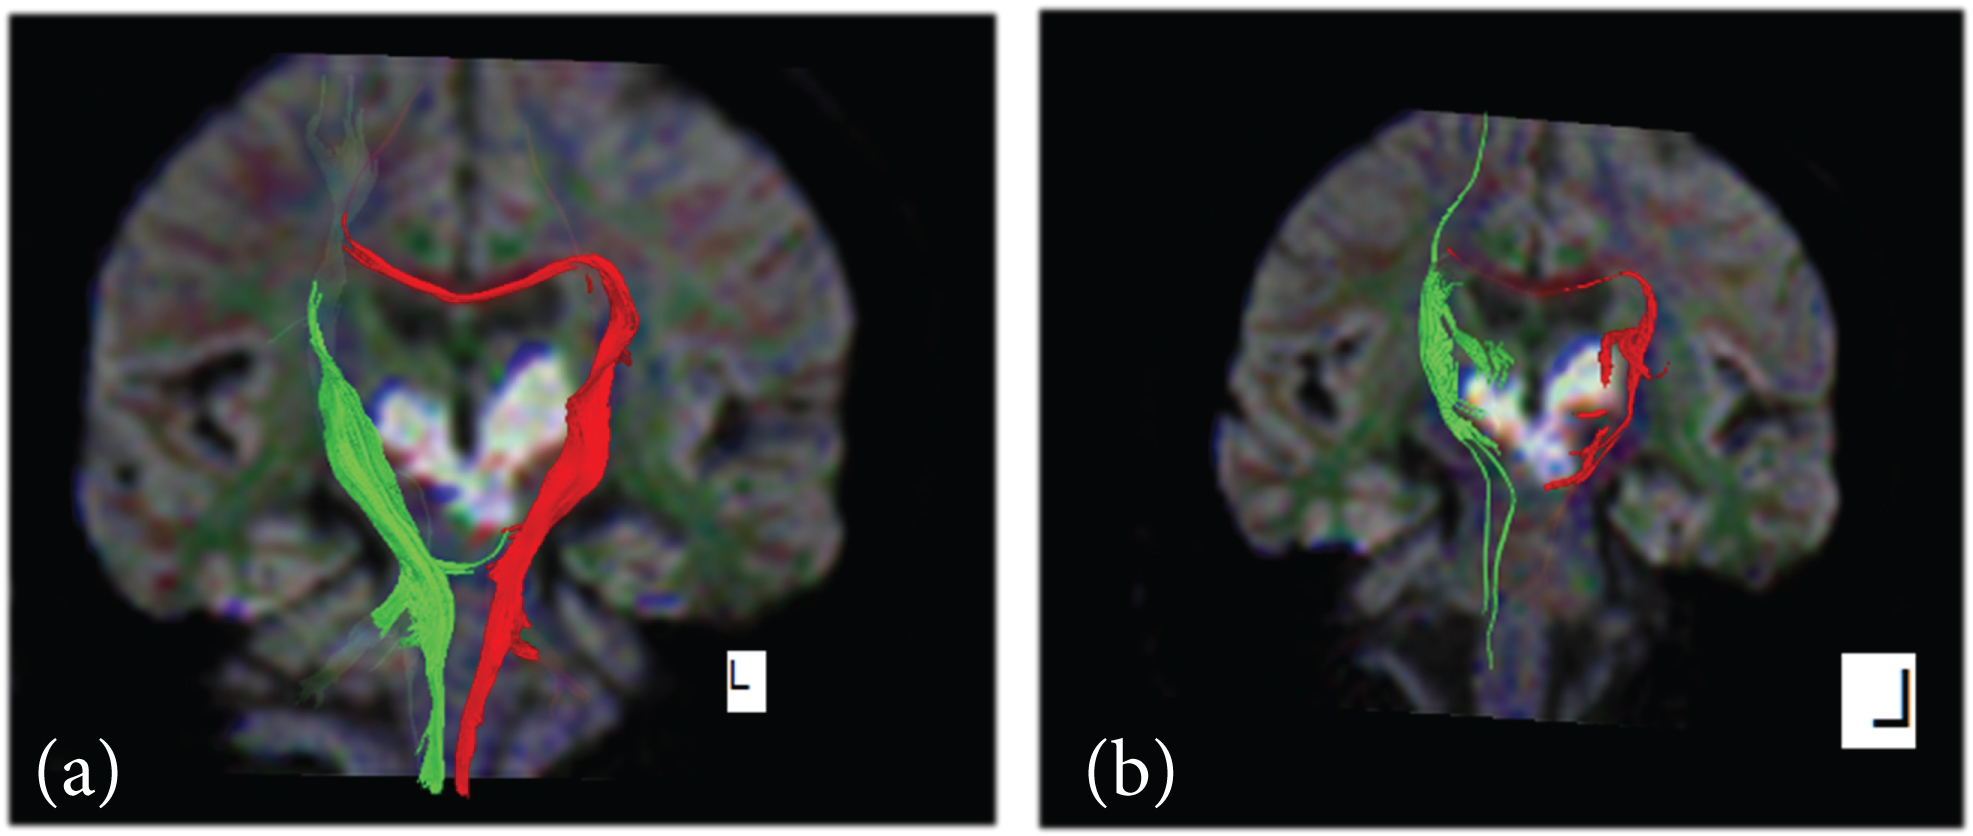 Figure 3: From the same case affected by bithalamic infarction a) is the 3-D reconstruction of the CST which is intact b) is the thalamic radiations on both sides appear affected.
View Figure 3
Figure 3: From the same case affected by bithalamic infarction a) is the 3-D reconstruction of the CST which is intact b) is the thalamic radiations on both sides appear affected.
View Figure 3
Other projection fibers like the thalamo-cortical connections which are known totally as the thalamic radiations as well as associations fibers like the inferior fronto-occipital & the inferior longitudinal fasciculus were also reconstructed (Figure 4). The stopping criterion includes the fractional anisotropy value (FA) below 0.3 & fiber tract reconstruction angle below 70 degree, sharp angles [6]. The evaluating factors depend on the FA ratio, (FAr = FA Affected Side/FA Unaffected Side). Another evaluation factor which is the fibers numbers ratio (FN affected side/FN healthy side) is also calculated. By using these two evaluating factors, the patients' tracts are then classified into three groups, group I includes the intact tracts, group II which include the partially injured (partial involvement) and group III which includes the totally disturbed tract (total involvement type). then correlation between the NHISS data on admission and discharge with the tract involvement as seen on the MR tractography images as well as with both FA & FN.
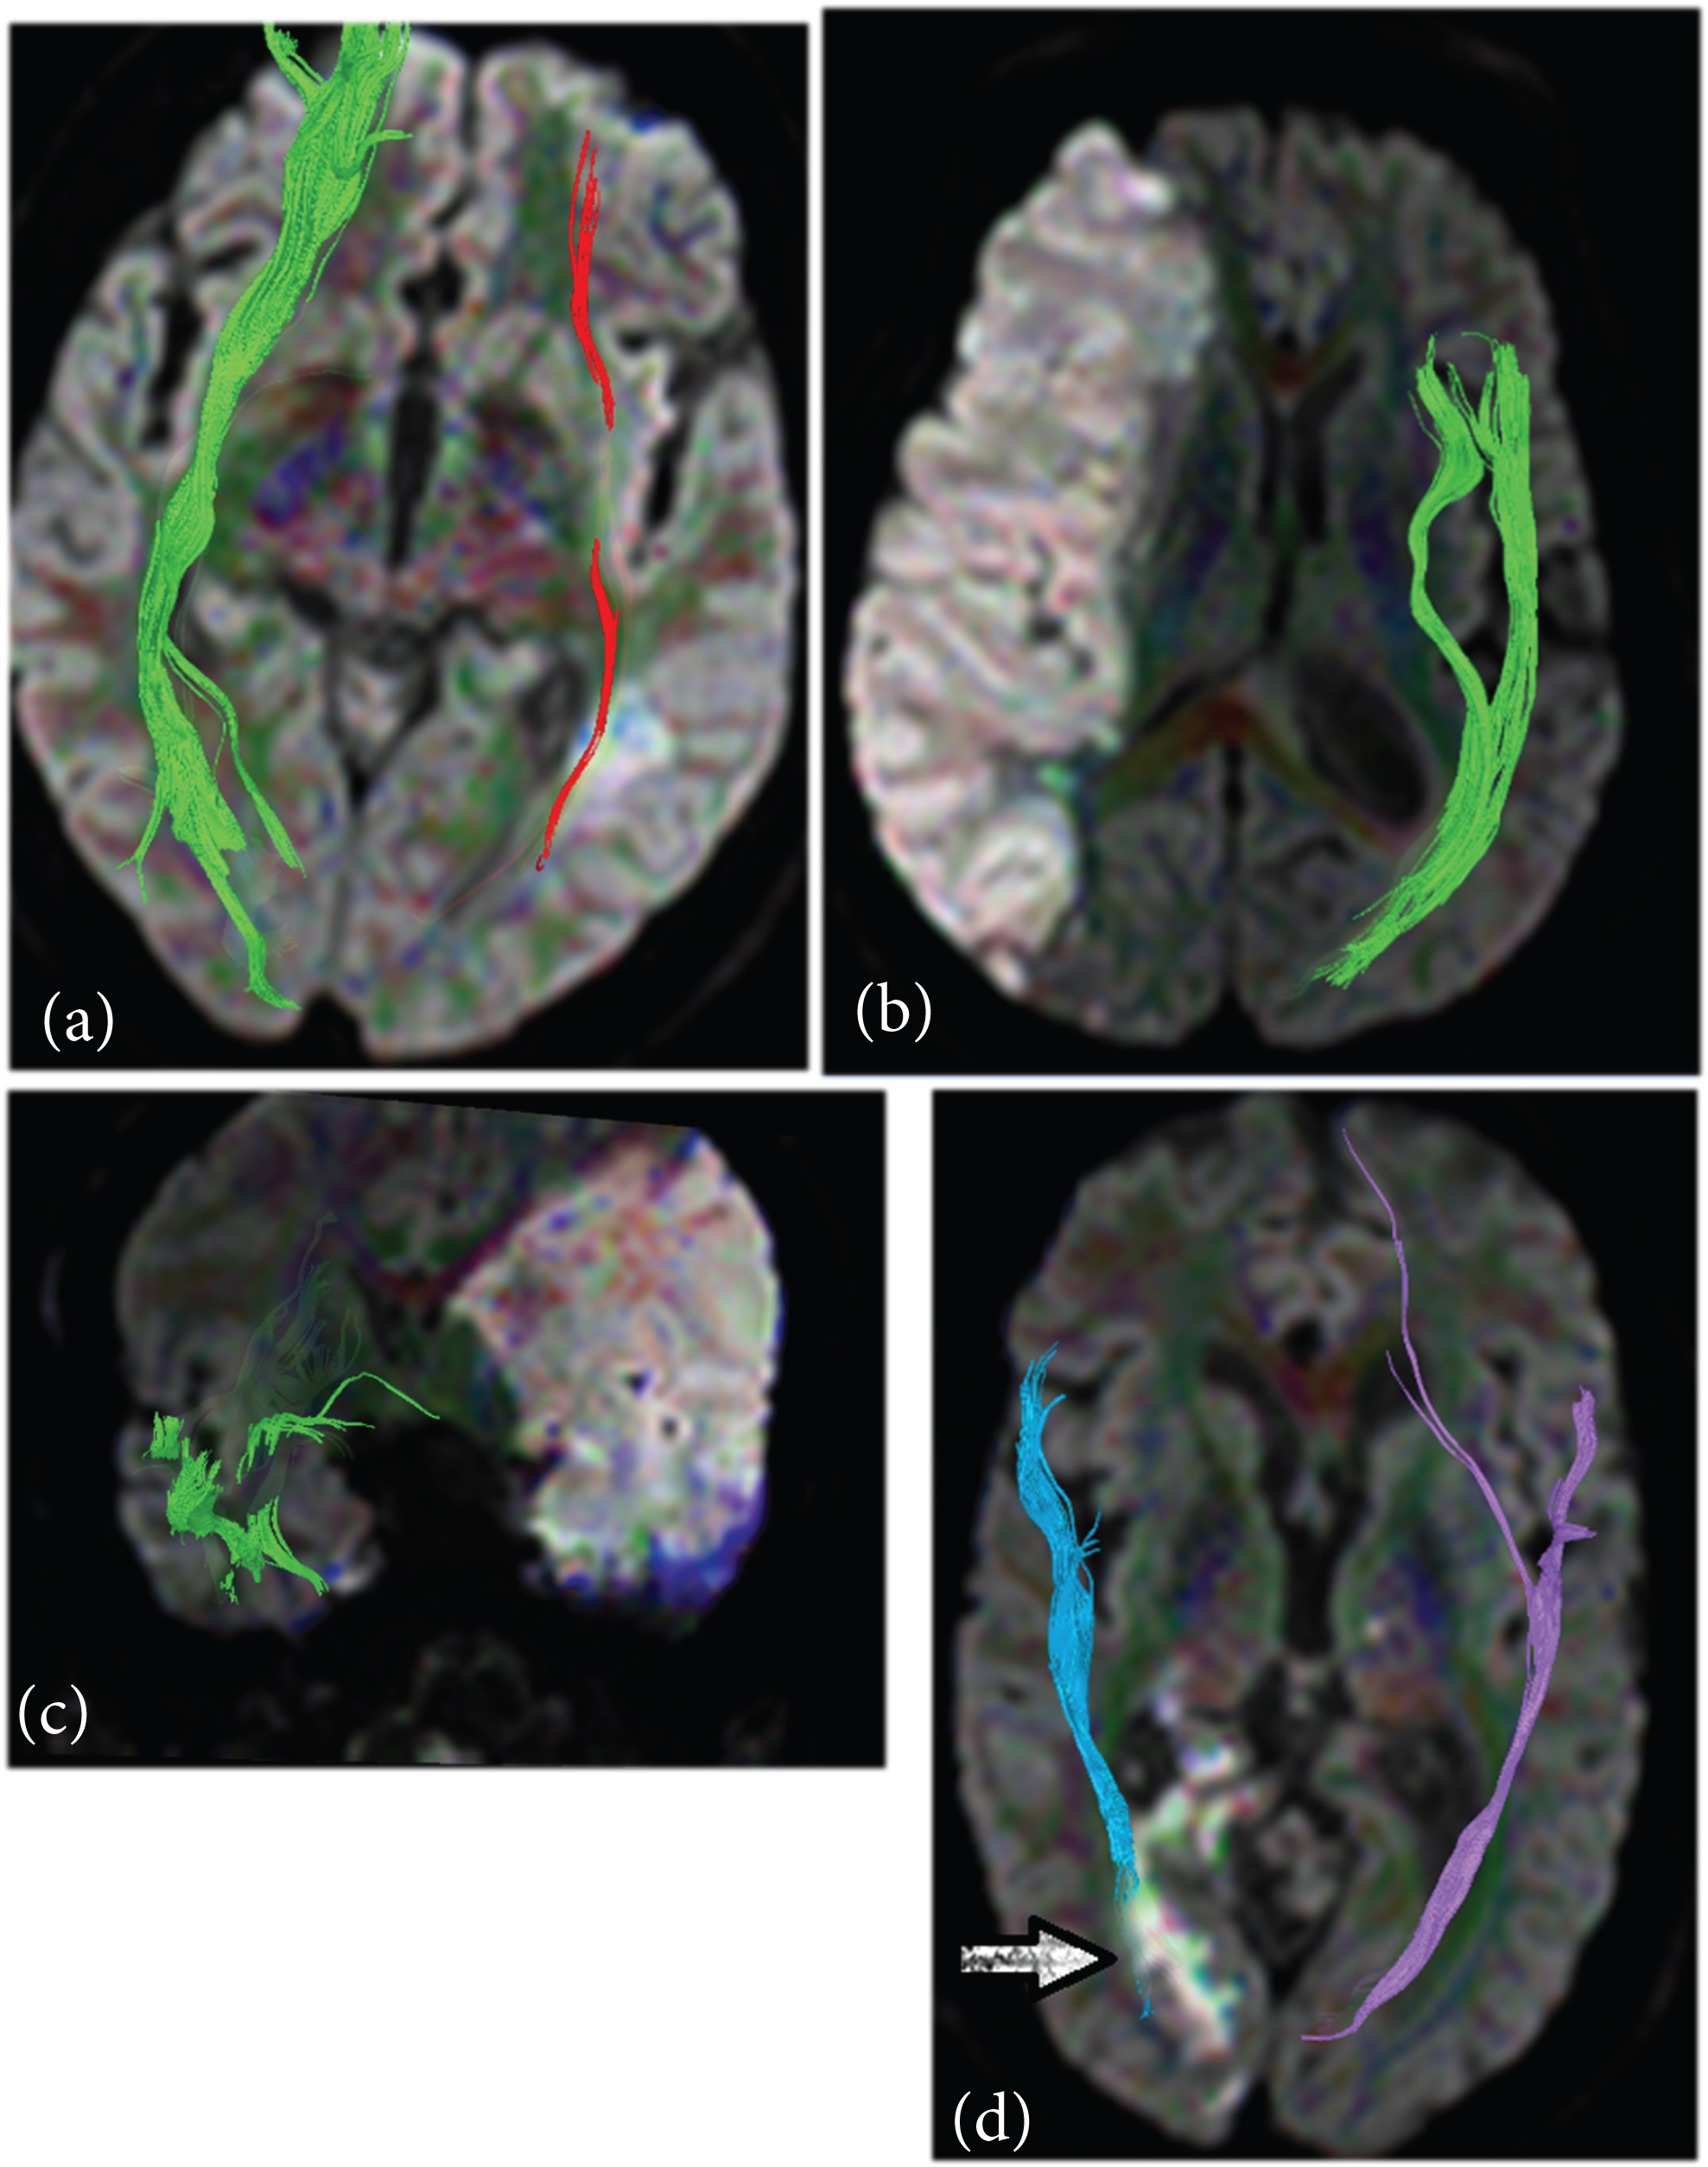 Figure 4: Four different cases of reconstruction of the association fibers superimposed on DWIs a) the inferiorocippito-frontal fasciculus is partially affected by the infarction on the ipsilateral side; b) the inferior longitudinal fasciculus is completely affected by the insult; c) both the inferior fronto-occipital & inferior longitudinal fascicului are affected by the infarction; d) the optic radiation carrying fibers is partially affected by the infraction.
View Figure 4
Figure 4: Four different cases of reconstruction of the association fibers superimposed on DWIs a) the inferiorocippito-frontal fasciculus is partially affected by the infarction on the ipsilateral side; b) the inferior longitudinal fasciculus is completely affected by the insult; c) both the inferior fronto-occipital & inferior longitudinal fascicului are affected by the infarction; d) the optic radiation carrying fibers is partially affected by the infraction.
View Figure 4
The reconstruction was successful in all patients, the cases was classified according to the FA & FN results, by the FA results the CST was divided into three groups, group I (n = 76) represent 76% of our cases, Group II (n = 8) represent 8% of the cases & group III (n = 16) represent 16% on the cases. The mean value of the FA in group I, on the affected side was 0.463 ± 0.053 & on the healthy contralateral side of the brain was 0.496 ± 0.051, (t-value = -3.901, p-value < 0.001). For group II, the mean value of the FA on the affected side was 0.355 ± 0.005 & on the healthy contralateral side of the brain was 0.475 ± 0.027, (t-value = -12.453, p-value < 0.001). And for group III the mean value of the FA on the affected side was 0.240 ± 0.047 & on the healthy contralateral side of the brain was 0.523 ± 0.082, (t-value = -11.996, p-value < 0.001) Figure 5.
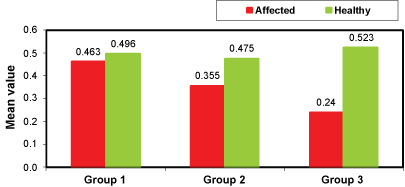 Figure 5: Graphic comparison between the mean value of the FA on the affected and the healthy contralateral side in the three different groups of the CST involvement.
View Figure 5
Figure 5: Graphic comparison between the mean value of the FA on the affected and the healthy contralateral side in the three different groups of the CST involvement.
View Figure 5
The FA ratio is sum of (FA affected side/FA healthy contralateral side), the more near the ratio to the 1, the healthier is the tract [7].
The mean value of the FA ratio among the different groups revealed, group I mean value 0.944 ± 0.055, (p-value < 0.01), for group II 0.735 ± 0.037, (p-value < 0.01) & for group III 0.340 ± 0.133, (p-value < 0.01).
The FNr (FN affected side/FN on the healthy side) in the group previously divided by the FA. In group I the mean value of the FN on the affected side 330.684 ± 176.22, and mean value on the healthy contralateral side of the brain measures 385.171 ± 256.78. (t-value = -1.525, p-value = 0.129, NS). In group II the mean value of the FN on the affected side 320.00 ± 106.904 & the mean value of the FN on the healthy contralateral side is 445.00 ± 112.25, (t-value = -2.381, p-value is 0.039) & in group III, the mean value of the FN on the affected side is 125.00 ± 137.889 & the mean value of the FN on the healthy contralateral side is 495.00 ± 492.423. (t-value = -2.894, p-value = 0.001) Figure 6.
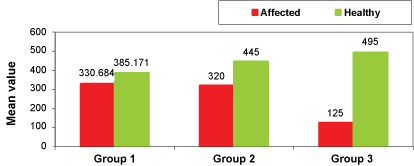 Figure 6: A graph displaying the mean values of the FN in the affected side (red) against the mean value of the healthy contralateral side (green) in the different groups of the CST involvement.
View Figure 6
Figure 6: A graph displaying the mean values of the FN in the affected side (red) against the mean value of the healthy contralateral side (green) in the different groups of the CST involvement.
View Figure 6
The comparison of the mean values of the FN ratio among the different studied groups revealed, in group I the mean value is 0.887 ± 0.124, in group II the mean value is 0.670 ± 0.032 & in group III the mean value is 0.253 ± 0.037, the p-value among the comparative groups is 0.001.
A comparative curve could be suggested for the comparison between the mean values of the FA ratio and the mean value of the FN ratio in the different groups of involvement of the CST at Figure 7.
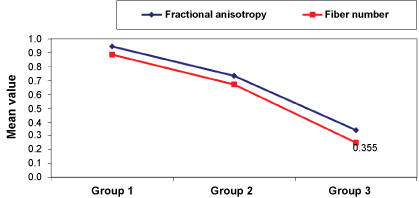 Figure 7: Shows a graphic comparison between the mean values of the FA ratio & the FN ratios in the different groups of the involvement of the CST.
View Figure 7
Figure 7: Shows a graphic comparison between the mean values of the FA ratio & the FN ratios in the different groups of the involvement of the CST.
View Figure 7
161 tracts were also reconstructed rather than the CST these tracts were divided into three groups (intact, partially affected & completely affected) according to their FA & FAr. The thalamic radiations (n = 22) 12 tract within group I, 6 tracts within group II & 4 tracts within group III. The inferior fronto-occipital fasciculus (n = 68), 24 tracts located within group I, 16 tracts within group II & 28 tracts within group III & the inferior longitudinal fasciculus (n = 72), 52 tracts within group I, 8 tracts within group II & 12 tracts within Group III.
The NIHSS was evaluated for every case at the time of the admission and the discharge or within 14th day of admission. The mean value of the NIHSS at the time of admission for the group I is 8.039 ± 5.707, and at the time of the discharge is 4.526 ± 5.407, (t-value = 19.397, p-value = 0.001). For group II the mean value of the NIHSS at the time of the admission is 17.50 ± 2.673, and at the time of the discharge is 11.00 ± 5.345, (t-value = 6.879, p-value = 0.001) & finally for group III the mean value of the NIHSS at the time of admission is discharge is 25.00 ± 2.633 and the mean time at the time of the discharge is 22.50 ± 5.190, (t-value = 3.873, p-value = 0.002) Figure 8.
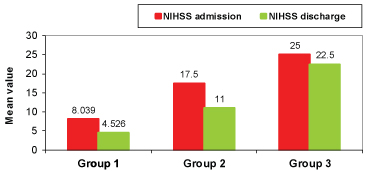 Figure 8: Comparison between mean values of NIHSS evaluated at the time of admission and discharge in different studied groups.
View Figure 8
Figure 8: Comparison between mean values of NIHSS evaluated at the time of admission and discharge in different studied groups.
View Figure 8
Maeda T, et al. 2005 [8], set a cut-off point at 0.8 FAr to define between the favourable and the unfavourable motor outcome, which also was proved clinically, as the group I shows lower NIHSS at the time of admission and discharge with the higher reduction 44% in the study time.
This study was conducted on 100 patients with their age group ranging from 49 to 77 years and the mean age 64.1 ± 6.77 years, male predominance 92%, It was done on wide range of infarctions as regard the size, starting from the small lacunar infarctions to the large infarctions involving large area of the cerebral cortex with more predominance on the right side, the parietal lobe and basal ganglia are the commonest locations. The time of the study was done during the first week of the insult mostly from the 3rd to 6th day of admission.
The DTI & DTT provide two parameters that could be used to evaluate favorable versus unfavorable outcome of the patients. These two parameters are the fractional anisotropy and the fibers number. Both are calculated at the affected side and at the same contra-lateral healthy side as control for the study.
The fractional anisotropy (FA) is a numerically calculated factor giving dependable quantitative parameter that we used for results assessment and guide for the prognostic expectations in this study. It was found that the FA becomes significantly lower in patients with unfavorable outcome. And by comparing with the FA on the healthy contra-lateral side, extracting a ratio (FA r), the larger FA asymmetry the more severe neurological deficits. (r FA = FA affected side/FA healthy side).
Second, there was a strong correlation not only for anatomic tracts involvement but also for fiber disruption to functional outcome. This could be evaluated by the fiber number which is automatically calculated by the reconstruction program, then the ratio could be calculated (FNr = FN affected side/FN healthy side), giving a qualitative parameter that helps in the assessment. So, we could say that tractography thus yields easily applicable prognostic criteria (within a reasonable time of acquisition) that would be unavailable when measuring isotropic diffusion alone.
In revision to the results of the CST reconstruction it revealed that the group I shows the highest FA mean values compared to the group II & group III parallel, the group I shows a lower NIHSS at the time of admission and highest improvement ratio at the time of the discharge (44%) compare to the other groups so, the DTI & DTT gave a good expectations for the patient clinical outcome.
The thalamic radiation is important projection fibers that was reconstructed 21 times in this study and divided into three groups according to the results of the FA & FAr. An interesting, rare case met us during the study (case 5 in figure 3) showing a patient with pontine and bithalamic infarction in the pontine artery territory, here, the lesion is bilaterally, both sides show reduced FA & FN. with no normal contralateral side to compare with their results, in the similar cases, the method of comparing the affected to the healthy fails, and it is hard to evaluate the patient. There was an obvious fallacy in evaluating the fibers numbers (FN) of these tracts, could be seen in cases no. 7, 9 & 12 being of higher values on the affected side than the healthy contralateral side with FNr up to 5 in some cases. The same results were noticed- at a narrow level- at the FN of the CST at group I and lead to the non-significance of the group. M Nelles, et al. & Parmer H, et al. [7,9] met the same problem with the FNr in 5 of his study patients.
Finally, we can summarize the results of our study & what we met during achieving it in points as follows:
• The DTI is a trustable technique that is similar in physical idea and diagnostic criteria to the DWI, yet it provides more per-voxel information that allows the whiter matter micro-structural & the virtual reconstruction of the fiber tracts.
• Reconstruction of the CST in the acute &subacute phases is a feasible technique that allows the direct visualization the relationship between that important tract and the site of the infarction as well as the degree of involvement and the expected motor prognostic outcome.
• The reconstruction of the association fibers in the acute stage was of little value, as their evaluation needs longer time of follow up & concentrated studies on each of them separately.
• The FA & the FA ratio are solid measurements tool which is more dependable than the fiber numbers and the fiber number ratio.
• The results of the FN and the FNr are more similar & parallel with the FA results in the projection tracts than the association tracts.
• The MR tractography carries a future hopes and promising technique for better understanding the anatomy of the brain tracts and the functions of each as well as opening a window to diagnose many non-understandable neurological and psychiatric symptoms.
The DTI and DT tractography provide feasible a non-invasive way to virtual reconstruction of the white matter tracts in a reasonable time of acquisition, offering the FA which is a trustful method for the evaluation of the white matter integrity, and of useful contribution in the evaluation of ischemic cerebral strokes patients.
Moreover, they open new era for a better knowledge for the brain anatomy and in the future, they may give answers to a lot of non-explained neurological and psychiatric diseases.