Computed Tomography (CT) has been widely used in radiological imaging diagnosis, but it generates higher doses in patients. The growing demand for tomography exams has generated concern in the scientific community in increasing the population dose generated by this technique. For this reason, it is important to know the dose distribution with a view to optimizing acquisition protocols. In this work, a standard head CT phantom made of PMMA with 16 cm in diameter was used coupled to cylindrical plates of PMMA in the test in a CT scanner GE, LightSpeed VCT model of 64-channel. A circular radiochromic film sheet was placed between the phantom and plates. A scout of the set formed by the head phantom and the plates was obtained to verify the position of the film sheet and to program the CT scan. Using an X-ray beam of 140 kV and 100 mA.s a distance of 10 cm in the central area of the set was scanned in helical mode, considering that the film sheet was placed in the central slice position. After the irradiation a digital image of film sheet was taken and worked using the image J software to obtain the dose variation in the central slice. Absorbed dose recorded by the film was in a range of 23.87 to 32.05 mGy. The dose profile shows that the higher dose occurs in the top and the lower in the central area.
Computed tomography, Radiochromic film, Dosimetry
Computed Tomography (CT) has been one of the most used exams for radiologic diagnostic in medicine. It is a very fast test that can be performed high quality images. However, the increasing demand for CT had a considerable impact on doses provided to patients and on the exposure of the population as whole, being a public health concern worldwide [1,2].
Many factors collaborated to the increased demand for CT scans, including the constant technological evolution of the equipment associated to greater availability and a relative tendency to decrease exam costs [3].
It is estimated that 25 to 33 people die from fatal cancers caused by ionizing radiation during this radiological examination process in every 100,000 examinations [4]. The dose evaluation in CT is one of many steps that may contribute to reducing patient doses and the use of phantoms allow to test different acquisition protocols and observe the absorbed doses and the image quality according to the anatomical patient characteristics [5,6].
The phantoms are used in CT scans for image quality control, calibration, and dosimetry. The CT absorbed dose in patient uses the volumetric Computed Tomography Dose Index (CTDIvol) as a reference. This index is used as a dose reference in each CT scan [7]. To test new acquisition protocols to reduce dose in patients, this is the parameter to compare different protocols used to produce imagens with the same diagnostic objective.
Radiochromic films can detect ionizing radiation coming from different directions and thus obtain maps of absorbed dose profiles in a proportional response to their darkening. Diagnostic radiochromic films allow record doses in milli-gray range using X-ray beams generate in kV. These films have high spatial resolution and a low energy dependence [6,7].
The objective of this work is to record the dose profile distribution in the central slice of the CT head phantom using radiochromic film exposed to an X-ray beam generated with 140 kV.
The experiment was conducted using a GE CT scanner, LightSpeed VCT model with 64 channels. The experimental measures have been obtained using the standard CT head phantom made in polymethylmethacrylate (PMMA). The standard adult head phantom is a cylinder with 16 cm in diameter and 15 cm in length. This phantom is considered the standard for the dose reference in head CT scans. A complementary cylinder with 16 cm in diameter and 5 cm in length was used to increase the phantom length to 20 cm. The Figure 1 shows the image the head phantom associated with the complementary cylinder in the isocenter of the CT scanner gantry.
 Figure 1: CT head phantom with extension placed in the gantry.
View Figure 1
Figure 1: CT head phantom with extension placed in the gantry.
View Figure 1
These cylindrical phantoms have five openings for positioning the dosimeters, one central and four at the peripheral openings, which are displaced from each other by 90°. The openings are 1.25 cm in diameter and 15 cm in length. The center of the peripheral openings is 1 cm from the edge of the phantom. The Figure 2 shows an illustration with the measurements of the head standard phantom made of PMMA.
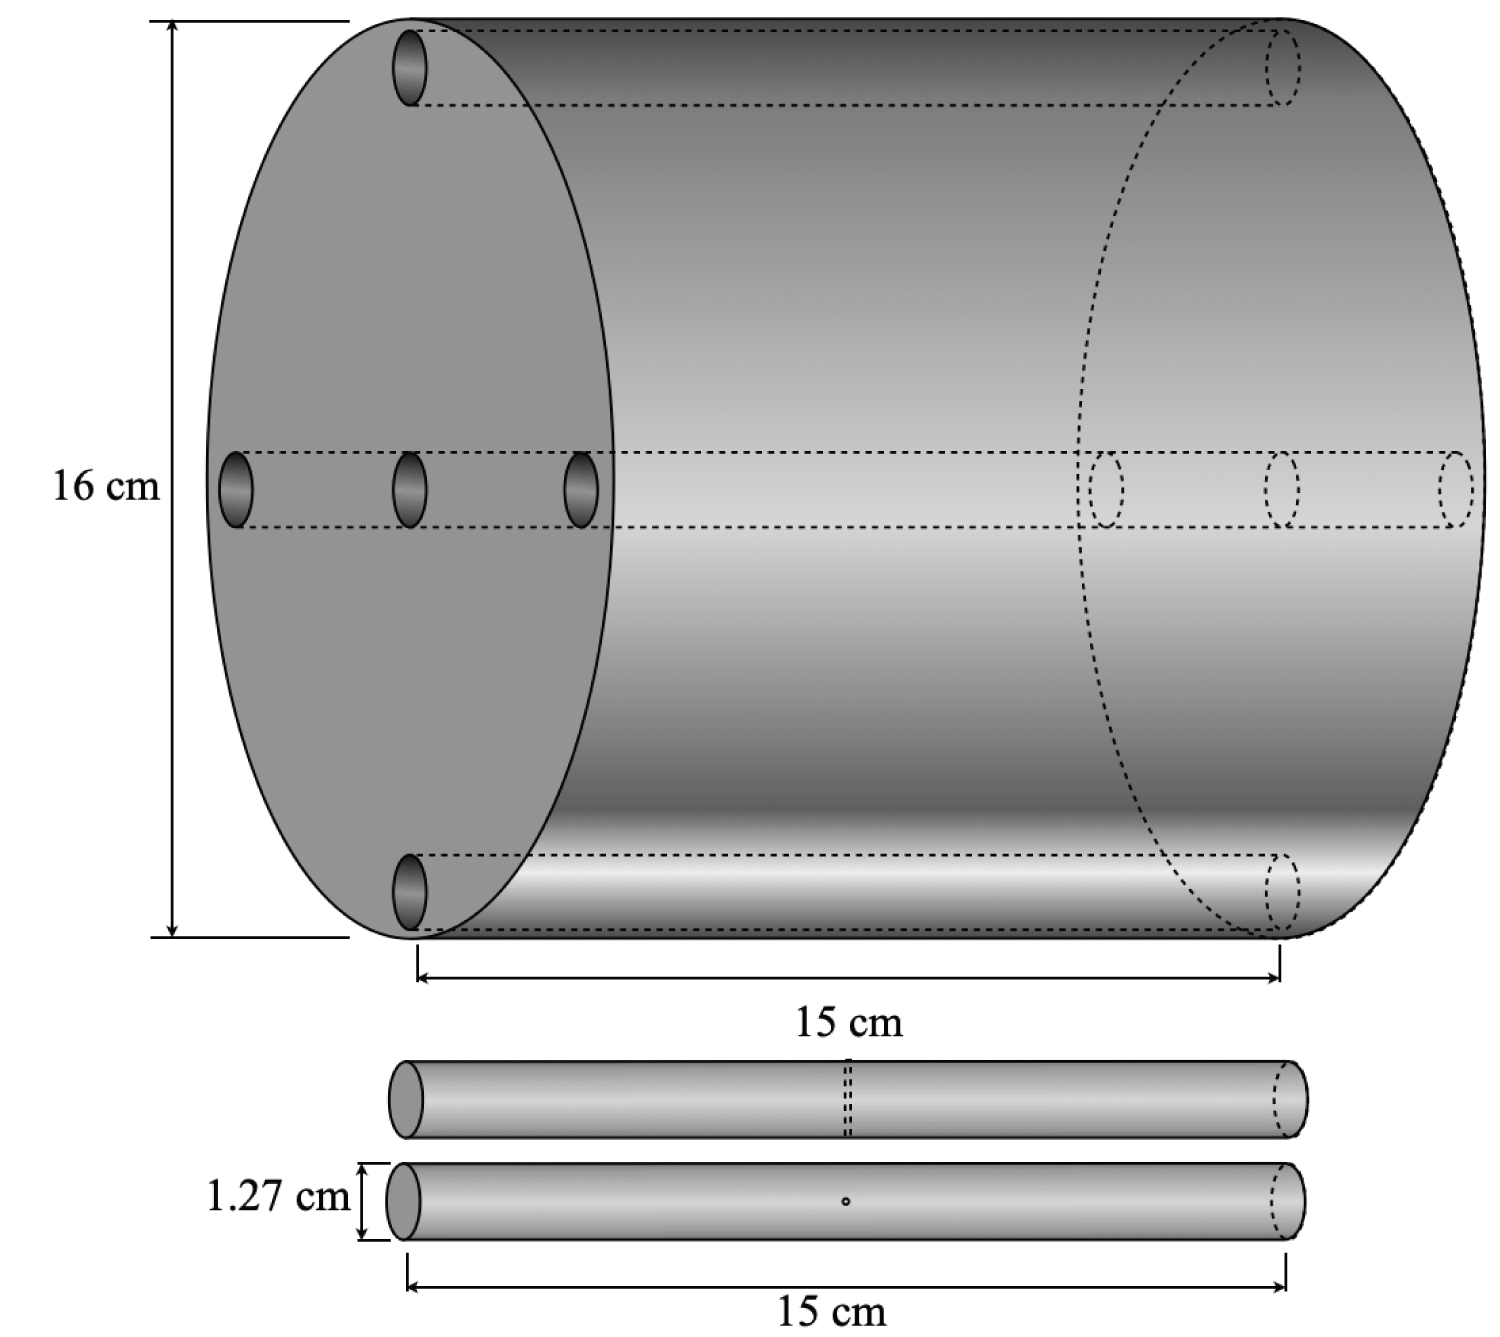 Figure 2: Adult standard head phantom dimensions.
View Figure 2
Figure 2: Adult standard head phantom dimensions.
View Figure 2
A radiochromic film sheet was cut in a circular shape with 16 cm in diameter. This film sheet was placed between the standard head phantom and the complementary cylinder. The set of cylinders charged with the film sheet was place in the gantry isocenter and 10 cm was scanned in helical mode with the film sheet in the middle of this scanned area, in the position of the central slice of the irradiated area. The phantom scan used an acquisition protocol with parameters showed in the Table 1.
Table 1: Acquisition protocol of CT scan. View Table 1
The record of the dose profile has been performed using the radiochromic film model GAFCHROMIC® XR-QA2, manufactured by ASHLAND, which is specific for diagnostic radiology. This film has high sensitivity to ionizing radiation with doses in the range of 1.0 to 200 mGy and can be used in X-ray beams generated by voltages of 20 to 200 kV. Therefore, it can be used to observe dose deposition in CT experiments.
Radiochromic films used in dosimetry are not sensitive to visible light. This feature facilitates the work of analyzing data collected after irradiation and provides greater spatial resolution in the sub millimeter range. Figure 3 shows two radiochromic film strips, one not irradiated (a) and another irradiated (b). The processing of their images has been used extensively to measure absorbed doses in patients [8-11].
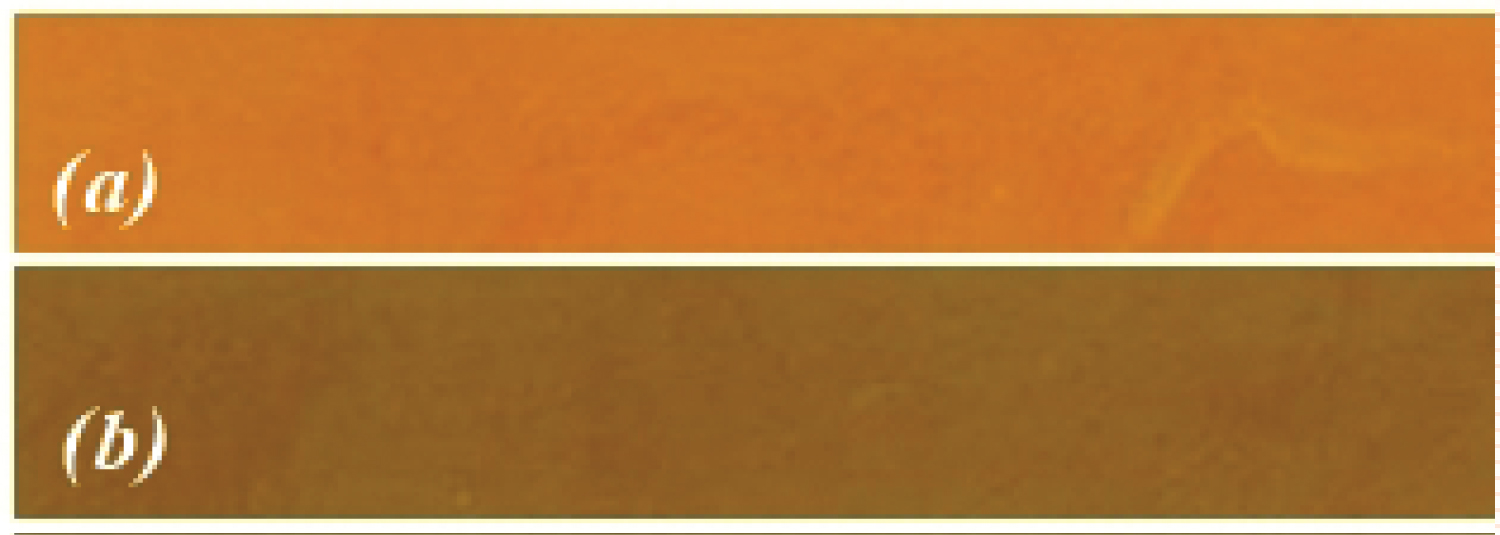 Figure 3: Radiochromic film strips: Not exposed (a) and exposed (b).
View Figure 3
Figure 3: Radiochromic film strips: Not exposed (a) and exposed (b).
View Figure 3
Metrological reliability of the radiochromic films was demonstrated through homogeneity and repeatability tests and by calibrating it in a reference radiation for CT that were reproduced in the Calibration Laboratory of the Development Center of Nuclear Technology (CDTN/CNEN) [12-14].
Digital images in extension .tiff and 300 dpi of the film sheet were obtained in a HP Photosmart C4480 reflective type scanner, before and after its irradiation. These images were worked using the software Image J. The red channel of the color image has a main absorption peak in the red region of the visible spectrum (636 nm) and was used to observe the variations in grey scale recorded in the film [15-18]. The Figure 4 shows the images of the film sheet in color and after the process of split channel in grey scale of the red channel.
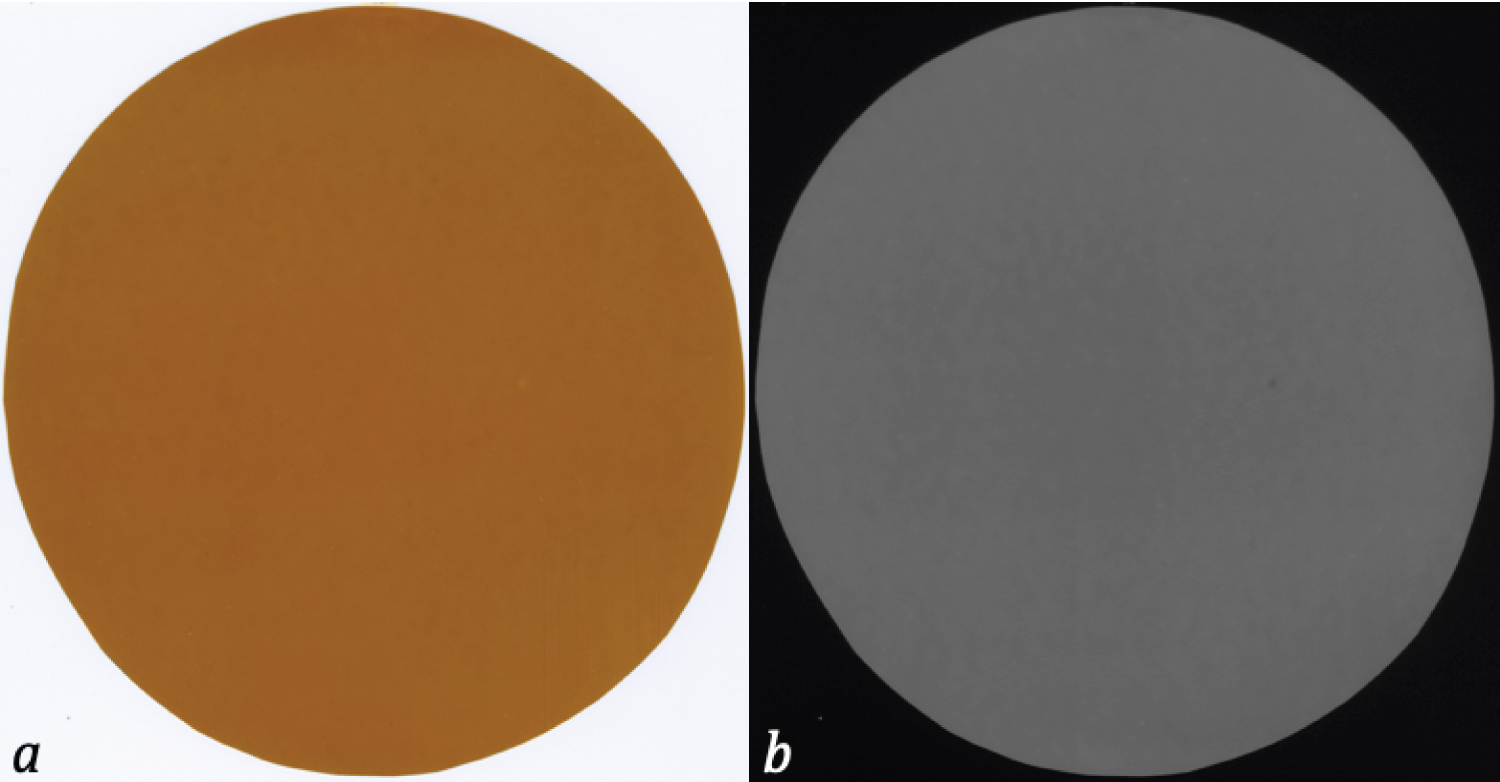 Figure 4: Circular radiochromic film sheet: (a) Color sheet and (b) Processed image.
View Figure 4
Figure 4: Circular radiochromic film sheet: (a) Color sheet and (b) Processed image.
View Figure 4
In Figure 5 shows the axial image of the central slice of the CT head where the openings 3, 6, 9, 12 and central are used to record doses using a pencil ionization chamber. From the recorded dose with the chamber, it is obtained the value of the volumetric Computed Tomography Dose Index (CTDIvol). To test new acquisition protocols to reduce dose in patients, this is the parameter to compare different protocols used to produce imagens with the same diagnostic objective. In this figure, the X and Y axes are marked where the dose profile was recorded and using the data from the radiochromic film, the CTDIvol was obtained using the film data of the opening positions.
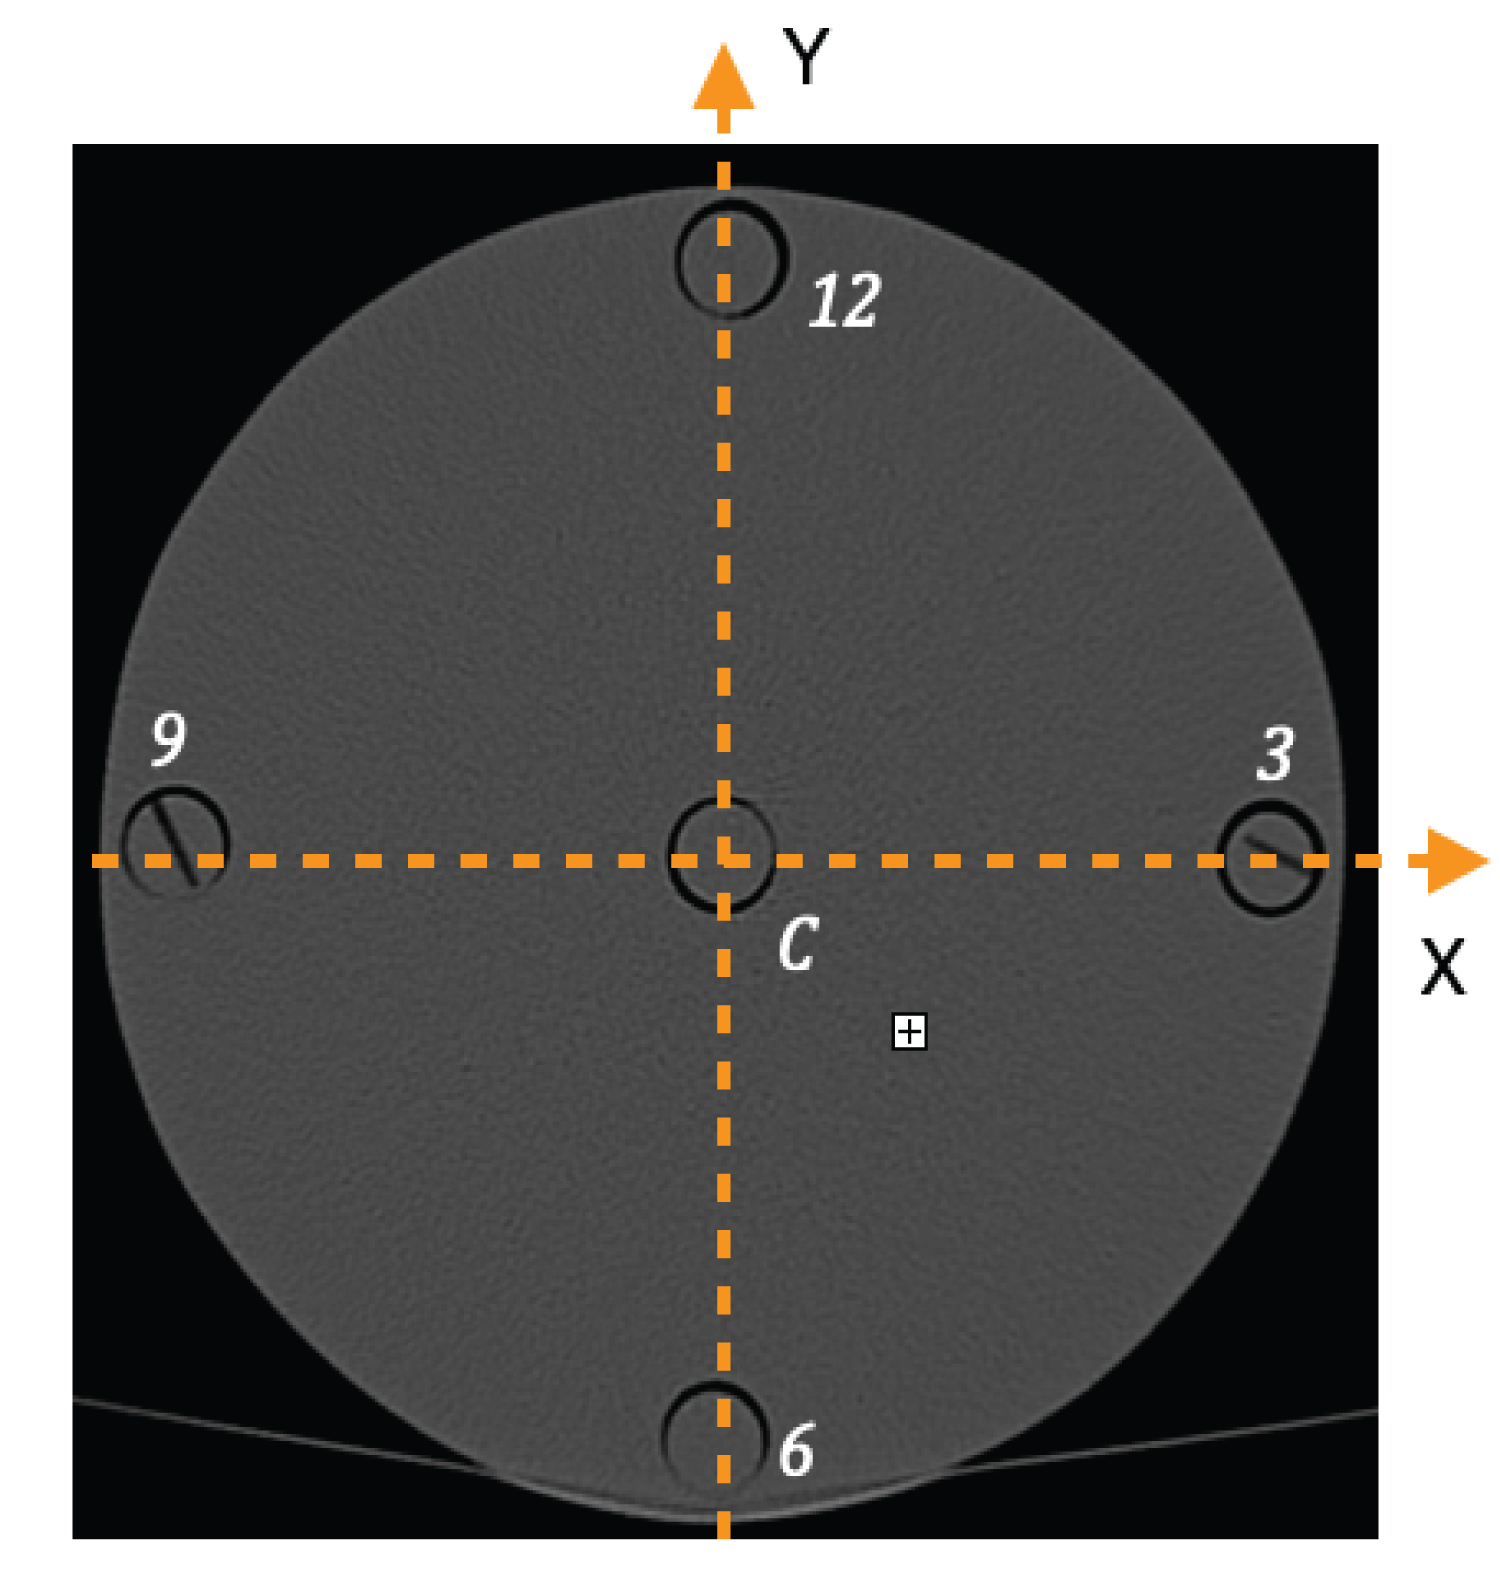 Figure 5: Axis positions.
View Figure 5
Figure 5: Axis positions.
View Figure 5
The Figure 6 presents the axial image of the central slice of the CT head (a) and the absorbed dose variation in color scale in the radiochromic film after processed (b). The dose profile shows doses in the peripheral areas were higher than in central area. The higher dose occurs in the top and lowers in the center.
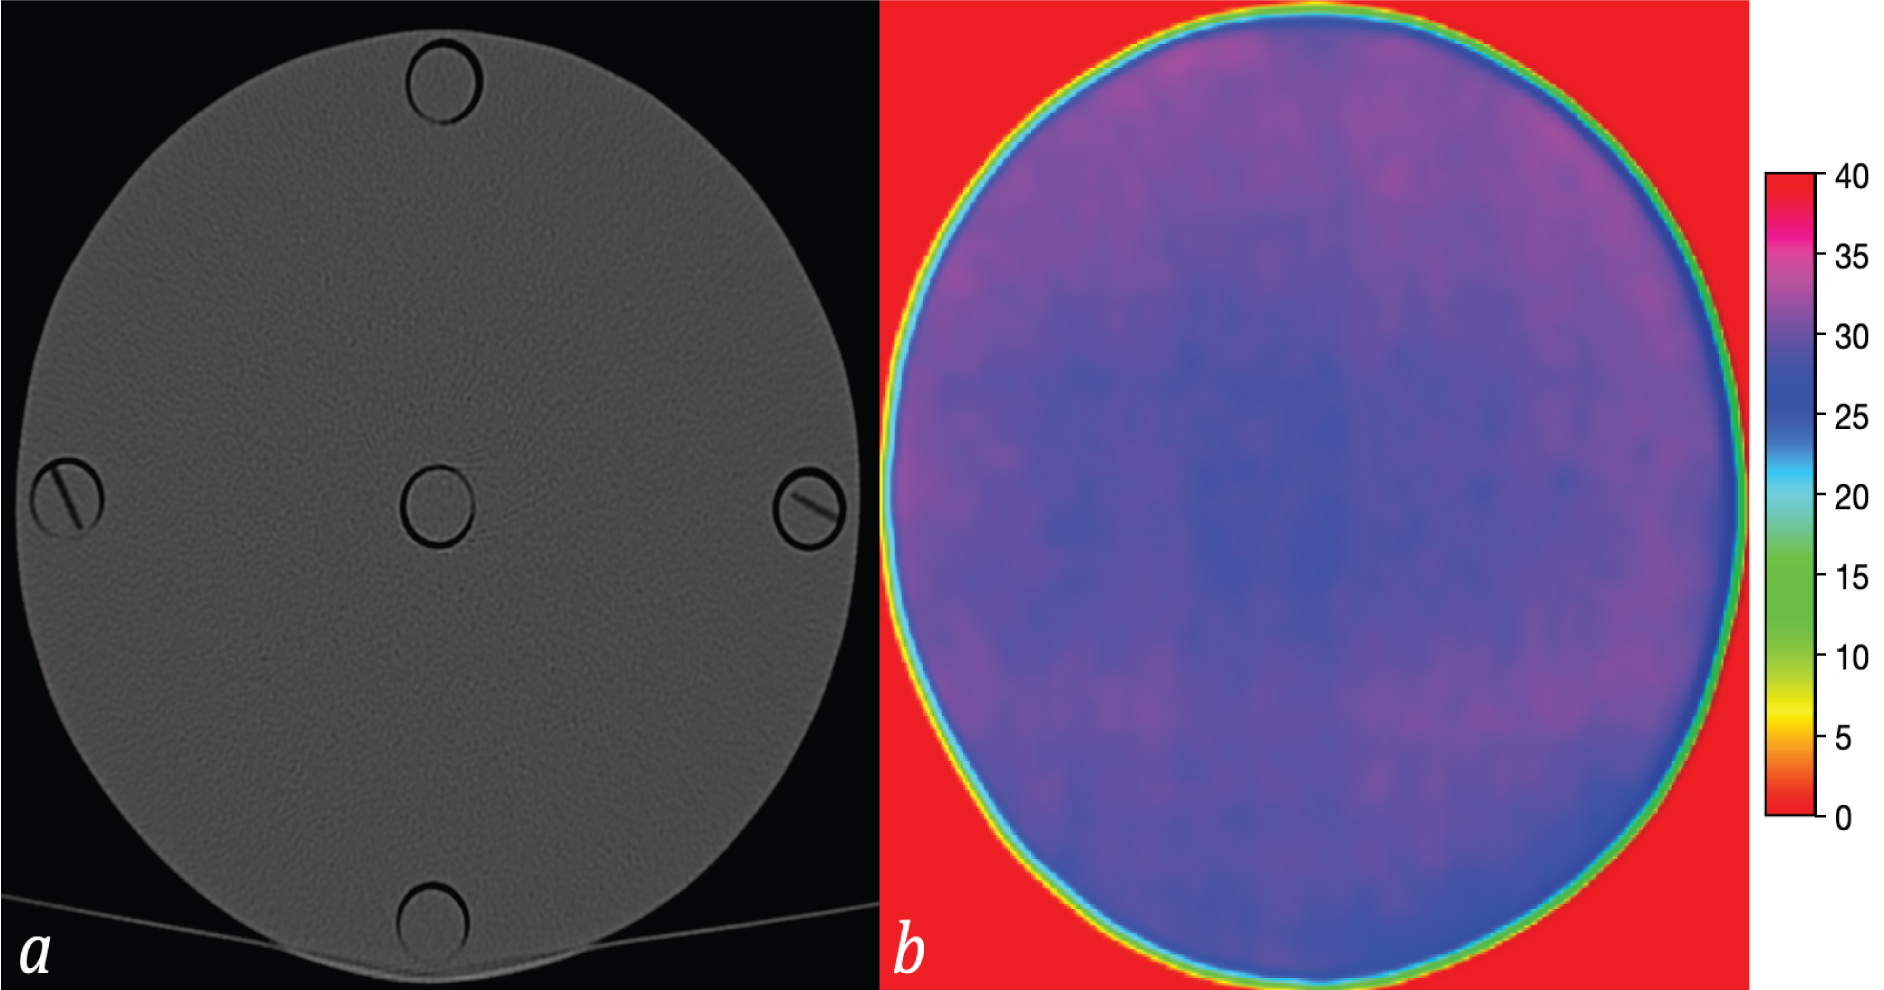 Figure 6: CT image of the central head slice (a) and the absorbed dose variation (mGy) in color scale (b).
View Figure 6
Figure 6: CT image of the central head slice (a) and the absorbed dose variation (mGy) in color scale (b).
View Figure 6
Table 2 shows the average values and standard deviation of the absorbed dose recorded in each opening position from the film dada using the parameters defined in the Table 1. From the punctual dose it was calculated the CTDIvol value of this CT scan.
Table 2: Values of absorbed dose in mGy. View Table 2
The protocol using 140 kV voltage has the highest average value recorded in position 12 of 32.05 ± 0.39 mGy. Although, the central position has the minimum value happened with 23.87 ± 0.73 mGy. This occurs due to the lower penetration of the less energetic beams in the phantom by the filtration by of the PMMA thickness equal do the radius of the phantom.
The Figure 7 presents the absorbed dose variation in the axis X and Y. In the axis X the absorbed dose is less than 30 mGy and in the central area has a minimum value of 22 mGy. On the other hand, the Y axis goes from position 6 to 12 with the highest dose in the region 12 with the dose close to 32 mGy.
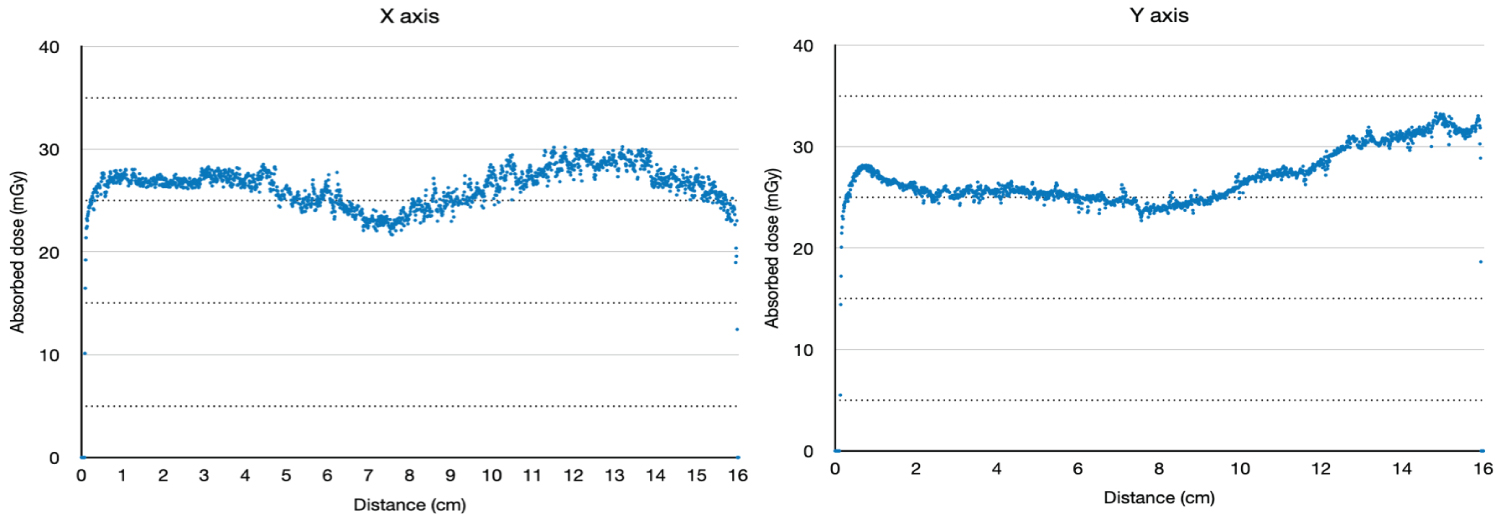 Figure 7: Dose profile variation on the X and Y axis.
View Figure 7
Figure 7: Dose profile variation on the X and Y axis.
View Figure 7
The absorbed dose profile was obtained for the 140 kV X-ray beam in the head CT scan of the adult standard head phantom. Dose values recorded in radiochromic film variated from 23.87 to 32.05 mGy. The dose profile shows doses in the peripheral areas were higher than in central area. The higher dose occurs in the top and lowers in the center. Using radiochomic film it's possible to record data and have the CTDIvol of a CT scan. Tests with different voltage values can help generate new acquisition protocols aimed at dose reduction in CT scans.
This study was financed in part by the Coordenacao de Aperfeicoamento de Pessoal de Nivel Superior - Brasil (CAPES) - Finance Code 001. Also, this work was supported by the FAPEMIG.
The authors declare no conflict of interest.