Physical inactivity and long sedentary time are common in obese people. The eMouveRecherche application was developed to provide accurate minute-by-minute classification of physical activity in light, moderate, vigorous intensity and sedentary bouts. The aim was to compare the frequency and length of bouts in Normal-Weight (NW) and Overweight (OW) adults.
Fifty-seven adult participants either normal weight or overweight wore a smartphone with the eMouve application for the entire waking period of the day. The continuous 1-5, 5-15, 15-30, 30-60 and higher than 60-minute bouts for each behavior were counted.
The total number of bouts was higher in NW than in OW (12.4 vs. 9.8 bouts.h-1, p < 0.001). The breakdown of immobile and active bouts according to their length was different in the two groups. The NW had a significantly higher percentage of brief immobile bouts (1-5 min) (65.2% vs. 49.7%), while OW had a significantly higher percentage of 5-15 min (26.8% vs. 19.1%) and 15-30 min sedentary bouts (11.8% vs. 8.0%). The 1-5 min bouts of light-intensity activity were statistically more frequent in OW (93.6% vs. 83.5%), whereas bouts of 5-15 min (15.1% vs. 6.4%) and 15-30 min bouts (1.3% vs. 0%) were more common in NW.
The frequency of both immobile and light-intensity activity bouts was lower in OW, whereas the duration of bouts was respectively longer for immobile behavior and shorter for light-intensity activity, resulting in a continuous sedentary pattern with few active breaks. The overweight appears to be a barrier to the spontaneous practice of light-intensity physical activity.
Physical activity bout, Sedentary bout, eMouveRecherche application, Accelerometer, Normal-weight adults, Overweight adults
BMI: Body Mass Index; NW: Normal Weight; OW: Overweight; TEE: Total Energy Expenditure; M: Men; W: Women
Long sitting time and lack of physical activity (i.e., inactivity) are associated with obesity and non-communicable chronic diseases. Adults seated more than 8 hours per day had a 62% higher risk of obesity compared to those seated for less than 4 hours per day [1]. Total daily sitting time was associated with lower percentage lean mass and higher total body fat mass in older people [2]. Clear evidence exists that physical activity time is associated with a more favorable BMI and mobility. Thus, young adults who spent more than 30 min engaged in moderate to vigorous physical activity per day had lower fat mass than the other participants [3]. Greater physical activity is associated with less adiposity in the general adult population [4]. Moreover, regular physical training leads to a reduction in fat mass, abdominal obesity and prevents loss of muscle. In another study, adult men and women in the highest quartile of moderate or vigorous physical activity time had significantly faster gait speed and performed a greater number of sit-to-stand transitions evaluated for physical capacity tests [5].
Physical exercise has been promoted as a strategy not only to prevent weight gain, to maintain body weight after weight loss but also to effectively prevent and treat many psychiatric, neurological, metabolic, cardiovascular and pulmonary diseases [6]. Therefore, the physical activity guidelines for Americans recommend spending at least 150 to 300 minutes engaged in moderate-intensity activity or 75 to 150 minutes in vigorous aerobic physical activity per week in bouts of 10 min or more [7]. Recommendations emphasize that moving more and sitting less will benefit nearly everyone. A recent meta-analysis of over one million adults found an exponential increase in the risk of all-cause mortality and cardiovascular disease-related mortality in people who sat more than 8 h.d-1 and were also physically inactive (less than 5 min.d-1 of at least moderate-intensity physical activity [8]. However, the guidelines offer no recommendations regarding sedentary time. More recently, due to the objective physical activity assessment using accelerometers, light-intensity physical activity and breaks in sitting time (sit-to-stand transition) have been studied and showed beneficial effects on health and reduced mortality. For example, more frequent breaks in sitting time were associated with a 45% reduced risk of having pre-sarcopenia, defined as appendicular lean mass divided by Body Mass Index (BMI) [2]. Some studies also showed that performing frequent short bouts of light-intensity physical activity (less than 5 min) improved resting blood pressure in overweight and type 2 diabetic patients [9,10]. Loprinzi (2017) found that after adjusting for the moderate-vigorous physical activity time, each supplementary hour of light-intensity activities decreased mortality by 16% [11]. The meta-analysis of Ekelund, et al. in which sedentary and active behaviors were measured by accelerometers showed that 375 min.d-1 of light-intensity physical activity or 24 min.d-1 of moderate or vigorous activity or less than 9.5 h-1 of sedentary time were associated with reduced risk for mortality in middle aged adults and elderly people [12].
The smartphone can be used today in research studies for different purposes as a device to evaluate behaviors in free-living conditions or to test interventions that modify time spent in sedentary behavior [13]. The advantage of using a smartphone compared with a research device is the wide availability of smartphones in the general population. This availability makes it possible to consider carrying out epidemiological studies without device limitation. Because of objective measurements given by the accelerometers, the assessments of both the intensity and duration of active and sedentary behaviors are more accurate than the subjective responses collected by physical activity questionnaires. Objective measurements avoid errors attributable to reporting bias and difficulties with recall [14]. In a previous work, we developed the eMouveRecherche application to accurately quantify four types of behavior: Immobility, light-, moderate- and vigorous-intensity activity from accelerometry data collected by smartphones. Specific algorithms to quantify time spent in these four categories were developed in two distinct populations and tested in controlled and free-living conditions [15,16]. The algorithms were scientifically validated with less than 5% of error in absolute value against the reference method (indirect calorimetry) or research device (Armband®). In free-living conditions, Overweight (OW) individuals spent more time immobile (81% vs. 65% of the waking period) and twice less time in light-intensity activities than Normal-Weight (NW) individuals (15% vs. 29%). No difference in moderate or vigorous intensity activity was observed between the two groups [17]. Such gaps in time spent in immobile or light-intensity activities constitute a behavioral marker of BMI or fat mass. There may be other behavioral markers of excess weight than the cumulative sedentary or lightly active time. The aim of the present work was to compare sedentary and active profiles in the same participants already studied by Rousset, et al. [17], but this time according to the frequency and the length of sedentary, light, moderate and vigorous physical activity intensity periods. The authors hypothesized that the sedentary and active pattern would be different in NW and OW participants.
Two groups of adult participants in active professional life, either NW (n = 30) or OW (n = 27), free of chronic disease, were studied in free-living conditions. During the preliminary visit, they were given a resting electrocardiogram validated by a cardiologist (ECG cardimax FX-7202, Fukuda Denshi). They were weighed and their height was measured to compute the BMI. The participants were told to maintain their current habits for the waking period of one day, i.e., spontaneous activities. Each participant was instructed to wear an Android smartphone (Samsung Galaxy x Cover or LG Nexus 4 or Nexus 5 or the participant’s smartphone) in the left pants pocket for the entire waking period (from 8:00 about to 22:00). The eMouveRecherche application collects the smartphone accelerometry data at 6 Hz. The raw accelerometry data were then sent via Internet to the Activ Collector Web platform (https://activcollector.clermont.inra.fr) where they were immediately compiled and analyzed according to the validated algorithms [15,16]. The clinical trial and the accelerometry data management have already been described in detail [16]. Total Energy Expenditure (TEE) was assessed from time spent in the four behavioral categories and from the equations of Schofield for the NW and Mifflin for the OW [18]. Since short bouts of physical activity could produce beneficial health outcomes and long sedentary bouts could be deleterious, each bout of continuous behavior for the waking period (immobile, light-, moderate- and vigorous-intensity activity) was ranked in either the 1-5 min, 5-15 min, 15-30 min, 30 to 60 min or more than 60 min bouts. The ratio of bout number of a fixed length to the total number of bouts present in the behavioral category was computed in order to show the proportion (%) according to length. The ratio of the cumulative duration of a fixed length bout to the total duration was calculated in each behavioral category to show the percentage of time spent per length category.
The protocol was approved by the French Committee for the Protection of Human Subjects (Sud-Est VI). It was registered under the references 2013-A00188-37 and 2013-A01140-45 in the ANSM system, and under the references NCT01995162 and NCT02348554 in Clinical Trials. The participants signed an informed consent form before beginning the clinical trial.
Two-way (gender, BMI group) analyses of variance with interaction were carried out to determine if the two groups had similar age, BMI, TEE and TEE per kilogram of body mass. The same model of variance was then applied to the total number of bouts per hour to determine if they differed between men and women, and between NW and OW participants. The same model of analysis of variance was then performed for each behavioral category. Finally, time accumulated in each behavioral category was then analyzed by length to determine if gender and/or BMI group influenced the duration of bouts.
Fifteen women and 15 men were normal weight (NW, 22.2 ± 1.9 kg.m-2), and 14 women and 13 men were overweight or obese (OW, 34.2 ± 4.4 kg.m-2). There was a significant gender*BMI category interaction. NW women had a slightly lower BMI than men (21.6 vs. 22.9 kg.m-2, F = 3.9, p = 0.06), whereas OW women had a significantly higher BMI than men (37.1 vs. 31.3 kg.m-2, F = 21.4, p < 0.0001).
The OW participants were older than the NW participants: 45 ± 9 years vs. 33 ± 9 years (F = 24.8, p < 0.0001). The TEE assessed by eMouveRecherche was lower in NW than in OW (2278 ± 460 kcal.d-1 vs. 2798 ± 494 kcal.d-1, F = 22.1, p < 0.0001; Figure 1), and higher in men than in women (2707 ± 467 kcal.d-1 vs. 2330 ± 547 kcal.d-1, F = 10.9, p = 0.0007). Moreover, there was a significant gender*BMI interaction (Figure 1): The gap in TEE between the NW and OW was higher in women than in men.
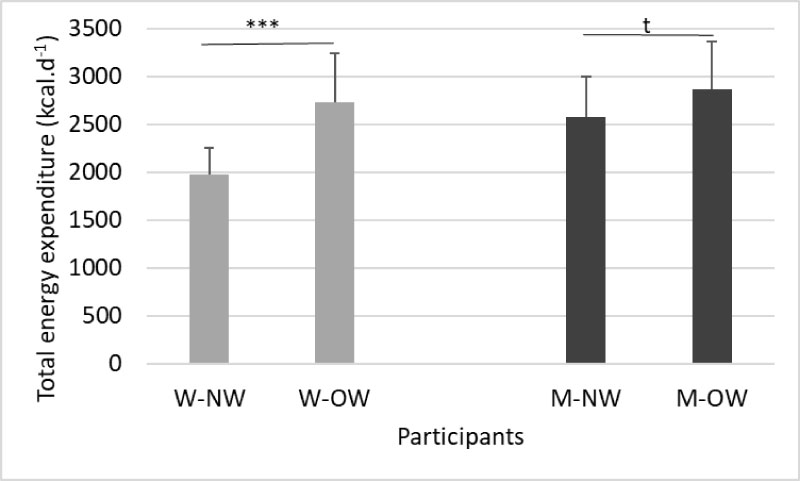 Figure 1: Difference in total energy expenditure between BMI and gender.
W-NW: Normal-Weight Women, W-OW: Overweight Women, M-NW: Normal-Weight Men, M-OW: Overweight Men.
***: p < 0.0001; t: p < 0.10.
View Figure 1
The total energy related to body weight was higher in NW than in OW (35.3 ± 3.8 vs. 28.6 ± 3.0 kcal.kg-1, F = 64.7, p < 0.0001) and higher in men than in women (33.8 ± 5.2 kcal.kg-1 vs. 30.7 ± 5.2 kcal.kg-1, F = 12.6, p = 0.0008; Figure 2) without significant interaction between gender and BMI.
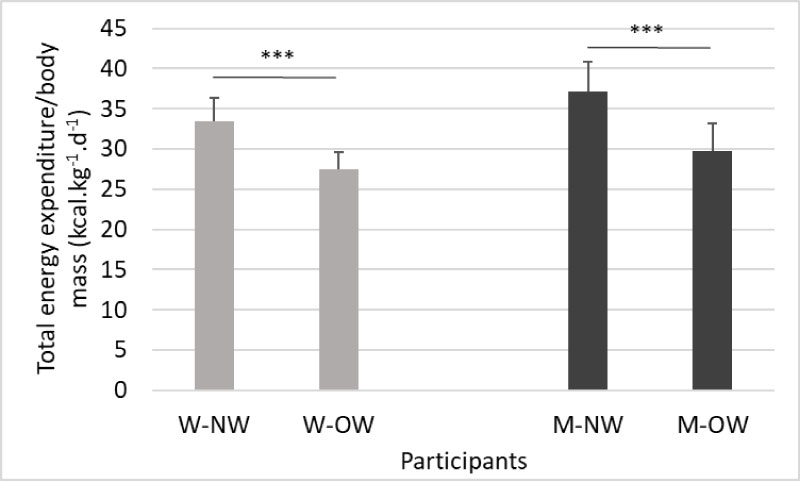 Figure 2: Difference in total energy expenditure related to weight between BMI and gender.
W-NW: Normal-Weight Women, W-OW: Overweight Women, M-NW: Normal-Weight men, M-OW: Overweight Men.
***: p < 0.0001.
View Figure 2
The two-way analysis of variance showed a significant effect of BMI group, gender and their interaction on the total number of bouts, regardless of their length (Figure 3). They were lower in OW than in NW participants (9.4 vs. 11.3 bouts.h-1, p < 0.0001), and in women than in men (10.4 vs. 11.8 bouts.h-1, p = 0.001). The BMI*gender interaction was also significant: even though the number of bouts differed in normal-weight men and women (13.6 vs. 11.3, p = 0.0001), they were similar in overweight people (10.0 and 9.5 bouts.h-1, p = 0.35).
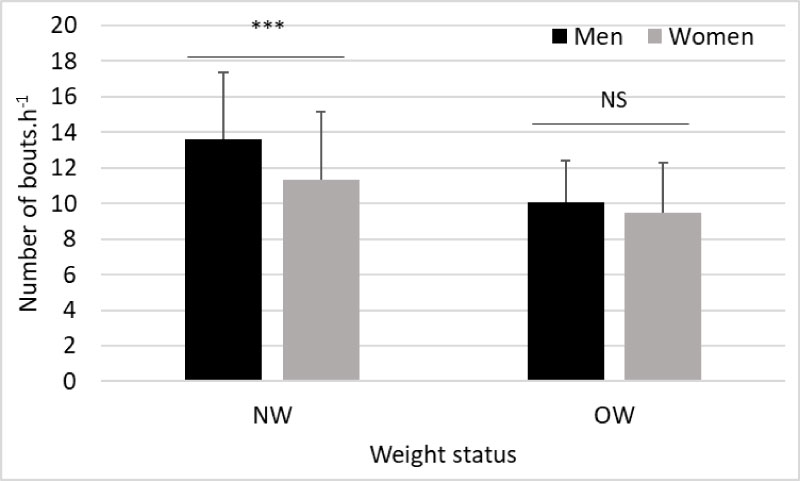 Figure 3: Total number of bouts per recording hour by gender and weight status.
NW: Normal Weight, OW: Overweight.
***: p < 0.0001; NS: not significant.
View Figure 3
Considering the number of bouts in each behavioral category, the analysis of variance shows that BMI influenced the number of bouts, regardless of their length. Both the number of sedentary and light-intensity bouts per recording hour were higher in NW than in OW participants: 5.2 sedentary bouts per hour vs. 4.2 (F = 6.2, p = 0.01) and 6.0 light-activity bouts per hour vs. 4.7 (F = 10.4, p = 0.002), respectively (Figure 4). No difference between the two BMI groups occurred for moderate or vigorous bouts. Gender had no significant effect on the number of bouts in any category.
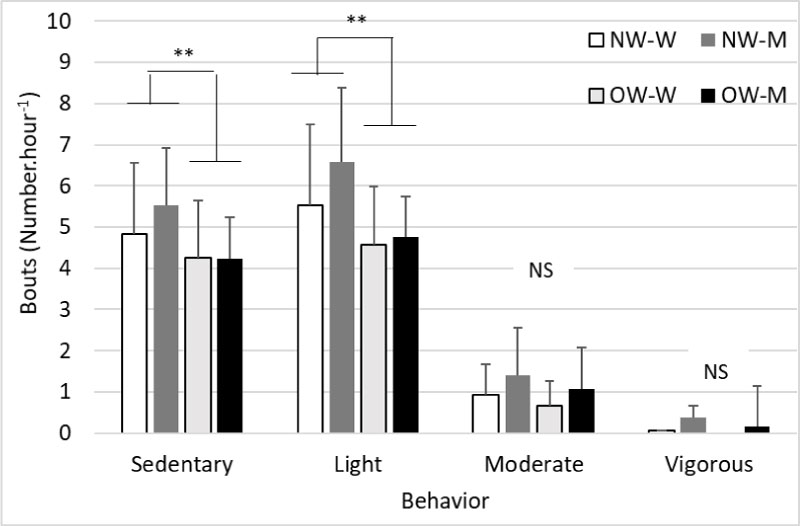 Figure 4: Number of bouts in the four behavioral categories according to gender and BMI.
W-NW: Normal-Weight Women, W-OW: Overweight Women, M-NW: Normal-Weight Men, M-OW: Overweight Men.
**: p < 0.01; NS: not significant.
View Figure 4
As a reminder, the total percentage of time spent in sedentary behavior was lower in NW than in OW participants (65% vs. 82%) and vice versa for light-intensity activities (29% vs. 15%) [17]. In Table 1, we compared the proportions of the bouts according to their length in NW and OW participants. The short sedentary bouts (1-5 min) predominated compared to the other lengths in NW participants, whereas in OW participants, 1-5 min sedentary bouts constituted less than half of the sedentary bouts.
Table 1: Mean and standard deviation of the number and cumulative duration of bouts per length, behavioral category and weight status of the participants. View Table 1
Light-intensity activity time was divided into short bouts in both groups. Thus, 1-5 min bouts represented more than 80% of bouts in this category and were more common in OW participants (Table 1). On the contrary, the 5-15 min bouts of light-intensity activity were more than double in NW than in OW participants. Only the NW participants performed the 15-30 min bouts of light-intensity activity.
As regards the moderate- and vigorous-intensity activities, there was no difference between the groups. They represented 4.7% vs. 3.0%, and 0.4% vs. 0.01% of the waking period, respectively, in NW and OW participants. The more frequent bouts in moderate-intensity activity had a 1-5 min length (more than 88% of the bouts), then the 5-15 min bouts. Bouts longer than 15 min were uncommon. Vigorous-intensity activities were rare: Only five NW and one OW participant had at least one bout of vigorous activity. The shortest bouts of vigorous activity were the most frequent.
The two-way analysis of variance often showed a BMI effect as shown above but no effect of gender or of BMI*gender interaction except for the light-intensity 15-30 min bouts. NW women had a higher proportion of 15-30 min bouts than OW women (2.0% vs. 0%, p < 0.001), while no difference occurred between NW and OW men (0.6% vs. 0%, p = 0.18).
After examining the number of bouts by length out of the total number, Table 1 shows the cumulative duration of the bouts by length compared to the total duration in each behavioral category.
In NW participants, the cumulative duration of sedentary bouts was about 20%, regardless of their length (Table 1), whereas in OW participants, the cumulative time of the longest sedentary bouts was better represented than the shortest ones. The cumulative duration of the shortest bouts (1-5 min) in sedentary behavior performed by NW participants was twice as high as those of the OW participants. The aggregate time of the sedentary bouts of 5-15 min, 15-30 min, 30-60 min and more than one hour were similar between the two groups.
The cumulated duration of light activity was the highest for the shortest bouts and decreased when the bout length increased in both groups. However, the cumulative duration of 1-5 min bouts was significantly higher in OW participants, whereas that of 5-15 and 15-30 min was greater in NW participants.
There was no difference between BMI groups in cumulative duration of moderate- or vigorous- intensity bouts, regardless of their length. There was only a gender effect and a gender*BMI interaction on the cumulative duration of light-intensity 15-30 min bouts. This bout length of light-intensity activity was more popular in women than in men. NW women had a higher significant cumulative duration of 15-30 min bouts than OW women (9.9 % vs. 0%, p < 0.001), whereas a slight difference occurred between NW and OW men (3.8% vs. 0%, p = 0.08).
The purpose of this work was to compare sedentary and active patterns during a free-living day between NW and OW men and women. This study showed that BMI dramatically influenced the number and the length of bouts in both sedentary behavior and light-intensity activity. Thus, OW participants had less sedentary bouts but of greater length than their NW counterparts. In both groups, the very short bouts of light intensity or moderate activity were predominant, and bouts longer than 15 min were less frequent. However, the difference between groups focused on the cumulative duration of short bouts of light intensity that was higher in OW participants, whereas that of the long bouts was higher in NW participants.
Obese people are more sedentary than NW individuals [17,19-21]. Belletiere, et al. showed that often interrupting sitting posture was associated with lower BMI and waist circumference in an Australian adult cohort (AusDiab) [20]. In our study, we also found that frequent short bouts in sedentary behavior unlike long bouts were associated with the NW status. Kim, et al. showed that about 70% of sedentary bouts took less than 5 minutes in an adult population, whereas only NW participants in the present study reached approximately 65% of bouts (< 5 minutes) [22]. Thus, the OW participants in the present study had only 49.7% of short sedentary bouts, the other sedentary bouts being longer. In the Husu, et al. study, the cumulative duration of sedentary bouts lasting less than 5 minutes was shorter than those of over 5 minutes (19% vs. 77%) in a large 30- to 75-year-old Finnish population sample [23]. These results were similar to those observed in the NW sample of the present study (18% vs. 82%) but differed from those observed in the OW sample (9% vs. 91%, Table 1). The meta-analysis of Chastin, et al. reported that interrupting sedentary bouts by light- or moderate- to vigorous- intensity breaks helps to decrease BMI and to improve postprandial glycemia [24]. The mean daily number of standing bouts and time accumulated from different bout lengths were associated with a reduction of waist circumference [23]. These previous studies and the present findings concurred that time spent standing, the high number of sit-to-stand transitions and/or long light-intensity activities had positive effects on anthropometric or biological parameters because they were associated with lower BMI, smaller waist circumference or reduced postprandial glucose and insulin responses [25]. These non-exercise activities seem to be of the utmost importance because they may further affect metabolism and body composition.
The different patterns of sedentary and active behaviors between the two weight statuses were not related to strong efforts, at least in appearance. Thus, no marked difference in time spent in moderate- or vigorous-intensity activities occurred between the two groups. The difficulty for the OW participants was to interrupt sitting posture by standing and making slow movements. If the sitting/standing transition can be performed within a few seconds, it needs energy and a strong contraction of leg muscles, leading to pain in the joint area. Nakagata, et al. reported that the energy cost for 10 sit-to-stand transitions at normal speed (1 s) was about 3.6 METs in NW young men. When the speed was slow (3 s), the energy cost increased by 40%. Moreover, when the body weight increased, the intensity of sit-to-stand transitions increased as well [26]. These findings may help us to understand why OW or obese people are reluctant to stand up. The effort expended for the sit-to-stand transition will be much greater in OW people because of both their heavy body weight and slower posture change. In these conditions, OW people could perceive transitions as difficult, unlike normal-weight people. The short light-intensity bouts observed in OW participants may also be due to the heavy weight body and the fatigue resulting from moving it. In Ekelund, et al., BMI, body weight, fat mass and waist circumference predicted sedentary time in middle age subjects over a 5-year period [27]. In contrast, the authors failed to find that sedentary time predicts body mass gain. The heaviness could be the reason for fewer activity efforts.
Some intervention studies showed that replacing 30 min of prolonged sitting by moderate or vigorous physical activities resulted in lower BMI and waist circumference [28,29]. This effect seemed to have a larger impact compared with replacing sedentary behavior with light physical activities [29]. However, it is more feasible to practice the latter ones than moderate or vigorous activities for the general population, elderly people and patients with chronic diseases. Moreover, the present study showed that the physical activity deficit in OW participants compared to NW participants was focused on light-intensity behaviors.
In spite of a shorter time spent in active behaviors, OW participants expended more energy than NW participants. However, TEE per kilogram of body weight was lower in OW participants. Other authors such as Lefai, et al. also found similar results [30]. They explained that higher TEE in OW was due to higher resting metabolic rate and physical activity energy expenditure, but these differences disappeared after adjustment of body mass. Higher TEE in OW is the result of a greater fat free mass and fat mass [31]. Uygur, et al. also showed that resting metabolic rate (RMR) was significantly higher and RMR per kilogram of body weight was lower in both male and female obese adults compared to normal-weight controls [32].
The present study has certain limitations: The two groups differed in age. OW individuals were older than NW. Thus, it is common to gain body weight with aging. The number of overweight persons is higher after 40 years than around 30 years. The authors are convinced that the age in the 33-45-year interval was not the responsible factor for the sedentary and active patterns observed in the study but, instead, that excessive weight is a powerful barrier to mobility. The behavioral recording time was short (a single day) but sufficient to reveal differences between NW and OW behavioral patterns. Only two groups of participants were studied. In the future, the sedentary and active behaviors of older people, either healthy or with chronic diseases, will be studied.
Long light-intensity bouts and frequent interruptions in sedentary time were associated with the NW status. On the contrary, long sedentary bouts were a specific pattern in OW participants. These results seem to show that to be able to move smoothly from sitting to standing and to engage in light-intensity activities, it is first necessary to have a light body. If not, people have difficulty standing up and prefer to maintain comfortable, less tiring and painless sitting positions as long as possible to avoid making strenuous efforts. This suggests that to increase and maintain the physical activity level of OW patients, it makes sense to begin with an adapted diet to promote weight loss. As a second step, physical training and the introduction of a greater amount of light-intensity activity time on a daily basis should be proposed. Thus, it would be interesting to compare the effectiveness of interventions that simultaneously combine diet and physical training with interventions that successively propose a long change in diet quality in order to lose a substantial amount of weight, followed by physical activity training to maintain weight loss and to increase the duration of active periods and the number of breaks in sedentary behavior without discomfort.
The authors wish to thank the participants for their collaboration in this study and Gail Wagman for proofreading this paper. The authors have no conflict of interest.