Background: Obesity has become a serious problem in Western societies and is associated with several health problems and reduced quality of life. The purpose of this randomised, clinical trial is to investigate the effects of a moderate-intensity, intermittent, circuit training program on a range of cardiovascular risk factors such as body composition, biochemical and physiological variables and aerobic capacity in obese and overweight individuals.
Methods: A total of 30 participants were selected and 15 of them performed a moderate-intensity, intermittent, circuit training program; whereas the rest acted as a control-group. The circuit training program consisted of 10 exercise stations and was performed 2 times per week for 8-weeks in total. The experimental group performed a circuit training program with training cycles at 50-60% of heart rate reserve which were followed by active recovery periods at 40-50% of heart rate reserve. Control-group remained sedentary during the period of 8-weeks and follow-up. Biochemical markers, isometric strength, body composition and physiological parameters were assessed at baseline and 8-weeks post-intervention, whereas maximal oxygen consumption was assessed at baseline, 8-weeks and 2-months follow-up.
Results: Significant improvements were demonstrated in BW (2.5%), BMI (~3%), BF% (~4%), BF-Kg (~6%), and LBM% (3.3%), SBP (5.3%), HR-resting (4.3%), MAP (~5%) and cardiorespiratory fitness (~11%) in the exercise group post-intervention. Significant time by group interaction was found for all physiological variables (SBP, DBP, HR, MAP, RPP) in favour of the exercise group. VO2 peak improved post-intervention by ~11% in the CT-group, in contrast to 1.7% in the control-group.
Conclusion: The present data suggest that a moderate-intensity, intermittent circuit training program for 8-weeks may be effective in reducing cardiovascular risk factors.
Circuit training, Body composition, Cardiovascular health, Risk factors, Obese, Overweight, Moderate-intensity intermittent training
Obesity is described as weight gain along with body fat accumulation that is associated with an increased risk of certain chronic diseases [1]. Epidemiological data suggest that obesity increases globally [2] and is strongly associated with the development of chronic diseases, lack of health-related quality of life and rising costs of health care [3]. In order to lose weight, someone needs to sustain a negative energy equilibrium and the most effective way to achieve this is a combination of diet, exercise, and behavioural change [4,5]. Specifically, an increased energy expenditure through exercise combined with a proper diet can lead to weight loss that lasts up to 36-months [6]. In addition, exercise is important in improving cardiorespiratory fitness, which is independently associated with overall mortality [7].
However, despite the body of evidence on the benefits of regular exercise, as well as the negative effects of a sedentary lifestyle, most obese individuals have very low levels of physical activity, well below the recommended physical activity per week (150 min of moderate or 75 min of vigorous activity) [8]. It seems that this recommendation is not realistic for most obese and overweight individuals due to lack of sufficient time to spend on prolonged exercise regimes [9]. In order to overcome the time barrier, High-Intensity Interval Training (HIIT) was suggested as a useful and time-consuming alternative option to Moderate-Intensity Continuous Training (MICT) [10]. Whyte, et al. (2010) showed that 2-weeks of sprint interval training (6 sessions of 4-6 × 30s and 4-5 mins recovery) improved insulin sensitivity, Waist Circumference (WC) and Systolic Blood Pressure (SBP) in overweight and obese men [11]. Moreover, Trilk, et al. showed that overweight and obese women had 12% increase in VO2 max, 11.4% increase in stroke volume and 8.1% reduction in Heart Rate (HR) at rest following 4-weeks of sprint interval training (4-7 × 30s "all out" sprints and 4 mins recovery) [12]. Even a single bout of HIIT (4 × 30s "all out" sprints with ~4-mins recovery) as Whyte, et al. showed, improved glucose tolerance, insulin sensitivity and fat oxidation in obese men [13]. Other studies conducted with overweight and obese individuals haveused a modified HIIT protocol for 2-6-weeks, which is likely to be more practical for overweight and obese populations than Wingate and reported improvements in body composition, insulin sensitivity, lipid profile and VO2 max [14-17].
Although the findings from these studies suggest that the "all out" and modified HIIT protocolscan be an effective way to manage obesity, injuries often become a problem among the sedentary people who are unfamiliar with exercise of such high intensity [18]. In addition such an exercise regime often requires specific equipment and guidance from exercise professionals through-out the session [18].
On the other hand, if exercise intensity is moderate, the dropout rate among sedentary or untrained individuals is usually lower and also the rate of adherence is higher than in vigorous exercise [19]. Collectively these results provide evidence that obese and overweight individuals are either not willing or unable to participate in a strenuous exercise like HIIT [20]. The moderate intensity makes the exercise significantly easier and more enjoyable to unfit and overweight individuals therefore has the potential to increase adherence.
To date, the majority of HIIT studies in overweight and obese individuals have used cycling and running protocols, with a weekly frequency of ~3-times per week and a follow-up time ~/8-16-weeks [21-25]. This focus on just one exercise mode, is contrary to the public health guidelines which suggest that in addition to aerobic physical exercise, moderate to vigorous muscle-strengthening ≥ 2 days/week will also bring other health benefits [26]. Apart from the health benefits, strength adaptations might be vital for increasing enjoyment of exercise [27] as resistance exercise leads to an increase in muscle strength and power [28], which improves bone mineral density [29], lipid profile [30], glycaemic control [31], metabolic syndrome risk factors [32] and body composition [33]. Additionally, the improvements in strength are associated with enhancements in muscle performance and physical function, which translate infavourable changes in the activities of daily living in obese and overweight individuals [34].
It was therefore suggested that Circuit Training (CT), which combines aerobic and resistance training, may be the preferred way of producing complex adaptations than a unimodal exercise regimen such as HIIT [33,35]. During exercise the use of body weight as resistance or simple and cheap equipment, combined with short-periods of active rest has the potential to eliminate training time and be cost effective [36]. The proposed exercise program consists of a combination of resistance and aerobic exercises, using inexpensive and readily accessible equipment to overcome some of the current exercise problems that general population and especially overweight and obese individuals may have. CT effectively reduces the amount of time the individual spends exercising while helping to achieve a satisfactory mode of training [37]. Evidence suggests that CT can improve body composition [38-42], cardio metabolic risk factors [43,44], biochemical markers [45], physiological parameters [46], VO2 max [10] and more importantly, motivation to exercise [47]. Despite the after-mentioned improvements in health with CT it is still not clear what is the most effective combination of exercise parameters (frequency, intensity, type, time, work effort to rest ratio) in order to promote health of obese and overweight population. In addition, it is not clear what is the minimum volume of CT training above which meaningful adaptations appear.
The objective of the study was to examine the effects of a short duration (20 min/session), moderate intensity, intermittent, CT, with low-cost equipment, in apparently healthy obese and overweight individuals. It was hypothesized that a CT program performed twice per week for 8-weeks will improve at least some of the body composition, biochemical markers, lower-body strength, cardiorespiratory fitness and physiological parameters in obese and overweight population.
The study was approved by the Cyprus Bioethics Committee (ΕΕΒΚ/ΕΠ/2017/38). This randomized controlled clinical trial included 30 adults, between 18-55 years of age, with body mass index (BMI) ≥ 25 kg/m2 which were free of musculoskeletal or cardiovascular conditions that would impede participation in an exercise program. The participants were recruited after an announcement in a noticeboard in the local area of Nicosia, Cyprus. Participants were excluded if they had regular physical activity over the past 6-months and any symptoms related to cardiopulmonary diseases. Prior to the study, participants were informed about the aim and the design of study before signing a written informed consent. After a general assessment by a cardiologist, those who met the inclusion criteria were randomized into two groups, CT-group (n = 15) or control-group without exercise (n = 15) using established randomization software (SealedEnvelope.com, Clerkenwell Workshops). Participants were required to follow their typical diet and activities of daily life throughout the study. It was not possible to blind participants, as they are usually aware whether they are training or not [48], but the biochemical analysis and the six minute walk test (6MWT) were performed by blind assessors.
Participants were assessed by two investigators at baseline (T-1), after an 8-week intervention (T-2) and 2-months after the intervention (T-3). Anthropometric, biochemical markers, strength of lower body and physiological parameters measurements were performed at T-1 and T-2, whereas VO2 peak and level of fitness were assessed at all 3-time points. Moreover, rating of exertion was assessed only in the first session (pre and post). Baseline assessments were performed under laboratory conditions 1-week before intervention, whereas the follow-up assessments were carried out at least 2-days apart from the last exercise session and after 2-months, at a similar time of the day. Measurements were taken between 8:00-9:00 a.m. after an over-night fast, with no consumption of alcohol or caffein and participation in vigorous physical activity at least 24-hours prior to assessment. On the first visit, all outcome measures were assessed except biochemical markers and cardiorespiratory fitness which were tested on the second visit (24-hours later).
Under 12-hours of fasting state, at T-1and T-2 (24-hoursafter the completion of the program), 5 ml of blood was drawnby a trained biochemist from the antecubital vein in sitting position at 08:00 a.m. Blood markers including total cholesterol, triglycerides, High-Density Lipoprotein cholesterol (HDL), Low-Density Lipoprotein cholesterol (LDL), and glucose were analysed with the Lx20 analyser (Beckman Coulter Inc., Fullerton, CA).
Resting Systolic (SBP) and Diastolic Blood Pressure (DBP) and resting Heart Rate (HR) were measured at T-1, T-2 and at each session (pre-training and post-training). Participants rested in a seated position for 10-min, before resting Blood Pressure (BP) was measured using an automatic BP monitor (Omron M3, Kyoto, Japan). The measurements were taken 3-times (1-min apart) in order to take the average. The resting heart rate (HR-rest) was measured also in a seated position after 10-min of rest by the pulse meter watch (Polar V800, Finland). To set the intensity of training, maximum HR (HRmax) was predicted fromthe 208- (0.7 × age) formula even if participants were older than 40 years [49] and then the intensity of the exercise was set as a percentage of the heart rate reserve (%HRR) for each participant. HRR was determined by theformula: Target HR (THR) = [(HRmax/peak − HRrest) × % intensity desired] + HRrest [50].
Rating of exertion was recorded as a way to monitor exercise load using OMNI-RES (0 = extremely easy to 10 = extremely hard) [51]. Instructions were given to the participants before each session. Moreover, participants were instructedto rate their overall perception about how hard the exercise felt, at the end of each of the two cycles of the exercise.
The measurements conducted at the same time of day and evaluated with the same minimal clothes, without socks and shoes. Body composition measurements included lean body mass (LBM-Kg), percent Lean Body Mass (LBM%), fat mass (BM-Kg), percent Body Fat (%BF), Body Mass Index (BMI). Body composition measurements were conducted using an electronic scale that was calibrated every time (Omron BF511, Kyoto, Japan). Standing height was measured using a Seca 202 stadiometer (Seca, Hamburg, Germany). The WC was measured midway between the lowest rib and the iliac crest and the hip circumference at the level of the symphysis with a tape. Subsequently the Waist-to-Hip Ratio (WHR) was calculated based on the equation WHR = waist circumference/hip circumference [50]. The aforementioned measurements were used to comparechanges in body composition from T-1 to T-2.
6MWT was performed at all 3-time points to evaluate the cardiorespiratory fitness. Participants walked as far as possible in a 30-m indoor corridor, with marks every 3m across its entire length. The turnround point was marked with a cone and the starting line was marked on the floor using a tape in order to acknowledge the beginning and end of each lap. The VO2 peak was calculated using the American College of Sports Medicine (ACSM) formula VO2 peak = (0.02*distance[m]) - (0.191*age [yr]) - (0.07* weight [kg]) + (0.09*height [cm]) + (0.26*rate pressure product [*10-3]) + 2.45 based on the total meters the participants have walked [50].
The maximal isometric strength of quadriceps and hamstrings of both limbs was measured on MicroFET 2 dynamometer (Hoggan Health Industries Inc. West Draper, UT, USA) at T-1 and T-2. Measurements were taken in a standardised seated position with hips and knees fixed at 90° of flexion with a goniometer. Participants sat on the treatment bed, with their back supported in a fully upright position andboth hands on the side. A stabilizing strap was placed over both thighs just distal to the hipjoint and another strap was used to stabilize the dynamometer above the ankle. Participantswere asked to gradually increase their muscle force to a maximum effort which would need tobe sustained for 3s. The «break technique» was applied by the examiner, which overpowers patient's maximum effort and therefore produces an eccentric muscle force [52]. The average muscle force from 3-repetitions was calculated to minimize measurement variability.
Resting mean Arterial Pressure (MAP) and Rate Pressure Product (RPP) were calculated at T-1 and T-2, based on the equations RPP = HR Χ SBP and MAP = [(DBP Χ 2) + SBP]/3] as suggested by several publications [53-55].
Prior to the beginning of the exercise program, participants were involved in a single session in order to familiarize with the exercises performed in the study. During familiarization session an emphasis was placed on learning the proper exercise techniques and the utilisation of OMNI scale. Participants were instructed to abstain from food, caffeine or alcohol at least 5-hours before each exercise session for the duration of 8-weeks. CT program was performed twice a week (with at least 1 day rest in between) under the supervision of a physiotherapist. The exercise protocol consisted of a 3-min warm-up (toe taps, heel taps, marching on the spot, step jack, split squat jack, skier jack) and a 3-min cool-down (toe taps, heel taps, quadriceps stretching, hamstrings stretching, triceps stretching, pectoralis stretching) at 40-50% HRR. After warm-up, participants had to complete 2 circuits in each session, with 8 stations per circuit and 12 repetitions per station. Specifically, the program consisted of 6 cardiovascular (CV) stations and 2 Active Recovery (AR) stations, lasting 1-min and 30s respectively. So, there was 1 AR station for every 3 CV stations. The training intensity of each CV station and AR station was performed at 50-60% HRR and 40-50% HRR respectively. The exercise session was performed as: (1) Medicine ball squat overhead throw, (2) High knees, (3) Squat jumps, (4) Wall push-ups or standing bicep curl, (5) Marching on the spot, (6) Bend over double triceps kickback, (7) Split squat medicine ball slams, (8) Two-handed dumbbell lateral step-up or squats. If the participant failed to reach at least 12 repetitions ona given set, the weight was reduced in the following set, whereas when > 12 repetitions were reached the weight was increased in the following set (following the OMNI-RES scale 6 "somewhat hard").
All participants had low levels of physical activity as measured by the International Physical Activity Questionnaire (IPAQ) except one in the control group and 2 in the CT group which had moderate physical activity levels. Participants were instructed to maintain their lifestyle (refraining from any additional physical activity) and dietary habits, throughout the study. The level of physical activity (outside the exercise program in the CT group) was confirmed with the IPAQ after the study for all participants.
Analyses were performed using SPSS vs. 25.0 (SPSS Inc., Chicago, IL). Equality of variance was assessed using Levene's test and the normality of the data was assessed using the Shapiro-Wilk statistic. Repeated measures ANOVA (2 groups × 2-time points) was applied for all assessment measures (or Friedman's test for non-normally distributed data), except for VO2 peak and level of fitness which had 3-time points. Baseline characteristics (CT-group vs. Control-group) were compared with independent samples t-tests. The level of significance was set at p < 0.05. Data are presented as mean ± SD for normally-distributed data and median (interquartile range) for non-normally distributed data. Effect sizes for the Group × Time interaction were calculated using eta-squared (η2) with the magnitude of effect sizes determined as: small ≤ 0.01, medium ≥ 0.06, and large ≥ 0.14 for η2. Using a mixed model ANOVA, a sample size of 14 individuals per group was found to be sufficient to detect a moderate (Cohens d = 0.57) group by time interaction effect of VO2 peak with a level of significance at 0.05 and power of 0.8.
Baseline characteristics for each group are presented in Table 1. No significant differences were found between the two groups at baseline, except of age (p = 0.005) with participants in CT-group being 15-year younger on average, HR-rest (p = 0.032) which was significantly higher in the CT-group and gender.
Table 1: Baseline characteristics of the two groups. View Table 1
No drop-outs and no any adverse events were recorded during the 3-time points of this study. Moreover, 100% adherence to the program was demonstrated for during of the 8-weeks.
At T-1 and T-2, 90% (n = 27) of participants were categorized at low-category and 10% (n = 3) at moderate-category of fitness level. Only one participant in control-group and 2 participants in CT-group had a moderate level of fitness. No changes in the physical activity of the participants occurred (outside of the training program in the CT-group).
There was a significant group × time interaction in BW (p = 0.004, η2 = 0.002), BMI (p = 0.008, η2 = 0.002), BF% (p = 0.001, η2 = 0.004), BF (Kg) (p = 0.004, η2 = 0.004), LBM% (p = 0.001, η2 = 0.01) and Hip circumference (p = 0.012, η2 = 0.001). The % difference (Post-Pre value/Pre Value × 100%) in BW was 0.6% (± 1.01) for the control-group and -2.5% (± 3.33) for the CT-group. Likewise, the % differences for the BMI were 0.3% (± 1.81) and -2.7% (± 3.19), for the BF% were 3.7% (± 4.33) and -3.7% (± 5.39), for the BF (Kg) were 4.3% (± 6.46) and -5.9% (± 7.60), for the LBM% were -4.7% (± 5.82) and 3.3% (± 6.72), for the Hip were 0.4% (± 0.90) and 0.5% (± 0.92) for the control-group and the CT-group respectively. As evidence from the effect sizes these changes were small despite being highly significant. No group × time interaction was evident in LBM (kg), WC, and WHR Table 2.
Table 2: Outcome variables before and after 8-weeks. View Table 2
There was a significant group by time interaction for the VO2 peak (p = 0.001) with a small effect size η2 = 0.02. CT-group improved by 11.1% (± 8.45) in the 8-weeks of the intervention (T-1 to T-2), in contrast to 1.7% (± 5.87) improvement in control-group. While, VO2 peak decreased in both groups during the detraining period (T-2 to T-3) by 3.2% (± 4.41) and 2.6% (± 4.25) in the CT and control-group respectively it remained 7.5% (± 8.86) higher than baseline in the CT-group. Pair wise comparisons showed only in the CT-group significant differences between T-1 to T-2 (p = 0.001) as well as T-2 to T-3 (p = 0.002) but not between T-1 to T-3 (p = 0.239) (Figure 1). Wilcoxon test demonstrated that the exertion (OMNI Scale) of participants in CT-group was significantly lower (p = 0.004) at the end of the intervention. Ten out of fifteen participants showed a percentage change in OMNI scale between 10% and 33% while five participants showed no change. The average % improvement in exertion was 11.9% (± 10.85).
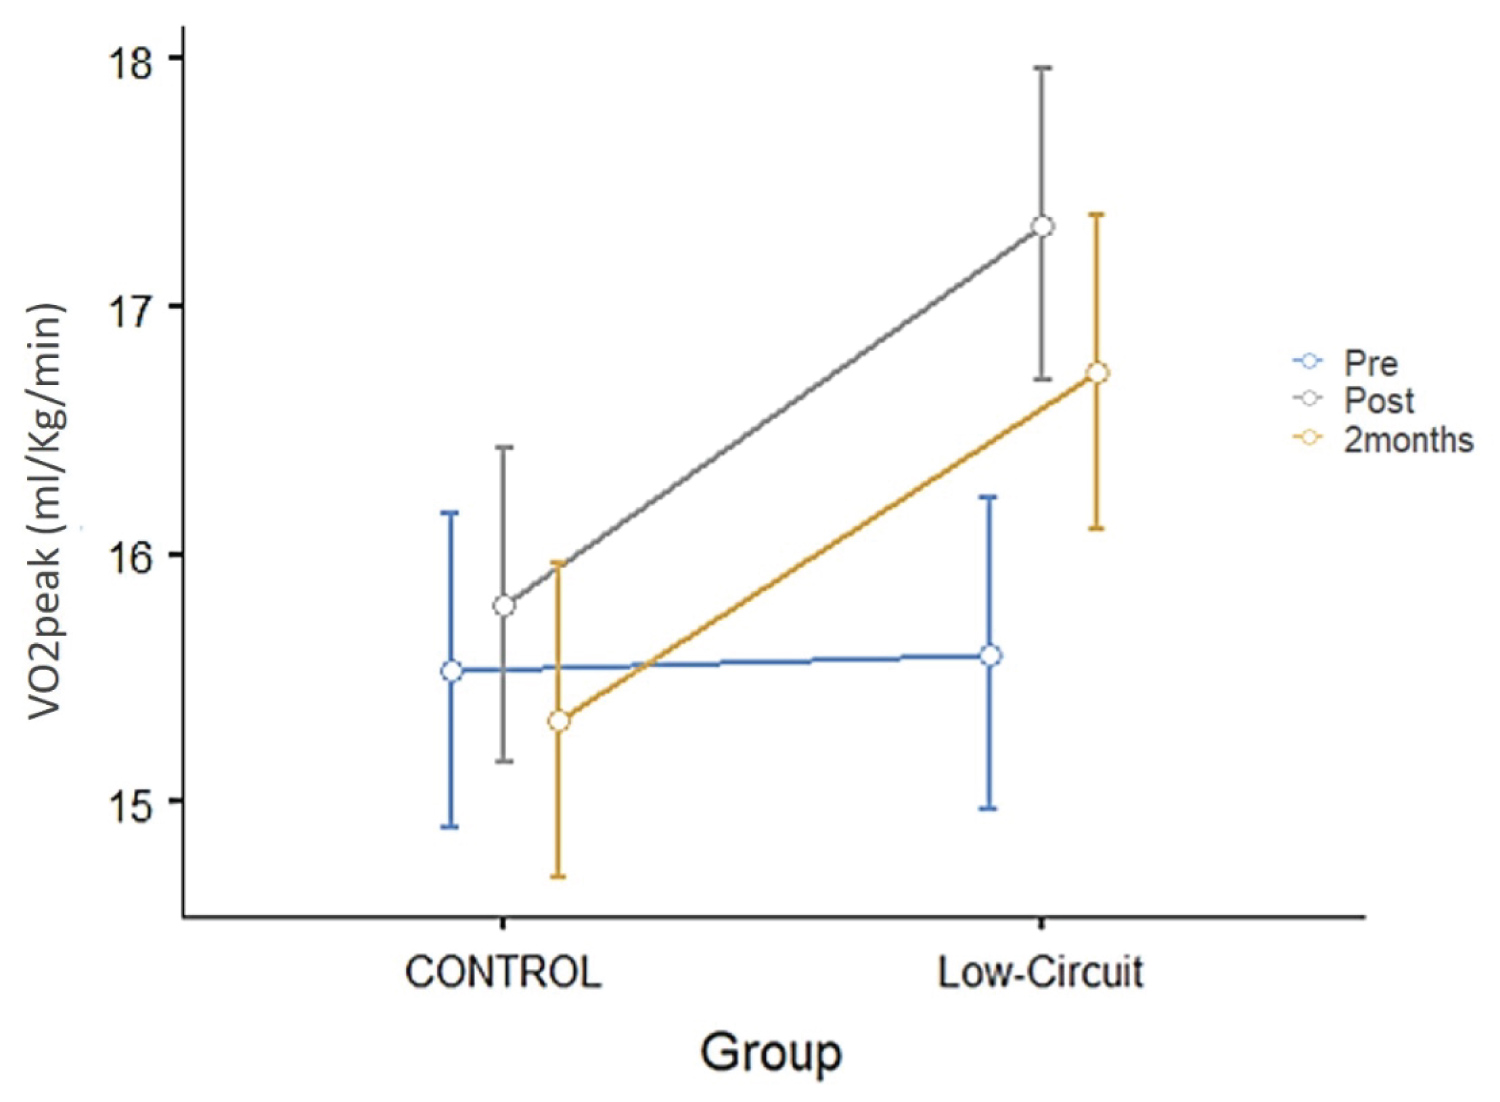 Figure 1: Changes in cardiorespiratory fitness (VO2 peak) throughout the experimental period, from baseline (PRE) to 8-weeks post-intervention (POST) and at follow-up at 2-months (2M) for control-group and CT-group. Significant differences were found only in the Low Circuit group between T1 and T2 and T2 and T3 (p < 0.002). Values are in mean ± SEM.s View Figure 1
None of the biochemical markers showed any statistically significant group × time interaction (η2 from 0.001 to 0.016) (Table 2). The % differences (Post-Pre value/PreValue × 100%) for the LDL were 7.5% (± 24.68) and -0.4% (± 24.17), for the HDL were 17.5% (± 56.23) and 0.5% (± 15.71), for the TC were 1.6% (± 24.99) and -0.7% (± 19.12), for the triglycerides were 12.3% (± 32.03) and 9.9% (± 47.84) and for the glucose were 6.5% (± 9.12) and 9.65% (± 17.35) for the control and CT-group respectively.
Significant group × time interactions were found for DBP (p = 0.009, η2 = 0.06), HR (p = 0.003, η2 = 0.02), MAP (p = 0.001, η2 = 0.05) and RPP (p = 0.001, η2 =0.005) (Table 2). The % difference (Post-Pre value/Pre Value × 100%) in DBP was 5.6% (± 8.61) for the control-group and -5.6% (± 10.17) for the CT-group. Likewise, the % differences for the HR were 3.1% (± 4.6) and -4.3% (± 6.50), for the MAP were 4.6% (± 7.23) and -4.5% (± 4.25) and for the RPP were 6% (± 10.91) and -10% (± 6.99) for the control-group and the CT-group respectively. SBP was not normally distributed and Kruskal-Wallis Test showed no changes over time. The control-group showed a 3% (± 5.98) (p = 0.046) increase in SBP while CT-group had a 5.3% (± 5.46) (p = 0.002) decrease in the 8-weeks of the exercise program (Table 2).
Statistically significant group × time interactions were shown only at the non-dominant (Left) side (p = 0.001, η2 = 0.003 for the L hamstrings and p = 0.040, η2 = 0.001 for the L quadriceps). No significant differences were found on the right side (η2 from 0.001 to 0.009). All these differences were small based on the classification of the effect size.
This study examined whether CT can improve health-related parameters in apparently healthy overweight and obese individuals. The CT program with moderate intensity lasting for 8-weeks demonstrated no dropout rates, 100% adherence and zero adverse events.
The increase in VO2 peak is considered as a strong prognostic marker of all-cause mortality and it is reported that an improvement in cardiorespiratory fitness by 1 ml/kg/min is associated with a 9% reduction of cardiovascular mortality risk [10]. This study showed an average improvement of 1.7 ml/kg/min (or 11%) from T-1 to T-2 and 1.3 ml/kg/min (or 7.5%) T-1 to T-3 with only 16 sessions of 20-minutes of workout per session in eight weeks. Sperlich, et al. demonstrated that after 9-weeks of high intensity CT (2-6 series of functional exercises), 3 sessions per week led to improvements in VO2 max (10.1%) of overweight women [41]. Ballesta-Garcia, et al. showed a difference of 3.4 ml/kg/min in VO2 max between the exercise group and the control-group with high intensity CT of 60 min, performed twice a week for 18-weeks, in obese middle-aged women [56]. Batrakoulis, et al. reported that the VO2 max of obese women improved from 26.1 ± 4.4 ml_kg-1_min at baseline to 33.1 ± 4.8 ml_kg-1_min-1 post-intervention following a CT program of higher intensity (≥ 65% of HRR) and of significantly higher volume (40-weeks) compared to the current study [57]. While the increases in VO2 max were higher in the previously mentioned studies, their protocols included longer and more intense sessions for longer period of time. Overall, the results of the current study suggest that the benefits of CT start to appear with significantly lower volume and intensity, suggesting that CT at moderate intensities (50-60% of HRR) might be a time efficient alternative to HIIT or HICT with comparable health benefits and the potential of considerable increase in adherence.
The parameters of the exercise protocol were not sufficient to produce meaningful effects on the body composition variables. A series of meta-analysis [58,59] reported that CT improves body composition in obese/overweight population but the effect varied among the studies. Studies with comparable duration (8-weeks) showed significant improvement in BW, BMI and WHR in obese men [43,60], but no effect on these body composition outcomes in obese women [44]. Moreover, body composition of obese/overweight men was improved after 4-weeks and 12-weeks of HICT (30-mins and 50-min per session respectively) [45,46]. In addition, body composition improved after 8-weeks of moderate CT (60-min per session) in combination to green tea extract supplementation [61] in overweight middle-aged men and after 12-weeks of moderate CT in obese women [62]. Other studies showed that the reduction of BF is greater in obese/overweight population when the exercise lasts for a longer period [63,64] and a substantial weight loss (> 5% reduction of BW) requires an additional dietary intervention [64] or higher energy expenditure (at least 26 MET-hours). Collectively the results of this study, in the light of the previous literature, suggest that body composition might require higher volume and/or intensity or moderate intensity with longer period or with additional nutritional intervention. Realistically though, high intensity exercise, for a long period of time and especially if it is combined with dietary restrictions is often difficult to maintain especially by obese/overweight individuals [65]. An additional consideration that might explain the results of the current study on body composition might be the gender effect. Studies reported that males have a greater BW reduction than females when exercise is of similar duration and rela¬tive intensity [66,67] possibly due to higher baseline values [68]. Most of the studies which showed positive effects of CT in body composition are in men while the current study included both men and women.
CT generally uses body weight resistance exercises and results in an optimal increase of LBM and a reduction of BF due to the increased muscular effort [69]. In this study the change in LBM% was primarily mediated by the reduction of BF as the LBM (Kg) remained unchanged. This result is consistent with Kim, et al. Sadarzade, et al. and Lehnert, et al. who reported a non-significant difference between groups for this variable [62] despite the fact that resistance exercises have high energy demands [70]. The lack of effect in LBM is probably due to insufficient training volume (sets × reps × load), as a clear dose-response relationship exists between number of sets and increase in muscle mass [71].
Research has determined that perceived exertion is a suitable measure of intensity during and following both resistance and aerobic exercise. Participants in the current study showed an increased adaptation to the program as demonstrated by the reduction in OMNI-scale. Although this was not amajor outcome of this study, the decreased rate of perceived exertion is likely to translate in improved functional ability and account for the high adherence and zero dropout rate of the program. Exertion is also influenced by psychological factors and it is strongly correlated with HR [72]. Exercise of sufficient time can affect the parasympathetic system and lead to an increase in stroke volume and a reduction in HR at rest [50]. HR and RPP are good predictors of myocardial oxygen consumption during exercise, reflecting the contractile state of the heart [73]. Findings of this study demonstrated a reduction of RPP in the CT-group compared to the control-group which was accompanied by corresponding changes in HR, SBP, DBP and MAP. Similar results in RPP, have been reported following CT for 12-weeks (at 50-70% of HRR, 3x 40-65 min/week) in obese women [74].
A positive effect in BP at rest can be expected following an aerobic exercise program, however the mechanism is different depending on the exercise variables. Nevertheless, there is no clear minimal dose of exercise for lowering BP or any clear independent effect of the key variables of exercise [64]. It is well established though that BP is decreased due to decreased activity of sympathetic nervous system and decreased peripheral resistance [75]. The observed 7 mmHg decrease in SBP, is consistent with previously published data from a CT study involving obese and in normotensive populations [76]. DBP also improved post-intervention similar to another CT study lasting 12-weeks. It should be highlighted that while these participants were overweight or obese this was a normotensive population and this improvement was not expected, since the physiological response of DBP to dynamic exercise is to maintain baseline levels, which were normal in this case. The decrease in SBP and DBP can potentially be due to a combination of central cardiac and peripheral adaptations. Interval training allows participants to challenge the pumping capability of the heart more than continuous exercise. MAP is a product of cardiac output and systemic vascular resistance. A possible explanation for the 4.5% improvement of MAP, is the lower resting HR post-intervention which can probably be attributed to a combination of an increased vagal tone [77] and a possible increase in plasma volume, leading to increase in stroke volume by the Frank-Starling mechanism [78,79].
The program used in this study utilised a series of several whole-body exercises and resulted in improved isometric muscle strength after only 20-minutes of exercise per session for 16 sessions only on the L side. Since there was no change in LBM (Kg) the improvement in strength was probably be due to neural adaptations. Previous studies showed that HIIT for 8-weeks and CT for 12-weeks increased back strength and grip strength in obese older women [80], middle-aged obese women [57] and female students [62]. Moreover, isometric strength improvements have been reported only in one limb following 12-weeks of CT in overweight women [81], similar to this study. As the majority of our participants were right side dominant (86.67%) and dominant limbs are utilised more during the activities of daily living neural adaptations affected only the non-dominant side [82]. A combination of higher volume or intensity is necessary for true and bilateral strength benefits with concomitant increase in muscle mass.
HDL and LDL lipoproteins are major indicators for the prediction of coronary artery disease [62]. CT-group demonstrated a reduction in LDL by 5 mg/dL, which is consistent with the values reported in a series of meta-analyses by Kelley, et al. who found that routine exercise produced a clinically favourable but insignificant reduction in LDL by 4-6 mg/dL among various adult populations [83,84]. No effect was found in TC, probably due to the high variability of the measurements, which is unfortunate, as lowering TC by as little as 10%, using a dietary or pharmacologic intervention was able to reduce cardiovascular disease incidence by 27% [85]. Other studies reported significant improvements in lipid profile of obese men and overweight/obese women following CT with progressive resistance (3x/week, 65-85% of 1 RM) (Kolahdouzi, et al.) or CT protocols with higher intensities and frequencies [86]. Moreover, studies using HICT of longer duration (12-weeks) and higher frequencies (3x/week) or weekly volume (3x30-min/week) reported improvements in lipid profile of middle-aged overweight [46] and obese men [45]. Although the role of nutrition in overweight and obese population is critical, two large meta-analyses found that HDL significantly improved by exercise even when confounding variables such as diet was considered [87,88]. The lack of significant effect of the current protocol in the biochemical variables might be because their values were normal at baseline which is supported by the results of a similar study by Kim, et al. in obese females. Alternatively, an CT program with higher duration and/or intensity is necessary to induce biochemical adaptations.
The study limitations include the sample size which was small to allow a broader generalisation of the results. In addition, the participants were apparently healthy, so results might not be directly applicable to obese with risk factors or chronic diseases. Moreover, the study was probably underpowered to detect meaningful between group changes in secondary outcomes, as the power analysis was done based on the VO2 peak. Additionally, groups were not balanced in terms of age and gender, with a larger number of obese/overweight women in the CT-group therefore hormonal changes in both men and women [89] might have affected the results. Further, the study did not monitor daily nutrition (apart from the training sessions) and simply asked the participants to continue their normal diet, which might have influenced the results.
In summary, these findings suggest a safe, time-efficient exercise method and the lower end of training variables which are sufficient to promote health benefits in overweight/obese individuals without comorbidities or any other health-related risk factors. The results also suggest that 40-minutes of CT exercise per week, for 8-weeks can improve cardiorespiratory fitness. However additional training volume or more than 8-weeks are required for meaningful improvements in body composition, physiological and biochemical variables. Future studies should control for dietary intake and energy expenditure per day as they may be more important for body composition and lipid profile.