We explored whether High-Intensity Interval Exercise (HIIE) could provide a novel method to test metabolic flexibility during exercise. We also aimed to assess substrate oxidation during HIIE and in response to a high-fat meal to determine if these assessments of metabolic flexibility are influenced by fitness and sex. Fat and carbohydrate oxidation were assessed during HIIE (n = 21) of 4x4:3-min work: recovery (0W) intervals on a cycle ergometer at a power output of halfway between ventilatory threshold and V̇O2peak. A high-fat meal challenge (~ 81%fat) (n = 19) included fasted and postprandial resting metabolic rate. Participants were categorized by sex and fitness status (V̇O2peak: High > 40 ml•kg-1•min-1 vs. low < 40 ml•kg-1•min-1). During HIIE, fat oxidation (g•kg-1) was greater in high fitness (AUC: high: 7.10 (0.04) vs. low: 7.06 (0.01), P = 0.019) and carbohydrate oxidation (g•kg-1) was higher in males (AUC: males: 8.27 (0.14) vs. females: 7.87 (0.15), P ≤ 0.001). There were no fitness status or sex group differences during the high-fat meal challenge for fat or carbohydrate oxidation. However, total grams of fat oxidized (g) during HIIE and the high-fat meal were related (r = 0.631, P = 0.005). Low fit females had poorer metabolic flexibility during HIIE, lower fat oxidation during HIIE (AUC: high fit females 7.10 (0.05) vs. low fit females 7.04 (0.01), P = 0.050) and lower fat oxidation in response to the high-fat meal (AUC: high fit females: 0.59 (0.14) vs. low fit females: 0.33 (0.12), P = 0.030). HIIE may detect metabolic differences associated with training not captured by high- fat meal challenge. Low fitness status negatively impacts metabolic flexibility in response to HIIE, and this effect appears to be more prominent in females.
High-intensity interval exercise, Fat oxidation, Metabolic flexibility, Exercise metabolism, High-fat meal, Substrate oxidation, Sex differences
Metabolic flexibility is the ability to efficiently shift metabolism by substrate sensing, trafficking, storage, and utilization, dependent on availability and demand [1]. Metabolic flexibility is essential for maintaining energy homeostasis in nutrient excess or energy demand and relies on whole-body control between systems such as the endocrine system, muscle tissue, and mitochondria [1,2]. Communication between these systems is vital in maintaining energy balance. Disruptions in metabolic flexibility can have implications for exercise performance and the development of metabolic disease [1-5]. Metabolic flexibility is often examined during hyper insulin emic clamp [6,7], during the transition between fasted and feeding, or in response to acute high fat over-feedings [1,8-10]. High-Intensity Interval Exercise (HIIE) may act as an additional assessment of metabolic flexibility. HIIE is a modality of exercise characterized by relatively short bursts of vigorous activity interspersed with periods of rest or low-intensity exercise for recovery [11,12]. Quickly shifting from vigorous activity to rest may provide a unique stimulus that challenges energy systems to meet energy demands.
Quickly shifting from rest to vigorous activity provides a unique stimulus that challenges skeletal muscle and mitochondria to meet energy demands [1,2]. The ability of skeletal muscle to adjust to substrate demand is a fundamental component of metabolic flexibility [13].
Mechanisms that contribute to metabolic flexibility during exercise are involved in managing body mass, metabolic health, and exercise performance [14]. Aerobic fitness status also plays an important role in metabolic flexibility during feeding [5,15,16]. Due to the direct relationship between physical activity status and improved metabolic flexibility, it seems plausible that one’s response to exercise could add additional insight to one’s metabolic flexibility. Despite the known connection between fitness status and metabolic flexibility, it is unknown if the ability to oxidize fat during the postprandial period and during exercise such as HIIE are related.
Factors such as aerobic fitness status and sex may also influence exercise metabolic flexibility. Individuals with a higher aerobic training status can sustain higher fat oxidation at higher exercise intensities than untrained individuals [17]. Males with higher aerobic fitness status can oxidize more fat during HIIE than males with a low aerobic fitness status [18,19]. However, there are no current data on fitness status differences in females. Additionally, differences in exercise metabolic flexibility have not been tested between sex. Females have reported higher fat oxidation during steady-state exercise than males [20-22]. Therefore, it seems plausible that females may have greater exercise metabolic flexibility than males. HIIE could detect differences in substrate oxidation between sexes. Understanding sex differences in metabolic flexibility during exercise can shed insight into metabolic health and performance outcomes.
Historically, high-intensity exercise to assess substrate oxidation has been avoided due to the accumulation of hydrogen ions above buffering ability, resulting in an elevated carbon dioxide response, thus inflating carbohydrate oxidation rates [23]. However, the assessment of substrate oxidation during high-intensity exercise via indirect calorimetry yields similar results to isotope infusion [23]. Therefore, exercise modalities such as HIIE could be used to assess substrate metabolism changes during exercise without hesitation around their ability to predict O2 uptake and O2/CO2 production accurately.
Assessment of substrate oxidation in response to feeding captures only one dimension of metabolic flexibility. Furthermore, the relationship between exercise metabolism and the postprandial metabolic response has not been established. Therefore, we aimed to assess substrate oxidation during HIIE and in response to a high-fat meal to determine if these assessments of metabolic flexibility are influenced by fitness and sex. We hypothesized that (i) female sex and a higher aerobic fitness status would be associated with higher fat oxidation during the high-fat meal challenge and HIIE, and (ii) capacity to oxidize fat during exercise and postprandial feeding would be related. We also explored whether HIIE could uncover differences in metabolic flexibility among study groups that were not captured by a traditional high-fat meal challenge.
The study was approved by the University of Georgia Institutional Review Board (study no. 286, approved on 19APR2019), with written informed consent obtained prior to any experimental procedures. The study conformed to the standards set by the Declaration of Helsinki, except for registration in a database.
Twenty-two healthy, non-smoking, recreationally active (cardiovascular exercise ≥ 150 min•wk-1 and resistance exercise ≥ 2 h•wk-1) males and females were recruited to the Integrative Cardiovascular Physiology Laboratory for three testing sessions. Participants were free of any cardiovascular, metabolic, or musculoskeletal disease history. Participants were not taking medications that affect metabolism, including hormonal or non-hormonal birth control, or any supplements or vitamins during the study period. For purposes of this study, we operationally categorized fitness and defined “high fitness status” as having a V̇O2peak of ≥ 40 ml•kg-1•min-1 and “low fitness status” as < 40 ml•kg-1•min1. Participants were then further split by fitness status and sex (HFM: high fitness status males; LFM: low fitness status males; HFF, high fitness status females; LFF, low fitness status females).
Participants completed three trials consisting of a baseline testing session followed by a counterbalanced high-fat meal challenge and an HIIE session. The baseline testing session included anthropometrics, body composition, skeletal muscle mitochondrial oxidative capacity test, and V̇O2peak testing. The second session included a high- fat meal challenge and a resting skeletal muscle metabolism assessment. The third session included HIIE. The third session included a high-fat meal challenge and a resting skeletal muscle metabolism assessment. Sessions two and three were randomized. All sessions were separated by > 48 h, and all data collection was completed within two months. Participants refrained from exercise and alcohol ingestion for 24 h before each trial and were fasted overnight for 10-12 h prior to the high-fat meal challenge and HIIE session. Participants were instructed to maintain current dietary habits. Dietary records were collected for three days prior to each session and assessed using the United States Department of Agriculture National Nutrient Database for Standard Reference (http://www.nal.usda.gov/fnic/foodcomp/search/) to ensure that quantity of macronutrients and total energy consumed did not vary significantly between visits. Participants were instructed to consume a standardized pre-fasting meal consisting of 30% predicted resting metabolic rate (50% carbohydrate, 30% fat, and 20% protein) [24]. All female participants completed HIIE and high-fat meal challenge sessions within days 2-10 following the self-reported onset of their menstrual cycle following baseline testing [25].
Participants’ height, weight, body composition (via dual‐ energy X‐ray absorptiometry, Horizon® DXA System, Hologic, Inc., Marlborough, MA, USA), blood pressure, and resting heart were assessed. Skeletal muscle mitochondrial oxidative capacity test and V̇O2peak were performed.
Mitochondrial oxidative capacity was determined by measuring changes in continuous- wave near-infrared spectroscopy (CW-NIRS; PortaMon, Artinis Medical Systems, Einsteinweg, The Netherlands) signals during periods of ischemia, as previously described [26]. To measure the recovery rate of resting skeletal muscle metabolism back to resting levels, four mitochondrial oxidative metabolism tests were performed consisting of six brief occlusions (5s on/5s off of 250-300 mmHg) following 30s of muscular twitch by stimulation. Briefly, each participant laid supine on a table with a CW-NIRS optode fixed to their Vastus Lateralis and secured using elastic tape. The muscle was per cutaneously stimulated proximal and distal to the CW-NIRS optode with a rapid inflating blood pressure cuff (Hokanson SC12; D.E. Hokanson Inc., Bellevue, WA) placed proximal to the CW-NIRS optode. V̇O2peak was measured via a ramp protocol on an electromagnetically braked cycle ergometer (Lode Excalibur Sport, Groningen, Netherlands). Participants were fitted with a mask to collect respiratory gasses via indirect calorimetry (True One 2400, Parvo Medics, Sandy, UT, USA). Participants completed a warm up by cycling for 3-minutes at 20 watts (W), after which the work rate increased by 20 W/min until volitional fatigue or participants could no longer sustain a cadence of ≥ 60 revolutions per min. V̇O2peak was confirmed by a respiratory exchange ratio of ≥ 1.10, Rating of Perceived Exertion (RPE) ≥ 18/20, and blood lactate ≥ 7 mmol assessed via finger stick (Lactate Plus, Nova Biomedical).
Participants arrived at the laboratory in the morning, following an overnight fast (10-12 h) to undergo a high-fat meal challenge as previously described [27]. Upon arrival, a fasting resting metabolic rate (RMR, kcal•day−1) assessment was performed. Participants were instructed to remain motionless without sleeping in a supine position for 20 min while a plastic hood was placed over their head to measure respiratory gases (True One 2400, Parvo Medics, Sandy, UT, USA). Participants then ingested a high-fat meal consisting of 0.5 g carbohydrate, 1.3 g fat, and 0.2 g protein standardized per kg of fat-free mass (∼ 13.79% carbohydrate, 80.69% fat, and 5.52% protein) [27]. Postprandial RMR was measured for 20 minutes immediately (30 min) and every 30 min during the 4h postprandial period.
Resting skeletal muscle metabolism (mV̇O2) was assessed during the high-fat meal challenge session in a subset of 12 participants (M9/F3; 22 years, 176.08 (0.28) cm, 78.5 (0.28) kg). Resting skeletal muscle metabolism of the vastus lateralis was determined by measuring changes in CW-NIRS (PortaMon, Artinis Medical Systems, Einsteinweg, Netherlands) signals during 30 second periods of ischemia from a rapid inflating blood pressure cuff (Hokanson SC12; D.E. Hokanson Inc., Bellevue, WA). CW-NIRS device was placed on the Vastus Lateralis, approximately 2/3 of the way down from the greater trochanter to the patella and secured using elastic pre-wrap and an elastic bandage to reduce transient light. After each resting skeletal muscle metabolism assessment, three ischemic cuffs were completed (30 seconds on, 90 seconds off with an occlusion pressure of 250-300 mmHg).
Participants arrived at the laboratory in the morning after an overnight fast (10-12h) to undergo an HIIE session. Participants were fitted with a mask to collect respiratory gasses for analysis via indirect calorimetry (True One 2400, Parvo Medics, Sandy, UT, USA). Exercise was performed on an electromagnetically braked cycle ergometer pre-programmed to the previously determined power output (Lode Excalibur Sport, Groningen, the Netherlands). After 3 min of seated rest, a 3 min warm up at 50W was performed. High-intensity intervals were four minutes long at an individualized intensity of the halfway point between the gas exchange threshold and V̇O2peak. The v-slope method was used to determine the gas exchange threshold and independently verified by two study team members, as previously described [28]. Low intervals were three minutes of seated rest (0W). Participants were asked to maintain a cadence of ≥ 60 RPM across all intervals. If a participant could not sustain ≥ 60 RPM power output, it was decreased in 5W increments till the participant could complete the work. Seated recovery was assessed for 20 min post-exercise. Blood lactate via finger stick and RPE were collected following each interval and every five minutes during recovery.
For the mitochondrial oxidative capacity test, CW-NIRS signals were analyzed using Matlab-based analysis software MATLAB® R2018b (Math Works Inc., Natick, MA). A rate constant for the return of resting skeletal muscle metabolism (muscle oxygen uptake) to resting levels was calculated previously described [26].
For the high-fat meal challenge, 20 minutes of respiratory gases were collected, but only the final 15 min of data was used to calculate RMR using the Weir equation [29] and macronutrient oxidation using equations developed by Frayn [30]: fat (g•min-1) = [1.67 x VO2 (l min-1)] – [1.67 x VCO2 (l min-1)], and carbohydrate (g min-1) = [4.55 x VCO2 (l min-1)] – [3.21 x VO2 (l min-1)]. The first 5 min of each 20 min test was discarded to ensure analysis of steady- state metabolic data.
For the resting skeletal muscle metabolism tests, data were analyzed using Matlab-based analysis software MATLAB® R2018b (MathWorks Inc., Natick, MA). The slope of CW-NIRS signals was calculated to estimate resting metabolism following occlusion [31]. The average slope (OD•sec-1) of the three cuffs was recorded.
For HIIE sessions, macronutrient oxidation rates were averaged for the duration of each interval. Total grams of substrate oxidized were calculated by multiplying the rate of substrate oxidation by time duration and summed for total exercise (high interval 1, 2, 3, and 4), recovery (low 1, 2, 3, 4, and recover 5-20 min), and full session. Rate of substrate oxidation was multiplied by time during individual high intervals and recovery to estimate total amount of respective substrate oxidized. Changes in rate of fat oxidation (g•kg-1•min-1) during high-intensity intervals (Δ) were calculated by subtracting the lowest oxidation value from the highest oxidation value achieved from each participant during exercise intervals (high 1, 2, 3, and 4). Due to the contribution of bicarbonate and hydrogen buffering that occurs during exercise and may impact V̇CO2 values during exercise, a small subset of data was analyzed using equations developed by Jeukendrup, et al. [32] for exercise intensities between 50-75% V̇O2peak [32]. Owing to the lack of equations for very high intensity (85-95% V̇O2max), Frayn, et al. equations slightly inflate absolute carbohydrate oxidation; however, this difference was not apparent when controlling for body weight or fat-free mass. Therefore all data analysis was conducted using Frayn equations [18]. Substrate oxidation analyses were analyzed with data expressed relative to total body weight (g•kg-1•min-1). Importantly, indirect calorimetry has been established as a valid technique for quantifying substrate oxidation during exercise during high-intensity exercise, up to ~ 80-85% V̇O2max [28].
A two-way repeated-measures ANOVA was conducted to assess the statistical significance of time (HIIE or high-fat meal) and group (Fitness Status and Sex) (Time*Fitness*Sex) on fat oxidation, carbohydrate oxidation, blood lactate, metabolic flexibility, and postprandial resting muscle metabolism. Fat oxidation, carbohydrate oxidation, and lactate Area Under the Curves (AUC) were calculated using the trapezoid rule [33]. Student’s paired t-test was used to compare total fat and carbohydrate oxidized calculations, total fat and carbohydrate oxidation AUC, lactate AUC and all group characteristics. Pearson’s correlation coefficient was used to determine correlations between V̇O2peak, skeletal muscle mitochondrial oxidative capacity, postprandial fat oxidation and exercise fat oxidation. Assumptions of normality were verified for all outcome measures. Statistical significance was accepted at P ≤ 0.05. Data are presented as means (SD). All statistical analyses were performed with SPSS Statistics version 25.0 (IBM Corp., Armonk, NY, USA).
Twenty-two participants were recruited and completed the study (Table 1). Twenty-one participants completed the HIIE session, nineteen the high-fat meal challenge, and thirteen the resting skeletal muscle metabolism assessment. Two participants did not complete all sessions due to personal reasons. Two were unable to complete testing due to the University’s cessation of all non-essential research activities during the COVID-19 pandemic. All data were included in the final analysis. Males were taller (P = 0.001), weighed more (P = 0.001), had more fat free mass (P = 0.001), less body fat (P = 0.001) and a greater waist to hip circumference than females (P = 0.001). High fitness individuals had less fat mass (P = 0.024), less visceral adipose tissue (P = 0.027), a greater V̇O2peak (P = 0.001) and greater mitochondrial capacity than low fitness individuals (P = 0.040). HFM had less fat mass (P = 0.042), less visceral adipose tissue (P = 0.045) and a greater V̇O2peak (P = 0.001) than LFM. HFF had lower body fat (P = 0.012) and a higher V̇O2peak (P = 0.002) than LFF. All participant characteristics are presented in Table 1. Participants all consumed a similar diet across all trials (energy: 2101.40 (898.10) kcal; carbohydrate: 237.36 (95.36) g; protein: 119.78 (51.60) g; fat: 74.76 (34.46) g).
Table 1: Participant characteristics. View Table 1
The high fat meal had a significant effect on relative fat oxidation (g•kg-1•min-1; ANOVA: Time, P = 0.015, ηp2 = 0.842, Figure 1, Figure 2, Figure 3) and relative carbohydrate oxidation (g•kg-1•min-1; ANOVA: Time, P ≤ 0.001, ηp2 = 0.946, Figure 1, Figure 2, Figure 3).
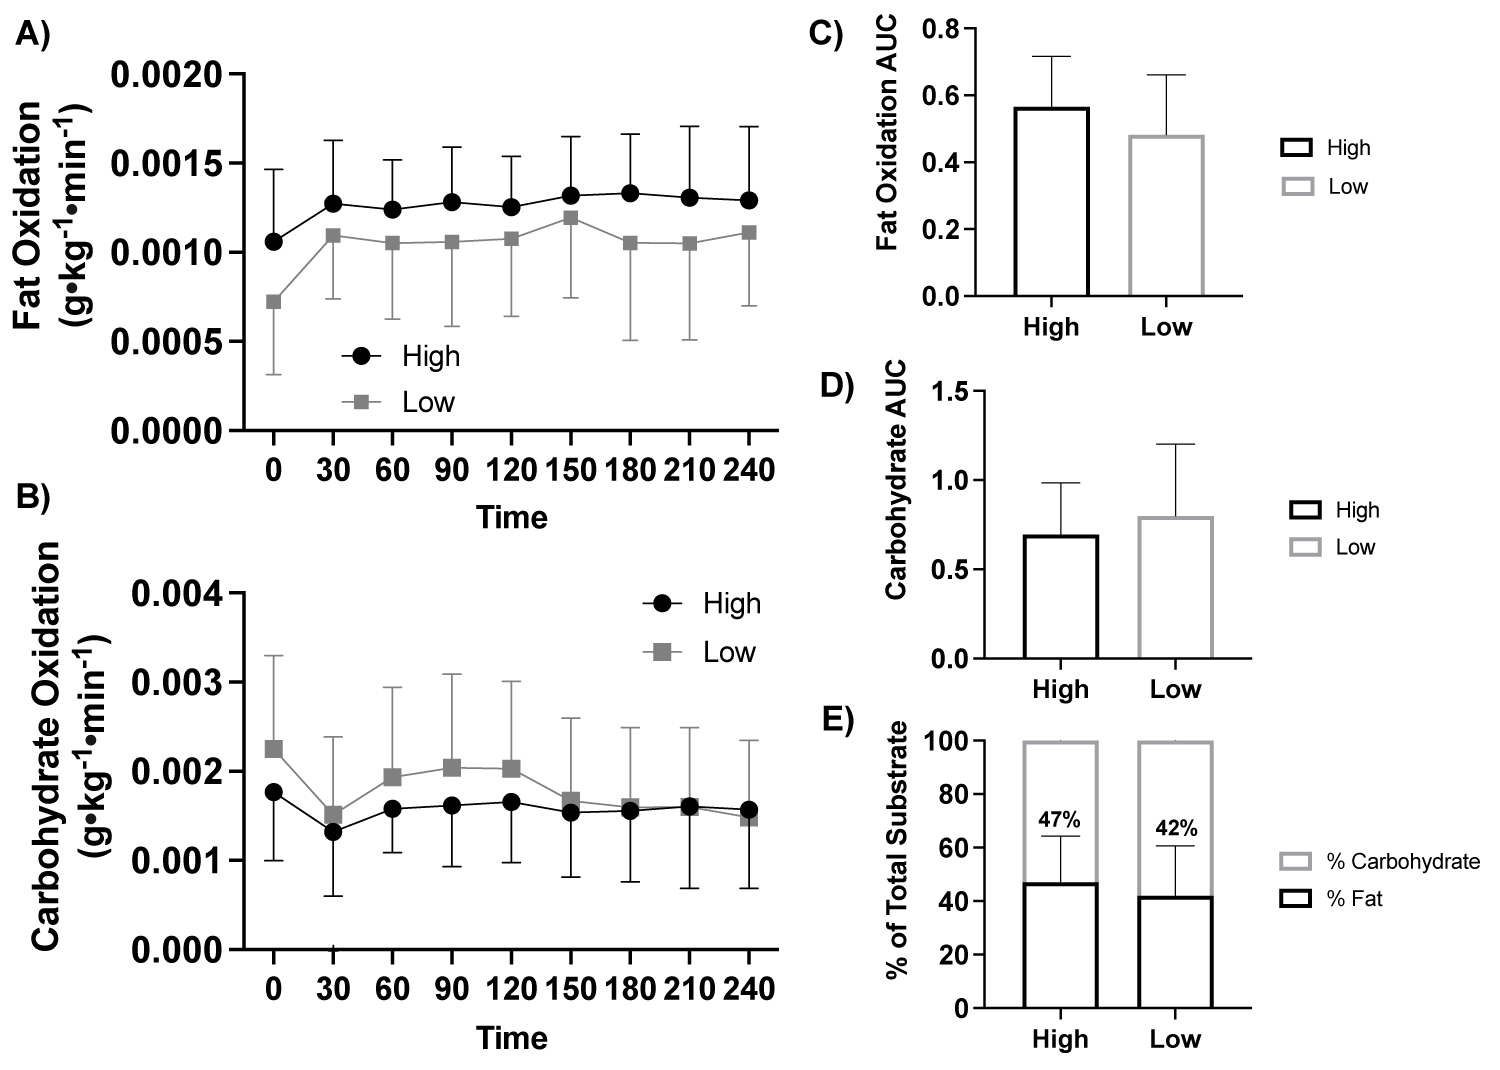 Figure 1: Fat and carbohydrate oxidation response to a high-fat meal by fitness status.
Note: A) Fat oxidation (g•kg-1•min-1) in response to a high-fat meal between fitness status (ANOVA: Time, P = 0.015, ηp2 = 0.842, n = 19), B) Carbohydrate oxidation (g•kg-1•min-1) in response to a high-fat meal between fitness status (ANOVA: Time, P ≤ 0.001, ηp2 = 0.946, n = 19), C) Fat oxidation AUC (Student t-test: P = 0.415, High: n = 10 vs. Low: n = 9), D) Carbohydrate oxidation AUC (Student t-test: P = 0.690, High: n = 10 vs. Low: n = 9), and E) Percent (%) of total substrate oxidation contribution (Student t-test: P > 0.05, High: n = 10 vs. Low: n = 9). High, high fitness status; Low, low fitness status; AUC, area under the curve.
View Figure 1
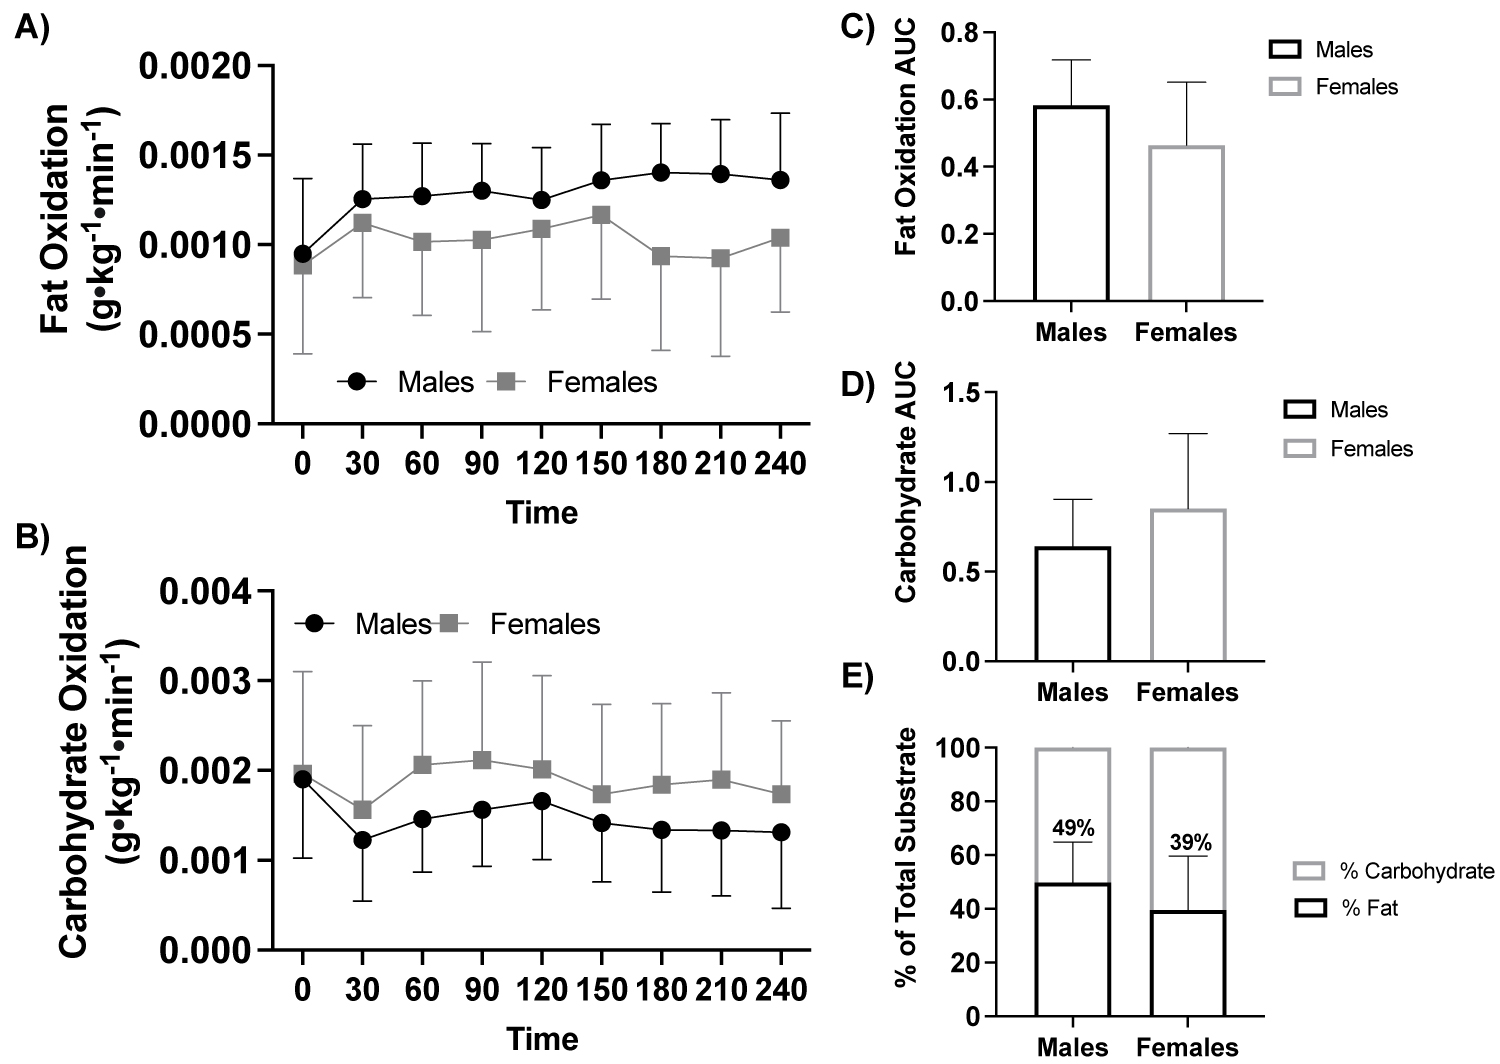 Figure 2: Fat and carbohydrate oxidation response to a high-fat meal by sex.
Note: A) Fat oxidation (g•kg-1•min-1) in response to a high-fat meal between sex (ANOVA: Time, P = 0.015, ηp2 = 0.842, n = 19), B) Carbohydrate oxidation (g•kg-1•min-1) in response to a high- fat meal between sex (ANOVA: Time, P ≤ 0.001, ηp2 = 0.946, n = 19), C) Fat oxidation AUC (Student t-test: P = 0.127, Males: n = 10 vs. Females: n = 9), D) Carbohydrate oxidation AUC (Student t-test: P = 0.194, Males: n = 10 vs. Females: n = 9), and E) Percent (%) of total substrate oxidation contribution (Student t-test: P > 0.05, Males: n = 10 vs. Females: n = 9).
AUC, area under the curve.
View Figure 2
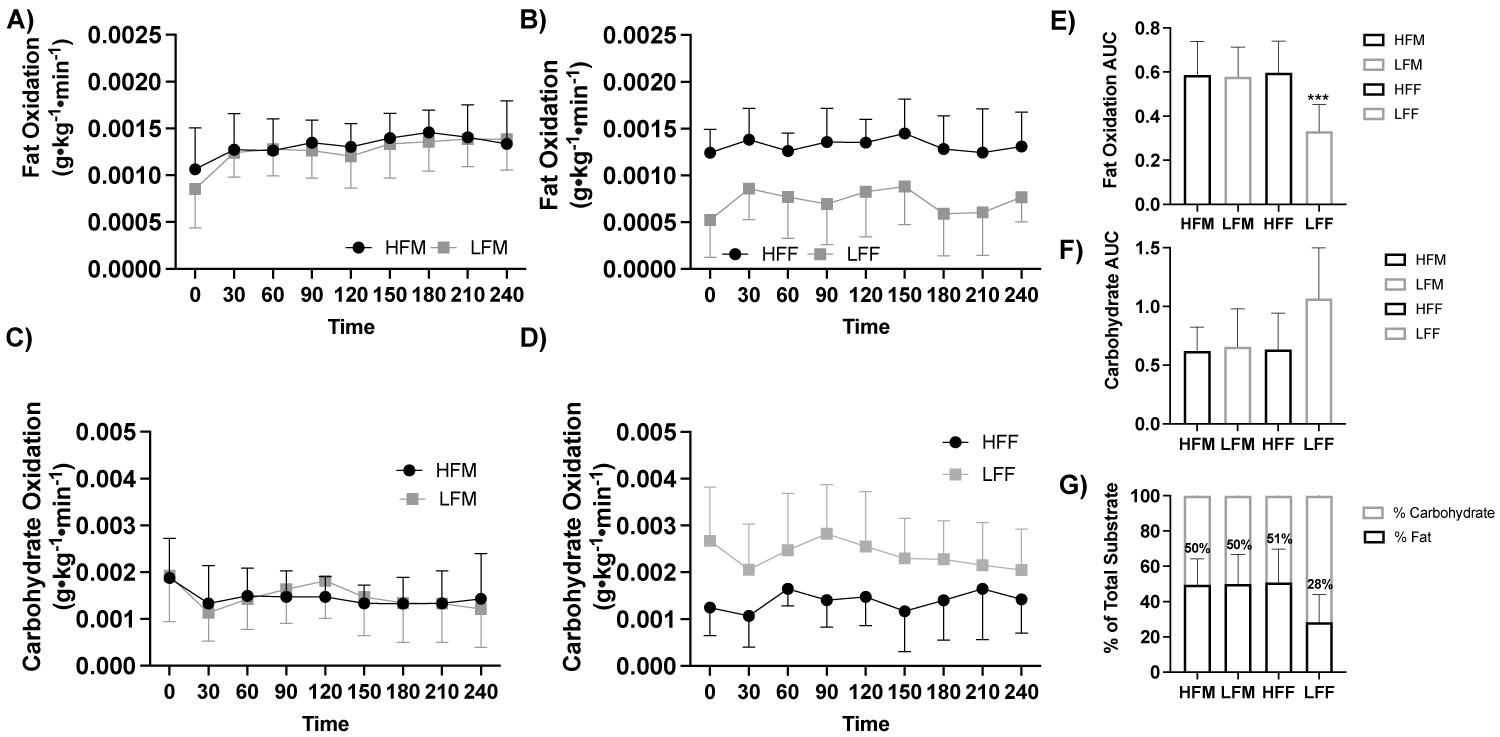 Figure 3: Fat and carbohydrate oxidation response to a high-fat meal by fitness and sex.
Note: A) Fat oxidation (g•kg-1•min-1) in response to a high-fat meal between males (ANOVA: Time, P = 0.015, ηp2 = 0.842, n = 19), B) Fat oxidation (g•kg-1•min-1) in response to a high-fat meal between females (ANOVA: Time, P = 0.015, ηp2 = 0.842, n = 19), C) Carbohydrate oxidation (g•kg-1•min-1) in response to a high-fat meal between males (ANOVA: Time, P ≤ 0.001, ηp2 = 0.946, n = 19), D) Carbohydrate oxidation (g•kg-1•min-1) in response to a high-fat meal between females (ANOVA: Time, P ≤ 0.001, ηp2 = 0.946, n = 19), E) Fat oxidation AUC (Student t-test: P ≤ 0.05, HFM: n = 5; LFM: n = 5; HFF: n = 5; LFF: n = 4), F) Carbohydrate oxidation AUC (Student t-test: P > 0.05, HFM: n = 5; LFM: n = 5; HFF: n = 5; LFF: n = 4), and G) Percent (%) of total substrate oxidation contribution (Student t-test: P > 0.05, HFM: n = 5; LFM: n = 5; HFF: n = 5; LFF: n = 4). HFF, high fit males; LFM, low fit males; HFF, high fit females; LFF, low fit females; AUC, area under the curve. ***P ≤ 0.05 LFF vs All other groups.
View Figure 3
With participants assessed based on fitness status (high, n = 10 vs. low, n = 9) there was no effect of fitness status on fat oxidation (ANOVA: Group, P = 0.332, ηp2 = 0.063, Figure 1a) or carbohydrate oxidation (ANOVA: Group, P = 0.653, ηp2 = 0.014, Figure 1b). There were no differences in fat oxidation AUC (P = 0.415) or carbohydrate oxidation AUC (P = 0.690) between groups, Figure 1c, Figure 1d.
With participants assessed based by sex (male, n = 10 vs. female, n = 9) there was no effect of sex on fat oxidation (ANOVA: Time, P = 0.248, ηp2 = 0.088, Figure 2a), or carbohydrate oxidation (ANOVA: Time, P = 0.329, ηp2 = 0.063, Figure 2b). There were no differences between groups for carbohydrate AUC (P = 0.194) or fat oxidation AUC (P = 0.127), Figure 2c, Figure 2d, Figure 2e.
With participants assessed based on fitness status and sex (HFM, n = 5, LFM, n = 5, HFF, n = 5, LFF, n = 4), there was no effect of fitness and sex fat oxidation (g•kg-1•min-1; ANOVA: Group*Group P = 0.116, ηp2 = 0.156, Figure 3a, Figure 3b) or carbohydrate oxidation (ANOVA: Group*Group, P = 0.183, ηp2 = 0.115, Figure 3c, Figure 3d). Fat oxidation AUC was lower in LFF compared to HFM (P = 0.030), LFM (P = 0.036), and HFF (P = 0.030), Figure 3e, Figure 3f, Figure 3g.
There was a significant time effect of HIIE on relative fat oxidation (g•kg-1•min-1; ANOVA: Time, P = 0.002, ηp2 = 0.990, Figure 4, Figure 5, Figure 6) and relative carbohydrate oxidation (g•kg-1•min-1; ANOVA: Time, P = 0.002, ηp2 = 0.991, Figure 4, Figure 5, Figure 6), but not blood lactate (mmol•L-1; ANOVA: Time, P = 0.099, ηp2 = 0.955, Supplemental Figure 1).
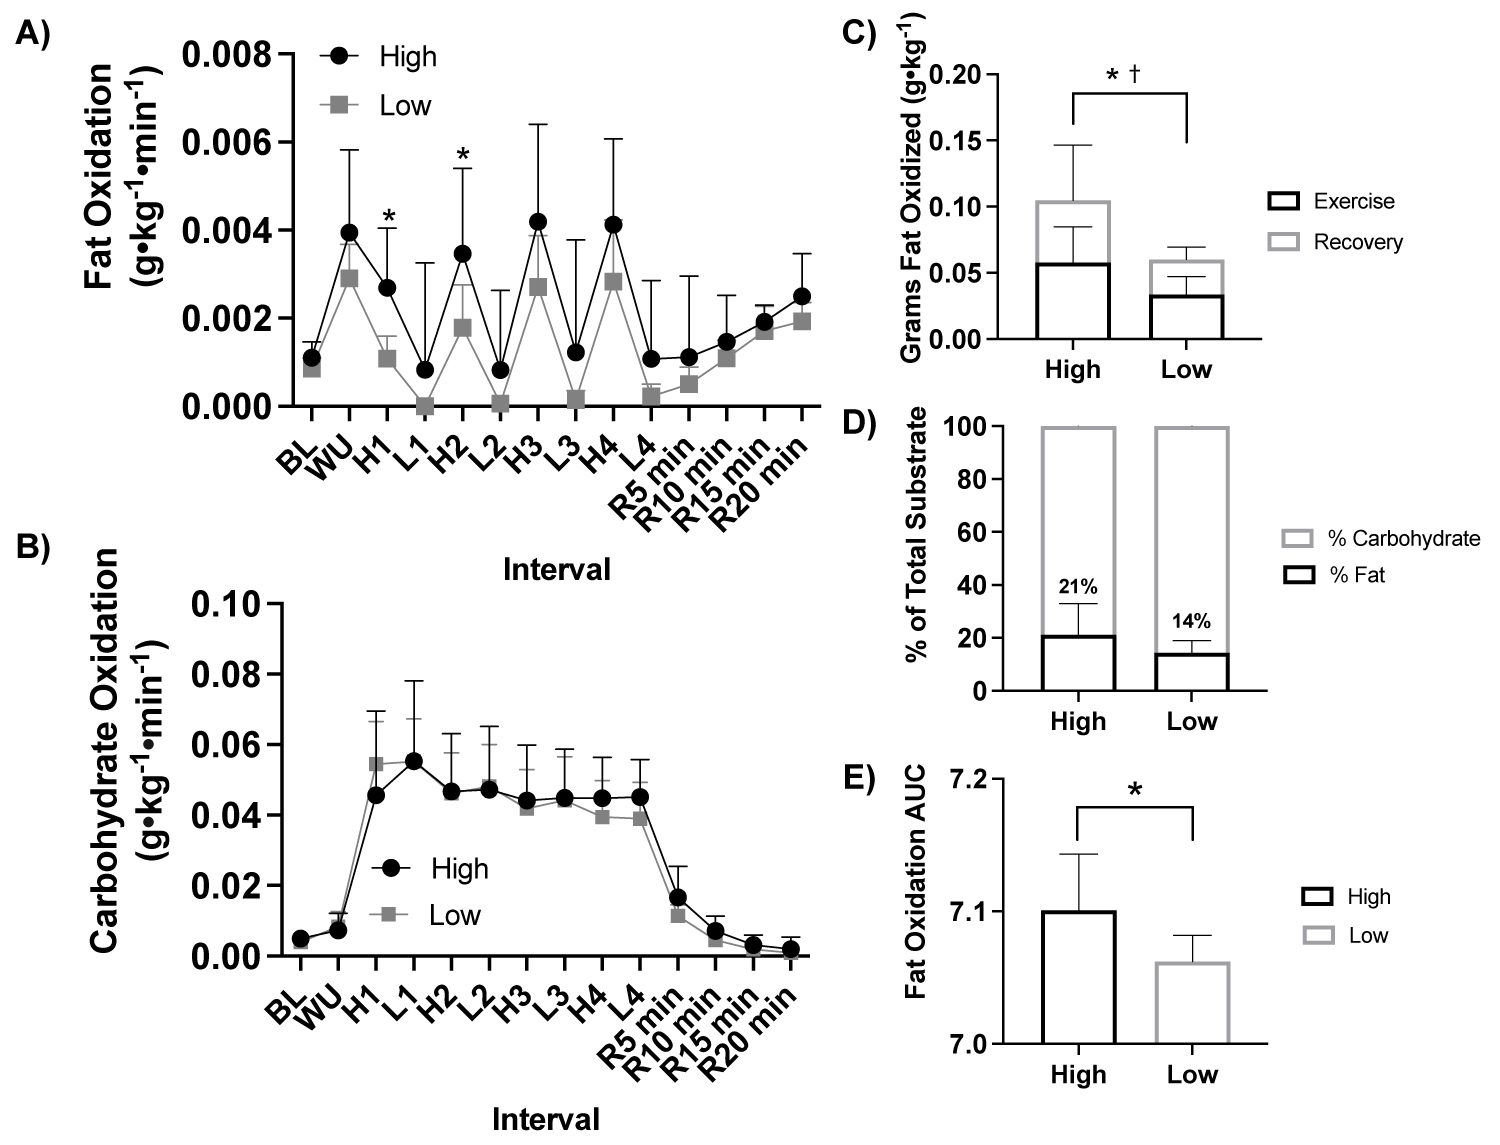 Figure 4: Fat and carbohydrate oxidation response to HIIE by fitness status.
Note: A) Fat oxidation (g•kg-1•min-1) response during HIIE between fitness status (ANOVA: Time, P = 0.002, ηp2 = 0.990; Group, P = 0.029, ηp2 = 0.264, n = 21), B) Carbohydrate oxidation (g•kg-1•min-1) response during HIIE between fitness status (ANOVA: Time, P = 0.002, ηp2 = 0.991; Group, P = 0.362, ηp2 = 0.052, n = 21), C) Total grams of fat oxidized (g•kg-1) during HIIE between fitness status stratified by during the exercise and recovery (Student t-test: P = 0.019, high fitness status n = 11 vs. low fitness status n = 10), D) Percent of total substrate oxidation contribution during HIIE between fitness status (Student t-test: P > 0.05, high fitness status n = 11 vs. low fitness status n = 10), and E) Fat oxidation AUC during HIIE between fitness status (Student t-test: P = 0.017, high fitness status n = 11 vs. low fitness status n = 10). HIIE, high- intensity interval exercise; BL, baseline, WU, warm up; H1-4, high intensity intervals 1-4; L1-4, low intensity intervals; R5-15, post exercise recovery minutes 5-15; high, high fitness status; low, low fitness status; AUC, area under the curve. *P ≤ 0.05 high vs. low exercise. † ≤ 0.05 high vs. low recovery.
View Figure 4
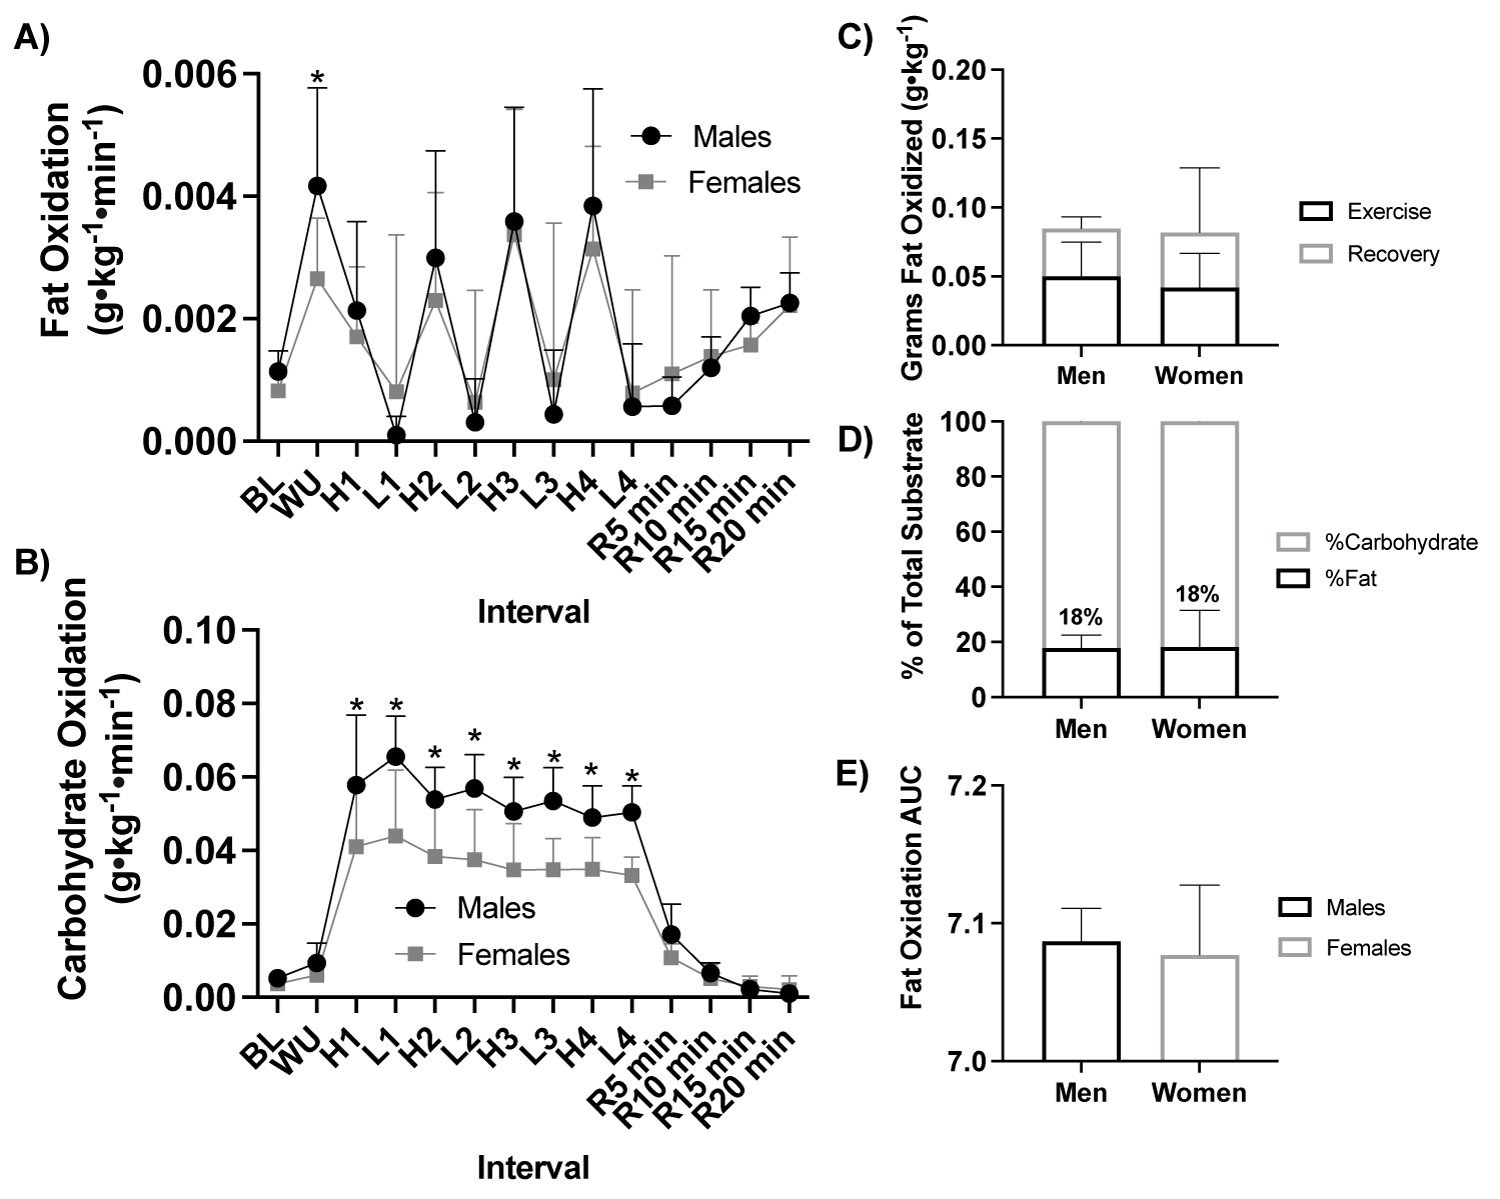 Figure 5: Fat and carbohydrate oxidation response to HIIE by sex.
Note: A) Fat oxidation (g•kg-1•min-1) response during HIIE between fitness status (ANOVA: Time, P = 0.002, ηp2 = 0.990; Group, P = 0.833, ηp2 = 0.003, n = 21), B) Carbohydrate oxidation (g•kg-1•min-1) response during HIIE between fitness status (ANOVA: Time, P = 0.002, ηp2 = 0.991; Group, P ≤ 0.001, ηp2 = 0.576, ηp2 = 0.576, n = 21), C) Total grams of fat oxidized (g•kg-1) during HIIE stratified by during the exercise and recovery (Student t-test: P > 0.05, males: n = 11 vs. females: n = 10), D) Percent (%) of total substrate oxidation contribution (Student t-test: P > 0.05, males: n = 11 vs. females: n = 10), and E) Fat oxidation AUC (Student t-test: P > 0.05, ales: n = 11 vs. females: n = 10). HIIE, high-intensity interval exercise; BL, baseline, WU, Warm up; H1-4, high intensity intervals 1-4; L1-4, low intensity intervals; R5-15, post exercise recovery minutes 5-15; AUC, area under the curve. *P ≤ 0.05 Males vs Females.
View Figure 5
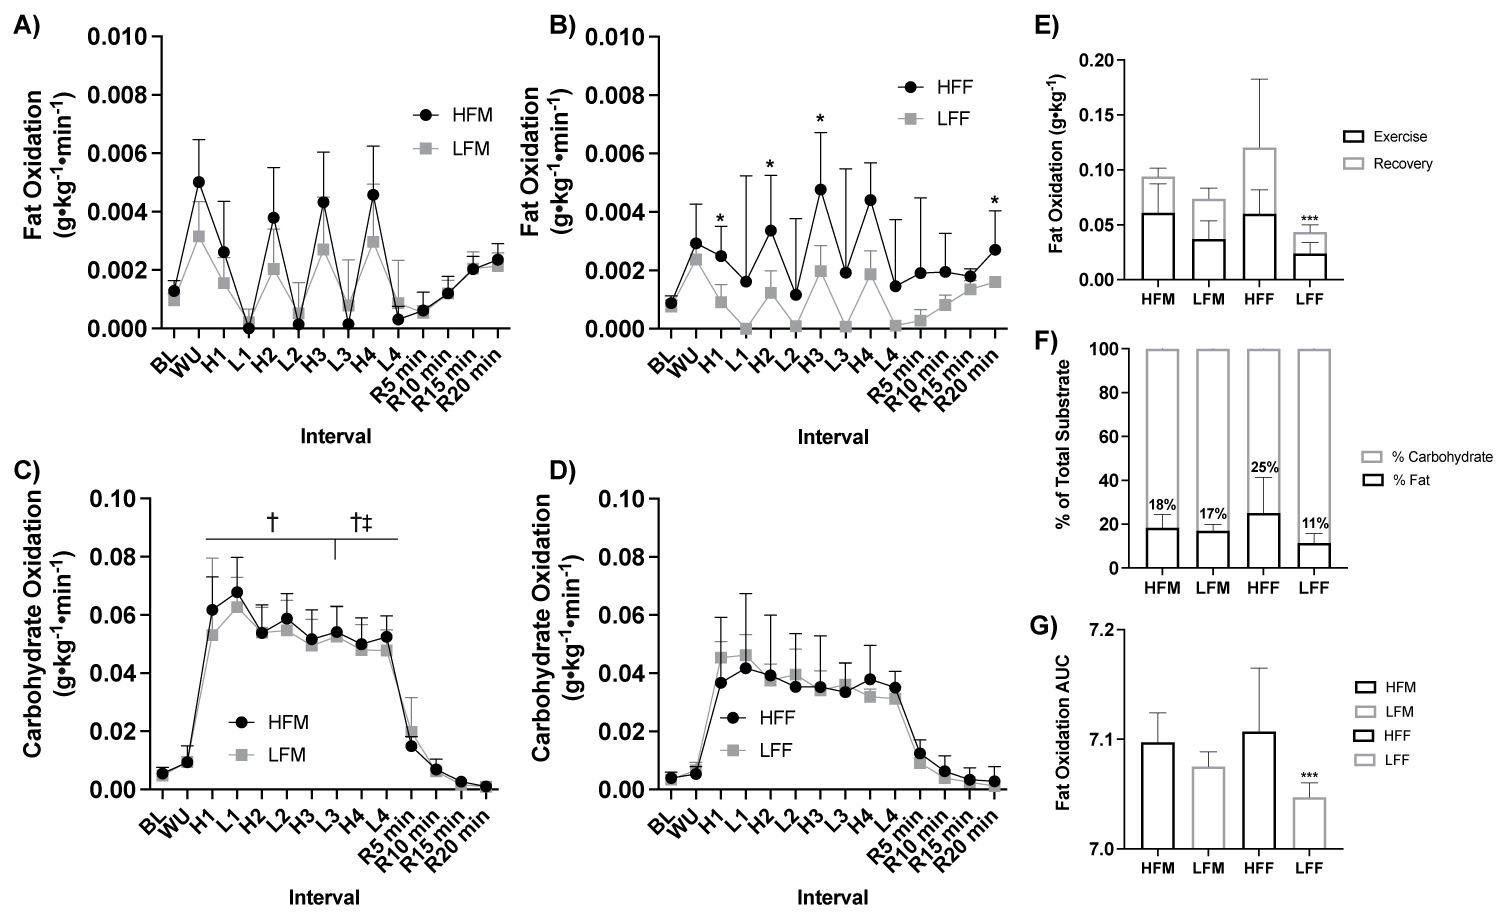 Figure 6: Fat and carbohydrate oxidation response to HIIE by sex and fitness status.
Note: A) Fat oxidation (g•kg-1•min-1) response during HIIE between fitness status in males (ANOVA: Time, P = 0.002, ηp2 = 0.990; Group, P = 0.523, ηp2 = 0.026, n = 11), B) Fat oxidation (g•kg-1•min-1) response during HIIE between fitness status in females (ANOVA: Time, P = 0.002, ηp2 = 0.990; Group, P = 0.017, ηp2 = 0.308, n = 10), C) Carbohydrate oxidation (g•kg-1•min-1) response during HIIE between fitness status by males (ANOVA: Time, P = 0.002, ηp2 = 0.991; High Fitness Group*Group, P ≤ 0.001, ηp2 = 0.493; Low fitness: ANOVA: Group*Group, P = 0.016, ηp2 = 0.312, n = 21), D) Carbohydrate oxidation (g•kg-1•min-1) response during HIIE between fitness status by females (ANOVA: Time, P = 0.002, ηp2 = 0.991; High Fitness Group*Group, P ≤ 0.001, ηp2 = 0.493; Low fitness: ANOVA: Group*Group, P = 0.016, ηp2 = 0.312, n = 21), E) Total grams of fat oxidized (g•kg-1) during HIIE stratified by during the exercise and recovery (Student t-test: P ≤ 0.05, HFM: n = 6; LFM: n = 5; HFF: ηp2 = 6; LFF: n = 5), F) Percent (%) of total substrate oxidation contribution (Student t-test: P > 0.05, HFM: n = 6; LFM: n = 5; HFF: n = 6; LFF: n = 5), and G) Fat oxidation AUC (Student t-test: P ≤ 0.05, HFM: n = 6; LFM: n = 5; HFF: n = 6; LFF: n = 5). HIIE, high-intensity interval exercise; BL, baseline, WU, warm up; H1-4, high intensity intervals 1-4; L1-4, low intensity intervals; R5-15, post exercise recovery minutes 5-15; HFF, high fit males; LFM, low fit males; HFF, high fit females; LFF, low fit females; AUC, area under the curve. *P ≤ 0.05 HFF vs. LFF. ***P ≤ 0.05 LFF vs All other groups. † *P ≤ 0.05 HFM vs. HFF; ‡ LFM vs, LFF.
View Figure 6
With participants were assessed based on fitness status (high, n = 11 vs. low, n = 10) there was a significant effect of fitness status on relative fat oxidation (ANOVA: Group, P = 0.029, ηp2 = 0.264, Figure 4a), but not carbohydrate oxidation (ANOVA: Group, P = 0.362, ηp2 = 0.052, Figure 4b) or blood lactate (ANOVA: Group, P = 0.291, ηp2 = 0.079, Supplemental Figure1). Fat oxidation was greater in high fitness status at High 1 (P = 0.008) and High 2 (P = 0.048) compared to low fitness status, Figure 4a. High fitness status oxidized more fat (g•kg-1) in response to HIIE during exercise and recovery (P = 0.019, Figure 4c) and exercise alone (P = 0.019, Figure 4d) and had a greater fat oxidation AUC (P = 0.017, Figure 4e) compared to low fitness status.
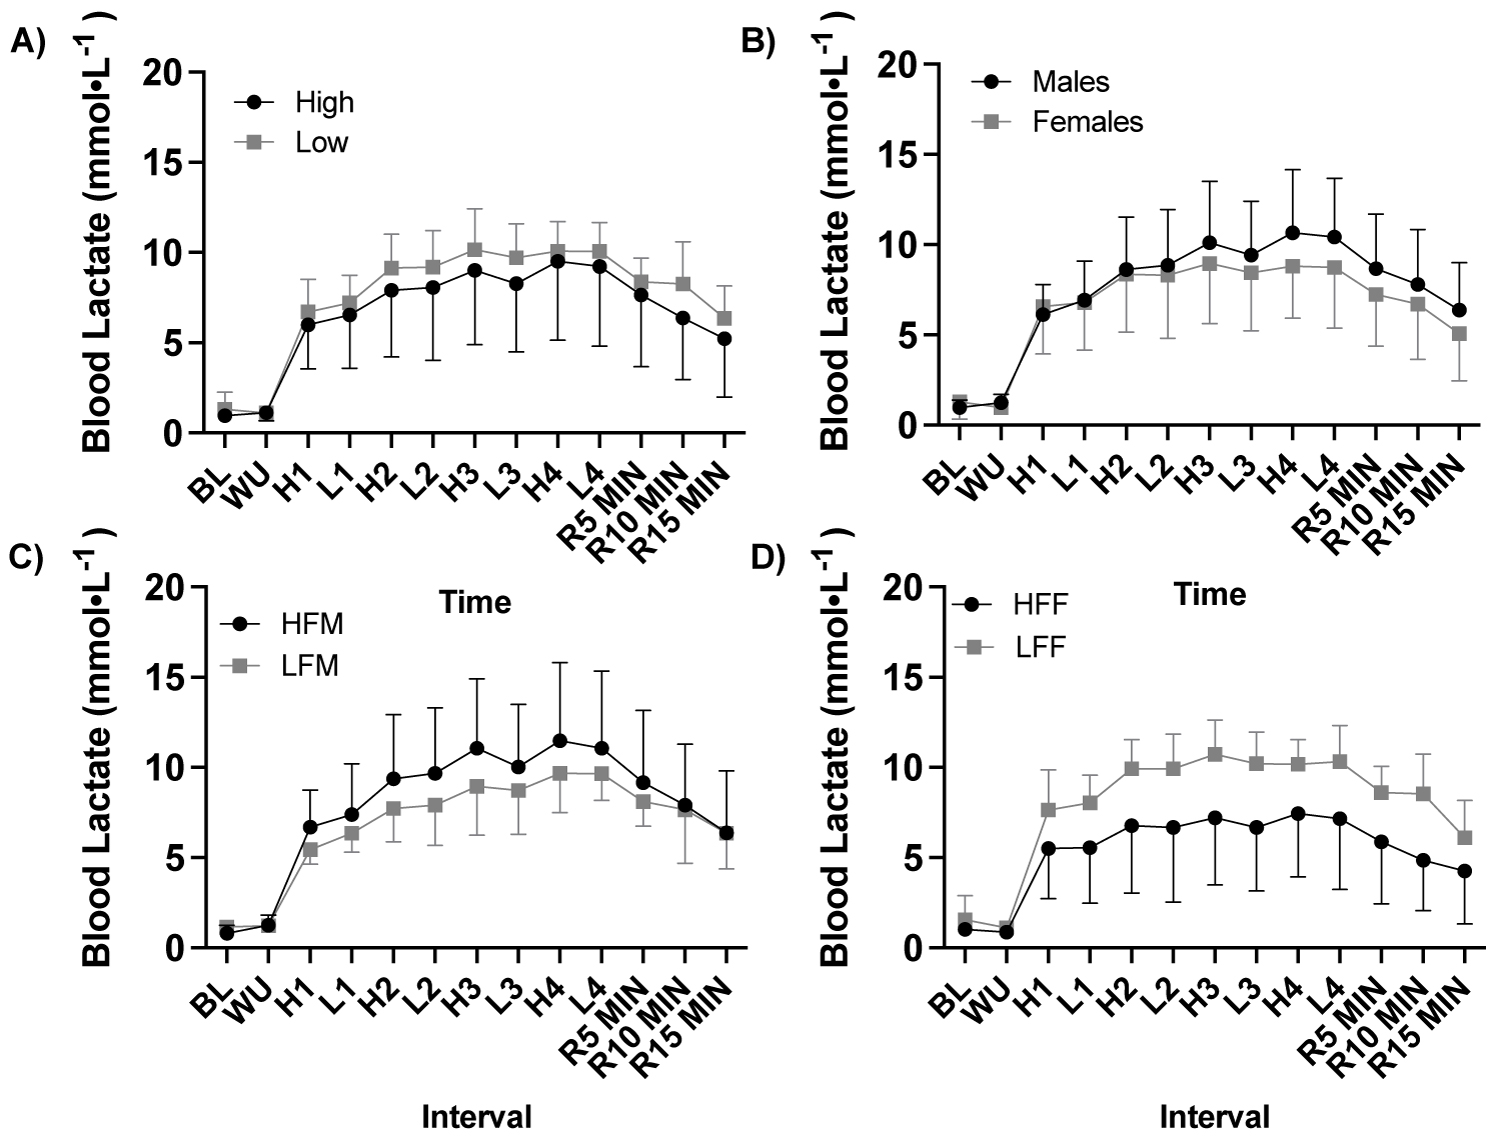 Supplemental Figure 1: Blood lactate response to a high-intensity interval exercise session by fitness and sex.
Note: A) Blood lactate (mmol•L-1) response to HIIE by fitness (ANOVA: Time, P = 0.099, ηp2 = 0.955, n = 21), B) Blood lactate (mmol•L-1) response to HIIE by sex (ANOVA: Time, P = 0.099, ηp2 = 0.955, n = 21), C) Blood lactate (mmol•L-1) response to HIIE among males (ANOVA: Time, P = 0.099, ηp2 = 0.955, n = 11), and D) Blood lactate (mmol•L-1) response to HIIE among females (ANOVA: Time, P = 0.099, ηp2 = 0.955, n = 10). HIIE, high intensity interval exercise; High, high fitness; Low, low fitness; HFM, high fitness males; LFM, low fitness males; HFF, high fitness females; LFF, low fitness females; BL, baseline, WU, warm up; H1-4, HIIE 1-4; L1-4, low intensity intervals; R5-15, post exercise recovery minutes 5-15.
View Figure 1
With participants assessed based by sex (male, n = 11 vs. female, n = 10) there was a significant effect of sex on carbohydrate oxidation (ANOVA: Group, P ≤ 0.001, ηp2 = 0.576, Figure 5a), but not fat oxidation (g•kg-1•min-1; ANOVA: Group, P = 0.833, ηp2 = 0.003, Figure 5b) or blood lactate (mmol•L-1; ANOVA: Group, P = 0.446, ηp2 = 0.042, Supplemental Figure 1).
Males had a higher rate of carbohydrate oxidation than females across all high and low intervals (P > 0.050, Figure 5b, Figure 5c, Figure 5d, Figure 5e).
With participants assessed based on fitness status and sex (HFM n = 6, LFM n = 5, HFF n = 6, and LFF n = 5), there was a significant effect of fitness status on fat oxidation in females (ANOVA: Group, P = 0.017, ηp2 = 0.308, Figure 6a), but not males (ANOVA: Group, P = 0.523, ηp2 = 0.026, Figure 6b). There was a significant effect of fitness and sex on carbohydrate oxidation (High fitness status: ANOVA: Group*Group, P ≤ 0.001, ηp2 = 0.493; Low fitness status: ANOVA: Group*Group, P = 0.016, ηp2 = 0.312, Figure 6c, Figure 6d). HFF had greater fat oxidation at High 1 (P = 0.046), High 2 (P = 0.034), High 3 (P = 0.036), and at recovery 20 min (P = 0.021) compared to LFF, Figure 6b. HFM had a higher rate of carbohydrate oxidation across all high and low intervals compared to HFF (P > 0.05, Figure 2), Figure 6c, Figure 6d. LFM had a higher rate of carbohydrate oxidation at Low 3 (P = 0.010), High 4 (P = 0.029), and Low 4 (P = 0.002) compared to LFF, Figure 6c, Figure 6d. LFF had a lower total fat oxidation (g•kg-1) during exercise and recovery (P = 0.009) and exercise alone (P = 0.050) and fat oxidation AUC (P = 0.050) compared to HFF, and compared to HFM and LFM (P ≤ 0.05), Figure 6e. Fat oxidation AUC was significantly lower in LFF than HFF (P = 0.009, Figure 6f) and HFM and LFM (P ≤ 0.05, Figure 6g). Difference in the total change in rate of fat oxidation (Δ) during high-intensity exercise intervals were significantly greater in HFM than LFM at all high-intensity intervals (P ≤ 0.050), HFF than LFF at High 1 (P = 0.036) and High 3 (P = 0.011) and elevated at High 2 (P = 0.066), HFM than LFF across all time points (P ≤ 0.05), and HFF than LFM at High 1 (P = 0.030), Figure 7.
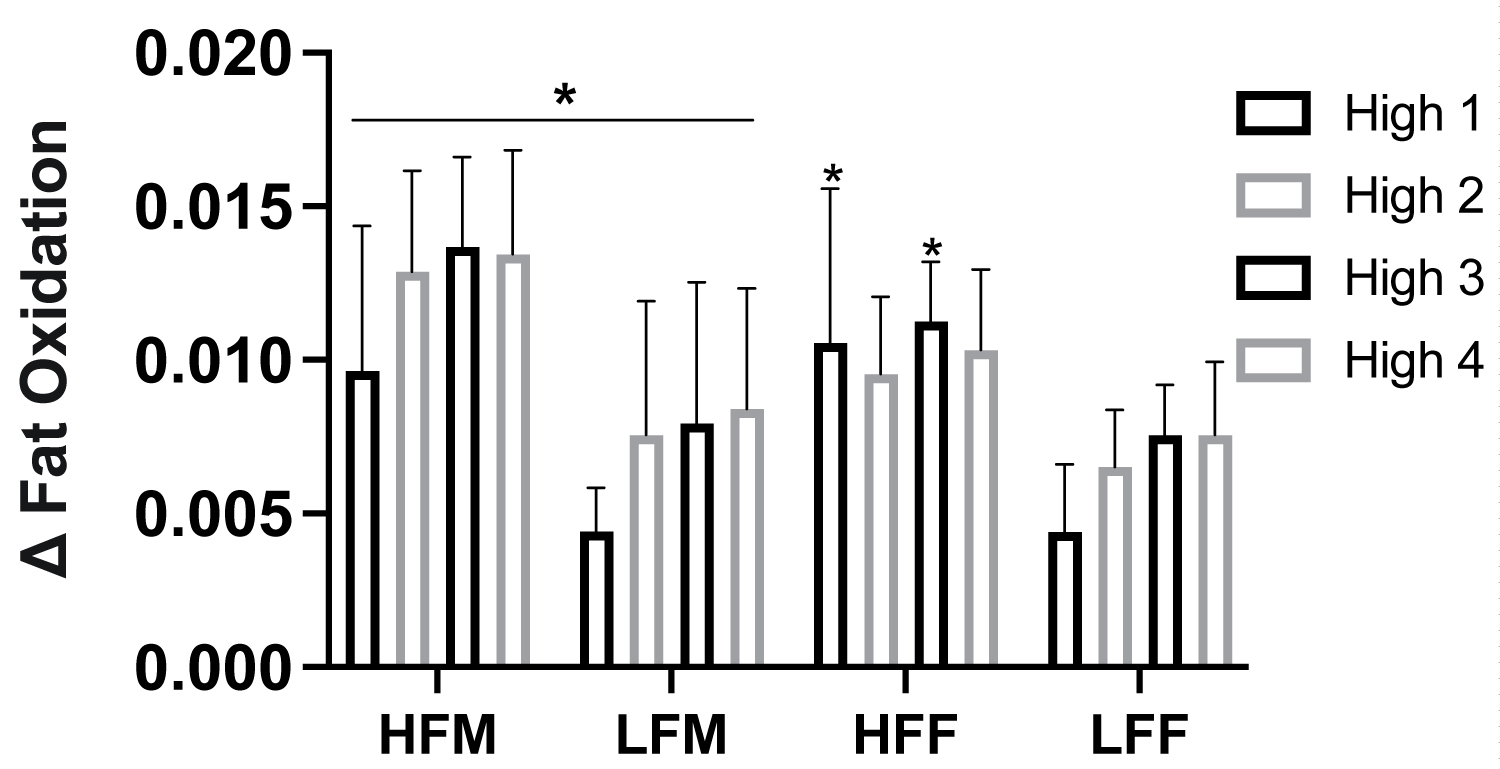 Figure 7: Metabolic flexibility in response to HIIE intervals by fitness status and sex.
Note: Metabolic flexibility assessed as total difference in fat oxidation from lowest and maximal values (Δ) in response to high intensity intervals. HIIE, high-intensity interval exercise, HFF, high fit males; LFM, low fit males; HFF, high fit females; LFF, low fit females. *P ≤ 0.05 HFM vs LFM; HFF vs LFF.
View Figure 7
Multiple correlations were observed in relation to V̇O2peak (ml•kg-1•min-1), including: skeletal muscle mitochondrial oxidative capacity (OD•sec-1) (r = 0.500; P = 0.018, n = 21), fat oxidized (g) during HIIE exercise intervals (H1-H4) (r = 0.631; P = 0.004, n = 21), total fat oxidized (g) during the entire HIIE session (r = 0.554; P = 0.009, n = 21), and fat oxidized during the high-fat meal challenge and HIIE sessions (r = 0.631; P = 0.005, n = 18), Supplemental Figure 2.
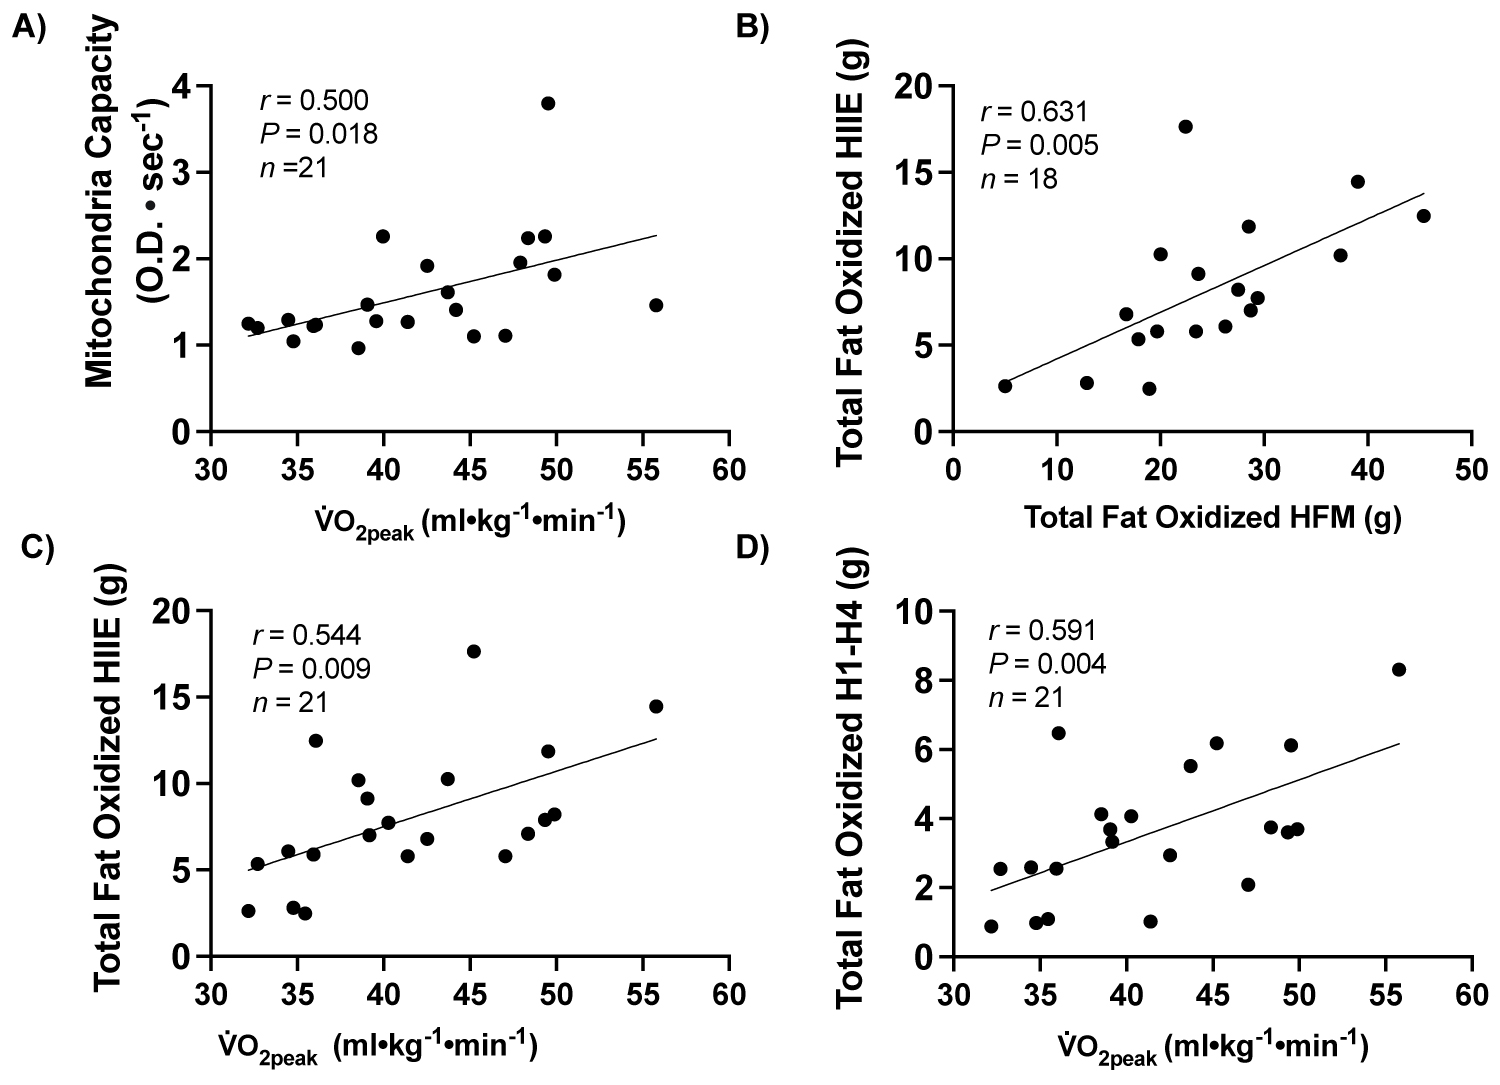 Supplemental Figure 2: Correlations between measures of metabolism, skeletal muscle mitochondrial oxidative capacity and fitness.
Note: A) Correlation between skeletal muscle mitochondrial oxidative capacity (OD•sec-1) and V̇O2peak (ml•kg-1•min-1), B) Correlation between total grams fat oxidized during HIIE and total grams fat oxidized during high-fat meal challenge, C) Correlation between total grams of fat oxidized during HIIE and V̇O2peak (ml•kg-1•min-1), and D) Correlation between total grams of fat oxidized during the exercise portions of HIIE (H1-H4) and V̇O2peak (ml•kg-1•min-1). OD: Optical Density.
View Figure 2
When examining the relationship between resting metabolic rate and muscle metabolic rate, there were positive relationships between resting skeletal muscle metabolism (OD•sec-1) and RMR for the full high-fat meal challenge (r = 0.347; P ≤ 0.001, n = 13), and at each time point up to 120 min postprandial (P ≤ 0.05, n = 13), Supplemental Figure 3.
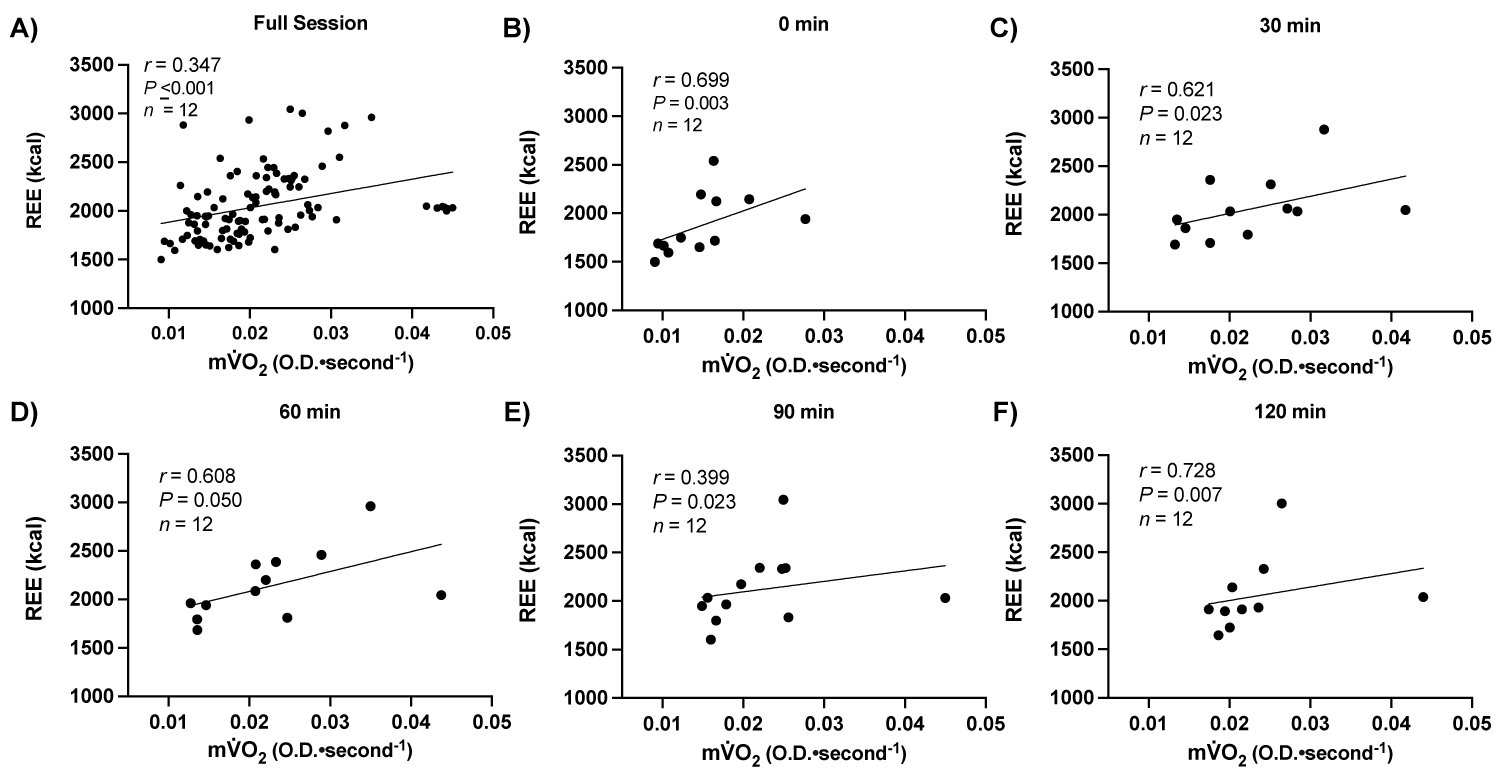 Supplemental Figure 3: Relationship between resting metabolic rate and muscle metabolism.
Note: A) RMR: Resting Metabolic Rate; mV̇ O, muscle metabolism; OD: Optical Density.
View Figure 3
In the current study, we assessed substrate oxidation during HIIE and in response to a high-fat meal to determine if these assessments of metabolic flexibility are influenced by aerobic fitness and sex. Main findings of the study include: 1) HIIE detected metabolic flexibility differences between fitness status in healthy young individuals whereas a high-fat meal did not, 2) There were no sex differences in fat oxidation during HIIE, but when stratified by fitness status and sex, low fitness females have poorer metabolic flexibility following a high-fat meal and during HIIE, 3) There is a positive relationship between the ability to oxidize fat during HIIE and following a high-fat meal, and 4) Quadriceps resting skeletal muscle metabolism was correlated with whole-body RMR for 2 h during the postprandial period. Overall, these data suggest that fat oxidation during HIIE may provide novel insights into metabolic flexibility, not fully captured by the traditional HFM test. Moreover, our study suggests that poor fitness status more negatively impacts metabolic flexibility in females than males.
The ability to oxidize fat during exercise is thought to be peak during moderate intensity exercise then decrease entirely above 65-70% V̇O2peak [34]. However, intensity in which an individual is unable to oxidize fat is also strongly influenced by fitness status [19]. In this study, we displayed an increased capacity to oxidize fat across the entire high-intensity exercise period in high fitness individuals, despite similar carbohydrate oxidation rates. Additionally, we found that aerobic fitness status (V̇O2peak) was strongly correlated with total fat oxidized during HIIE. Our data are consistent with previous studies utilizing similar HIIE protocols in high- and low- fitness status males, indicating that despite similar carbohydrate oxidation rates, a high level of aerobic fitness is associated with greater fat oxidation during HIIE [18,19]. It appears then that aerobically trained individuals have a greater ability to oxidize fat during HIIE, despite the intensity, while maintaining similar energy supply from anaerobic energy systems than their lower fitness counterparts. The discrepancy between fitness status is likely due to training- induced adaptations such as improved mitochondrial content, oxidative capacity, oxygen delivery, and oxygen uptake [35]. These training adaptations are supported by significantly greater mitochondrial oxidative capacity in the high fitness group and a positive relationship between mitochondrial oxidative capacity and V̇O2max. These adaptations result in improved fuel utilization at the whole body, skeletal muscle, and mitochondrial level [35].
Notably, lactate concentrations increased significantly throughout HIIE to a similar extent in high and low fitness groups. Blood lactate is thought to act as a potential marker of metabolic flexibility [36-38]. No differences in blood lactate response to our HIIE protocol contradict previous findings that lactate is inversely associated with fat oxidation during exercise in highly trained male cyclists, moderately active males, and males with metabolic syndrome [38]. No differences in our groups may be explained because our HIIE protocol put individuals well above their lactate threshold, and participants all were in good health. These data, taken with higher work output, increased V̇O2peak, and higher fat oxidation in high- compared to low-fitness status participants, collectively suggest that the increased capacity for work during HIIE in high fitness status individuals is associated with increased oxidative capacity and metabolic flexibility.
Impaired metabolic flexibility has been associated with components of metabolic syndrome such as insulin resistance [6,9,38] and predicts future weight gain [10,39]. It has been proposed that mitochondria act as regulators of substrate metabolism and that dysfunction either precedes or parallels impairments whole body and skeletal muscle oxidation [2, 40].
Since our study is the first to our knowledge to compare postprandial and exercise metabolic flexibility, it is worth noting that we found a significant relationship between total grams of postprandial fat oxidation and fat oxidized during HIIE. However, we found no notable differences in substrate oxidation during the high-fat meal challenge between fitness status groups. These data are inconsistent with previous findings suggesting that lower fitness status or activity levels are associated with poor metabolic flexibility and lower capacity to oxidize fat in a postprandial state [5, 15,16]. We speculate this discrepancy may be due to our participants being young, healthy, and having normal weight status, as adiposity strongly influences metabolic flexibility [41]. Our HIIE test may be a more sensitive assessment of metabolic flexibility and underlying skeletal muscle mitochondrial oxidative capacity in younger healthy populations. While the larger literature focuses on metabolic flexibility in response to feeding, the concept is less often assessed during exercise [42]. Here we find notable impairments in exercise fat oxidation in low fitness status individuals compared to their more fit counterparts during HIIE that were not significant in response to the high-fat meal challenge, suggesting that an HIIE test may be an additional or alternative test for metabolic flexibility. Future research is necessary to determine the impacts of an impaired capacity for fat oxidation during exercise on long-term adiposity and insulin resistance [10,42].
Females have higher fat oxidation rates during moderate-intensity continuous and incremental exercise than males [43-45]. As fat oxidation appears to diminish at higher exercise intensities (60-75% %VO2max) [46], sex differences may be minimal at higher exercise intensities. Additionally, males have a higher sympathetic nervous system response and downstream breakdown of muscle and hepatic glycogen stores during exercise compared to females [20] resulting in a greater reliance on carbohydrates at a whole-body level during rest and exercise [41,47,48]. Here we find no differences in fat oxidation during HIIE or HFM, but we found a greater carbohydrate oxidation rate in males during HIIE regardless of fitness status. Lack of fat oxidation differences may partly be explained because females were tested during the onset of their menstrual cycle, where estrogen and progesterone levels are at their lowest and more similar to males [25]. Additionally, higher intensity exercise, like our high intensity intervals may play a greater influence on substrate metabolism than hormones in women [34].
Increased carbohydrate oxidation in males may be due to higher glycolytic activity during exercise in males [43]. When undergoing estrogen supplementation, males lower glucose kinetics and preserve muscle glycogen [47] Our findings are supported by men having greater rates of glucose appearance, disappearance, and a higher percentage of total substrate from carbohydrate oxidation than females while cycling at 50% VO2max for 90 minutes [43,44]. These data are consistent with our findings of higher carbohydrate oxidation in males than females supporting higher carbohydrate metabolism in males compared to females during HIIE.
Interestingly, we find that low fitness status impacts females more negatively than males. Our LFF showed diminished metabolic flexibility comparable to HFF both during HIIE and in response to the high-fat meal challenge. Body composition characteristics of the LFF group may contextualize our metabolic findings, such as higher body fat coupled with the lowest lean tissue mass compared to all sub-groups. Due to the collective impact of adiposity, low muscle mass, and poor mitochondrial function on metabolic flexibility [1,2], these data may partly explain our findings of lower fat oxidation during HIIE in LFF. Interestingly, muscle mitochondrial oxidative capacity was not statistically different between our LFF than HFF, although it was lower in LFF. However, substrate oxidation data controlled for fat-free mass compared to when expressed relative to total body mass was not different between groups (data not shown). Suggesting perhaps that muscle mitochondrial oxidative capacity alone isn’t driving the differences between HFF and LFF. Therefore, impaired metabolic flexibility of the LFF group appears to reflect differences in fitness status and not simply a lower absolute amount of lean tissue or poorer mitochondrial capacity observed in LFF relative to other study groups.
Low whole body metabolic rate and poor skeletal muscle metabolism may be risk factors for weight gain and long-term detriments to metabolic health [10,49], reflecting the value of a non-invasive measure to assess resting skeletal muscle metabolism in response to feeding. Our study is the first of our knowledge to use CW-NIRS to assess localized resting skeletal muscle metabolism following a high-fat meal challenge. We found a significant positive correlation between resting skeletal muscle metabolism and RMR across the entire high-fat meal challenge. However, this relationship is stronger for baseline and the first 120 min post prandially. Forearm skeletal muscle oxygen uptake accessed via arterial catheter have been shown to partially explain variance in resting muscle metabolism explain in part individual variance in basal metabolic rate and sleeping metabolic rate and substrate oxidation [49,50]. Our findings add to this suggesting that resting skeletal muscle metabolism of the quadriceps (vastus lateralis) is related to whole-body metabolism during the 2 h postprandial period. These findings reflect the important role of skeletal muscle plays in contribution to whole-body metabolism. CW-NIRS maybe an additional way to assess differences in resting skeletal muscle metabolism kinetics and their contribution to whole-body metabolism during the postprandial period. However, while our goal was to test the feasibility of this method alongside indirect calorimetry, it should be replicated before firm conclusions can be drawn about the contribution of skeletal muscle to the postprandial increase in whole-body energy expenditure following a high-fat meal challenge.
Lastly, future work should also assess group differences such as fitness status, sex, or clinical populations in muscle metabolism during the postprandial period.
One limitation of our current study is that while we attempted to control menstrual cycle timing by using the onset of menses as our physiological indicator of time during phase, circulating hormones, differences in phase length, ovulation, or irregularities in the cycle were not assessed [25]. Further work is needed to determine the differences in substrate metabolism between sex groups and across the menstrual cycle. Furthermore, a notable limitation is the small sample size in the sub-group analysis between fitness within sex groups. We were also unable to assess group differences in our resting muscle metabolism data due to limited sample size. While the cessation of research activities limited our testing and recruitment in March 2020 due to the COVID-19 pandemic, a larger sample size may have clarified our results.
Furthermore, while previous work has shown that indirect calorimetry accurately reflects substrate oxidation at higher intensities [23], the authors acknowledge the limits on quantifying carbohydrate oxidation during high-intensity exercise due to excess CO2 production secondary to buffering of metabolic acidosis. The work by Romijn, et al. [23] has demonstrated the validity of indirect calorimetry for the quantification of carbohydrate oxidization at intensities up to ~ 80-85% VO2max. In this study, our average %V̇O2peak for each exercise interval was calculated as69 (12) %, well below this 80-85% V̇O2peak. Therefore, we have confidence in the validity and accuracy of the carbohydrate oxidation data presented herein. Lastly, our CW-NIRS assessment of resting skeletal muscle metabolism during the postprandial period may be limited by only testing a subset of participants.
We found, for the first time, that the capacity to oxidize fat during HIIE and in response to a high-fat meal challenge are related. HIIE may be an alternative way to assess metabolic flexibility by challenging the body’s ability to meet energy demands. Our HIIE protocol was able to detect metabolic flexibility differences between fitness status groups and differences carbohydrate metabolism between sex. Furthermore, low fitness status may be more detrimental to the metabolic flexibility of females than males. Overall, our study suggests that HIIE can be used as an additional assessment of metabolic flexibility. The authors suggest that due to the unique stress exercise presents to the body and metabolic systems an exercise test may be useful in detecting poor metabolic flexibility in otherwise healthy populations. Future work should further explore the discrepancies noted in females as well as the relationship between exercise metabolic flexibility and long term health.
NTJ reports consultancies with Renaissance Periodization, LLC separate from the submitted work.
Experiments were conducted in the Integrative Cardiovascular Physiology Laboratory located in the Department of Kinesiology at the University of Georgia. AAO and NTJ conceived and designed the research. AAO collected data. All authors contributed to analysis of the data and interpretation of the results. AAO and NTJ drafted the manuscript. All authors edited and revised manuscript. All authors have read and approved the final version of the manuscript and agree to be accountable for all aspects of the work in ensuring the questions related to the accuracy or integrity of any part of the work are appropriately investigated and resolved. All persons designated as authors qualify for authorship, and all those who qualify for authorship are listed.
This work was supported by the University of Georgia Department of Kinesiology Soule Award which funded AAO to complete this work and University of Georgia Graduate School Interdisciplinary and innovated research grant award. RCP is funded by the University of Georgia Graduate School’s Georgia Research Education Award Traineeship.