According to Statistics Canada in 2014, 23.4% of Canadians aged between 45 and 64-years-old, and single line 47.4% of adults aged 65 years and older were diagnosed with hypertension. Given the significant association between hypertension and cognitive decline, and consequently on frailty status, the contribution of Neurocognitive Frailty Index in the assessment of patient's prognosis is of utmost importance. Hence, the prognostic utility of the Neurocognitive Frailty Index (NFI), a comprehensive measure of frailty in the elderly and a correlated measure of cognitive change, could help shed some light in better understanding of this relationship.
Objectives: Thus, our aims was to better understand the relationship between hypertension and cognitive performance in order to put in place better prevention and treatment programs that will address the needs of the elderly with hypertension and cognitive deficits. Additionally, to provide validity-evidence for the NFI. Design: Secondary analysis of the Canadian Study of Health and Aging (CSHA) dataset. Measurement: The cognitive status, 5-year survival rate for elderly and using the NFI. Setting: The CSHA dataset consisting of a community and institutional sample.
The overall results of this study show that NFI is a modifiable risk factor to predict outcomes when it is adjusted for age, gender, education and 3MS. The association was slightly stronger at baseline for the elderly with hypertension.
The NFI could be useful in identifying the risk factors for those with hypertension.
Hypertension, Cognitive deficits, Frailty, Risk factors
According to Statistics Canada data [1], in 2014, 23.4% of Canadians aged between 45 and 64-years-old were diagnosed with hypertension, whereas single line 47.4% of Canadians aged 65-years-old and over were diagnosed with hypertension, which corresponds to 2,5010,545.
Hypertension has been shown to be associated with accelerated cognitive decline and dementia [2,3]. However, the relationship between hypertension and cognition remains ambiguous [4,5]. Some studies found that hypertension and hypotension increased risk for cognitive decline and dementia whereas some studies failed to support this association [6]. Hypertension and hypotension are major risk factors for vascular diseases, which may also lead to cognitive impairment due to stroke or chronic cerebral hypoperfusion in the elderly [6-8]. Hypertension may also be involved in the development of Alzheimer's dementia [9]. Epidemiological studies have shown that hypertension is a risk factor for dementia, but the association is complex, varies in strength and direction according to the age of the onset. Some hypotheses have been proposed as to explain this relationship. Long-term high blood pressure in midlife may determine severe atherosclerosis and large-artery stiffness in later life indicating that the atherosclerotic process may be implicated in the pathogenesis of dementia [9]. Also, it is still unclear whether hypertension and vascular morbidities affect cognition by leading to neurodegeneration or atherosclerosis and neurodegeneration are independent processes in the development of dementia [9].
The risk of dementia varies in strength and direction according to the age of onset of hypertension and antihypertensive drugs can reduce the risk of AD [10]. Older age is the strongest risk factor for vascular cognitive impairment and dementia after stroke [11]. This finding is consistent with the high incidence of stroke or cerebrovascular related dementia in the elderly.
Therefore, as noted by others [12], the assessment of frailty status could be useful in clarifying outcomes for older patients with cardiovascular disease. Thus, the objective of the present study is to investigate the relationship between hypertension and cognitive decline in relation to frailty.
Hypertension is the most common modifiable risk factor for stroke. Elevations in both systolic and diastolic blood pressure are associated with increased risk of stroke and stroke related dementia [11]. A few meta-analyses have found that there is an ambiguity concerning the link between hypertension and cognitive performance by presenting mixed results, some significant, some non-significant, and some with a U shape [4,13]. Altogether, the findings are quite varied and this could have been likely occurred because 1) researchers have used different operational definitions and measures of cognitive functioning, and 2) researchers used different populations without controlling for potential confounding variables.
Another factor, which needs to be considered in the association between hypertension and cognitive deficits, is frailty since cardiovascular diseases are related to morbidity and mortality [12]. The inclusion of frailty assessment in clinical care has important implications. For instance, one study [8] has found among frail and pre-frail men with cardiovascular disease that the cognitive function is poor. Hence, the examination of the relationship between frailty and cognition in those with cardiovascular disease could facilitate treatment process in primary care [14]. Many frailty measures have been developed and could be integrated in the clinical care of older adults with CVD. Our team [15] have also called for the need to further examine the prognostic value of the Neurocognitive Frailty Index with those who have cardiovascular risk problems.
Thus, the aim of the present study aims to better understand the predictive value of the NFI and 5-year survival for individuals with hypertension.
Participants in this study were drawn from the three waves Canadian Study of Health and Aging (CSHA) [16] dataset. Here only data from wave 1 and 2 were used: CSHA-1 (1991 to 1992) and CSHA-2 (1996 to 1997) for prediction of 5-year cognitive changes. We have included 997 participants who received a consensus diagnosis of no cognitive impairment (NCI) or cognitive impairment but not dementia (CIND) on CSHA-1. Samples included those who completed neuropsychological tests at CSHA-1 and received a clinical diagnostic assessment at CSHA-1 and CSHA-2 (n = 1228). The CIND category included individuals whose level of cognitive impairment was evaluated to be greater than the NCI group but less than the dementia group. The Neurocognitive Frailty Index (NFI) was defined as a combined score of 42 physical and mental components (in 8 cognitive domains) as they were available in the dataset. The cognitive score was measured by the Modified Mini-Mental State (3MS) [17] at follow-up and designated the outcome measure. From the 997 sample, 299 individuals had died in five year of follow-up.
The NFI hypertension measure was defined as a combined score of 42 physical and mental components in 8 cognitive domains. The NFI has 42 components but the high blood pressure variable was removed. The outcome measure included the cognitive score as measured by 3MS at follow-up, and mortality.
The initial NFI [15] consisted of 42 variables, selected as representative of different aspect of health condition. In the present study, 41 variables were used but hypertension was the object of investigation, our main question. It was removed from the original NFI components. The NFI has two main components, that is both a physical and a cognitive, of which thirty-three physical components were selected from the CSHA-1 dataset at baseline (1991). Binary variables were recoded, using the "0" to indicate the absence of the deficit, and "1" to indicate the presence of a deficit. Particularly in ADL and IADL items, data converted as score "1" for "can't do at all" or "with some help" denoting needed help, and we assigned score of "0" for "without any help". The Self-rated Health Question "How is your health these days? Very good, pretty good, not too good, poor, very poor" was rated between "0" and "1". Each lower self-rating of health was coded to represent a larger deficit "very good = 0", "pretty good = 0.25", "good = 0.5", "poor = 0.75" and "very poor = 1". For variables with dichotomous response (general health), data coded into a score between "0" where no deficit is present and "1" where the deficit is present. Overall, physical component scores varied between zero "0" to thirty-three "33". Similarly, cognitive component was recorded by recognizing an ordinal scale of variables. A simple recoding was done for the eight elements: short-term memory, long-term memory, verbal abstract thinking, judgment, aphasia, apraxia, agnosia, and constructional difficulty. A score was assigned a "0" for response "None", "1" for "Questionable", "2" for "Mild", "3" for "Moderate" and "4" for "Severe". There were eight measures in this part which means theoretically that a person could have a score between zero "0" to thirty-two "32". Table 1 describes the physical and cognitive variables and the cut-points included in the NFI. Each of the 41 components added together, therefore there was a total score of NFI ranging between zero "0" and sixty-five "65".
Table 1: Demographic characteristics and cognitive status of the sample by the Levels of NFI. View Table 1
The parametric tests were used if variables had a normal distribution and nonparametric tests were used if the data were not normally distributed. Chi-square was used for categorical data. Comparisons between two groups were done using independent t-tests. A one-way between subjects' ANOVA was conducted when there were three or more groups. Mann-Whitney U and Kruskal-Wallis tests were used for comparing two groups if the data were not normally distributed. Pearson (if the data were normally distributed) and Spearman (if the data were not normally distributed) correlation coefficients were used to assess the relationship between variables. Categorical NFI variables were created using classification and regression trees. This study applied one specific algorithm of decision trees, a CHAID (Chi-squared Automatic Interaction Detector) model. This modelling accounts for the binomial distributions in response variable. Validation of the multivariate analyses was tested with a 10-fold cross-validation; CHAID identifies 'nodes', or patient subgroups, that are most homogeneous with regards to probability of death. These nodes were then applied to Cox regression for further investigation. In addition to bivariate tests and decision tree, two separate Cox regression models were applied to the data to estimate chance of death in 5 years of follow-up. Cox regression was used in two formats of NFI (one for NFI as a continuous and another as a categorical variable). A p-value of < 0.05 was considered statistically significant. All statistical analyzes were performed using SPSS (version 23) [18] and R × 64 (version 3.1) [19].
This is secondary analysis of the Canadian Study of Health and Aging. At baseline, the mean age of sample was 80.4 year (SD = 6.9; ranged between 66 and 100. The NFI mean was 9.61 (SD = 6.08) and ranged from 0 to 33). Distribution was slightly skewed to the right (Supplement Figure 1).
 Supplement Figure 1: Kaplan Meier curves for the proportional survival of people with and without hypertension.
View Supplement Figure 1
Supplement Figure 1: Kaplan Meier curves for the proportional survival of people with and without hypertension.
View Supplement Figure 1
Based on CSHA information at baseline 623 (62.5%) did not have blood pressure, 239 (24%) had blood pressure and 135 (13.5%) had blood pressure but used some type of medication. Mean NFI was 9.21 (sd = 5.93) in people without blood pressure, and 11.42 (SD = 6.37) in people with high blood pressure and finally 8.28 (SD = 5.54) in people with blood pressure but they are using medication. We did a ANOVA test (F = 15.66, p = 0.001) followed by a Duncan test (as post hoc test), it turns out we can merge group of people without HBP with whom have HBP but using medication.
Demographic and cognitive data were described using means and standard deviation (age, 3MS at baseline, 3MS at follow-up, year of education) or percentage (gender), which presented in Table 1. In this analysis NFI was grouped in 4 categories based on result of decision trees.
Table 2 parts A and B present the result of two separate regression models for people with and without high blood pressure to predict outcomes (3MS). Results indicate in both models, NFI is significantly associated to cognitive status (3MS at follow-up); however, NFI is just slightly stronger predictor in people with high blood pressure in comparison to people without high blood pressure. In the multiple linear regression analysis, adjusted for age, gender, education and 3MS at baseline, the NFI was correlated to 3MS at follow-up same as age (p < 0.05). Every additional deficit used to calculate the NFI was associated with an increased chance of cognitive decline. However, this association was slightly stronger in people with high blood pressure.
Table 2: Association between NFI and cognitive changes using Multiple Linear regression. View Table 2
Association between other factors and 3MS at follow-up are presented in the both models (Table 2 Part A and Part B). Although in both groups age, 3MS (at baseline), and NFI are related to outcome, the result indicate that NFI is just only modifiable factor to predict outcome.
Cox regression was applied for modeling probability of mortality (for continuous NFI). NFI was significantly related to mortality with a hazard ratio equal to 1.08. This indicates participants with a higher NFI score have a higher probability of mortality. In this model, age, gender and heart problem were also significant (Table 3, part A), this association is stronger than age.
We used CHAID decision tree analysis to determine optimal stratification groups to best identify association between NFI and mortality. Result indicated NFI can be grouped into four categories. Group one is for the people who have NFI less than 4.25 (almost 4 deficits) with mortality rate of 13.0%. The second and third group have mortality rate of 25.3% and 38.5% which indicate two and three times more mortality rate, comparing to baseline. The highest risk went to people with NFI score of 19 and over (with mortality rate of 57.4%). We used this result for making 4 Levels of NFI to predict mortality.
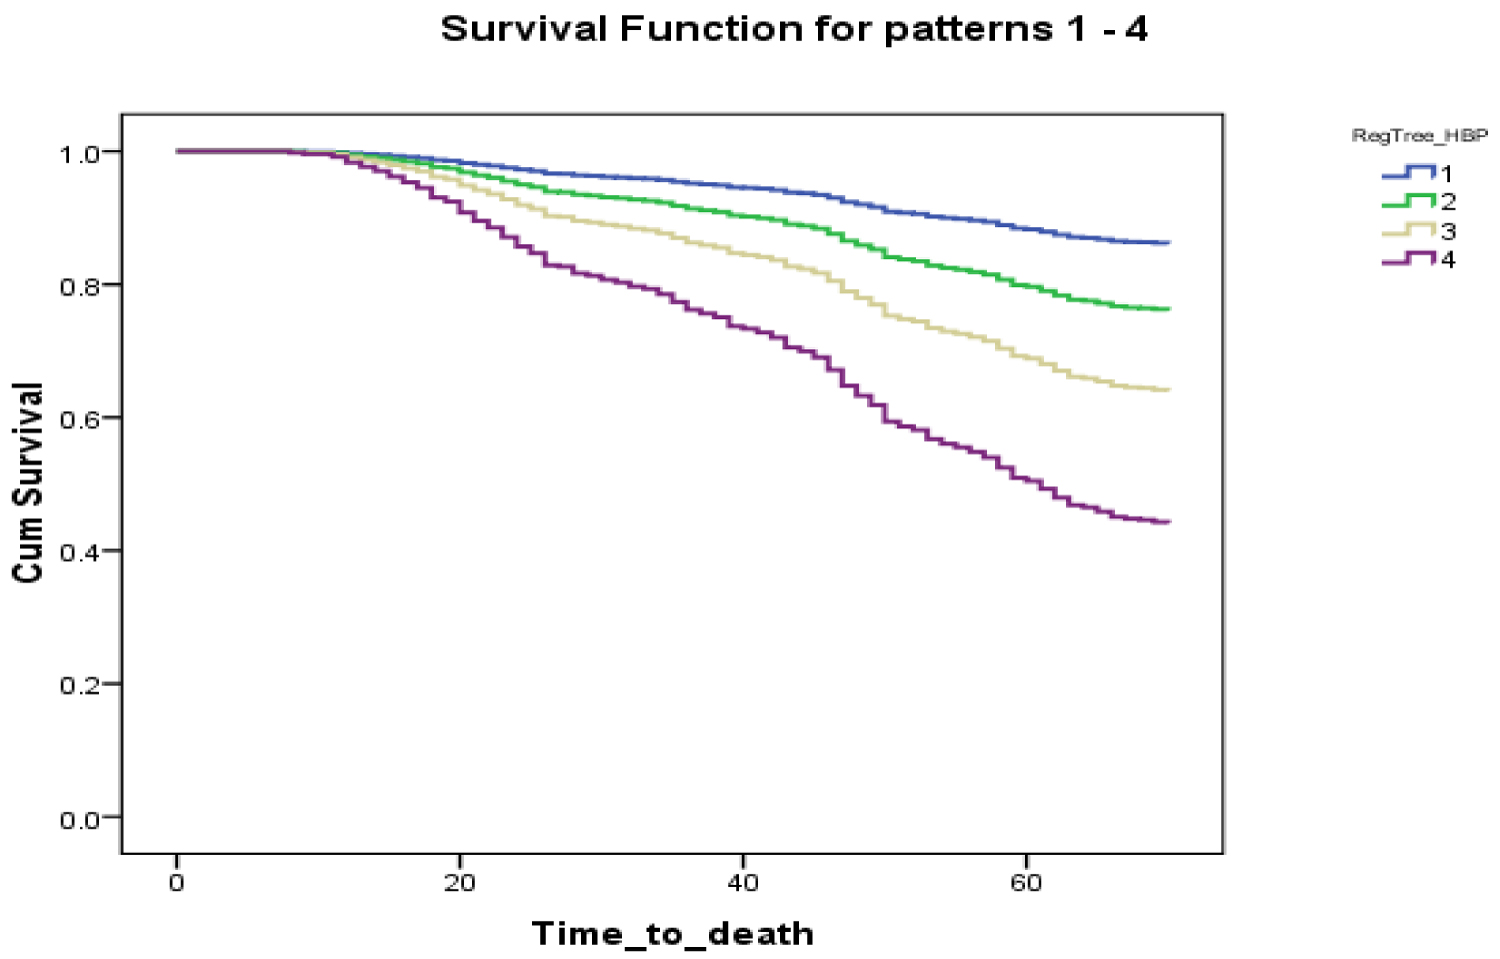
In the proportional hazard ratio analysis, adjusted for age, gender and education, the value of NFI (as categorical) was more correlated to survival than age. Every additional deficit used to calculate the NFI was associated with an increased hazard rate. By using result of decision tree grouping, NFI was significantly associated with mortality for the second group participant in comparison to the fittest people at baseline (NFI between 5 to 10 deficits; HR = 1.805, 95% confidence interval (CI) 1.174-2.776; p-value 0.007). People with NFI of more than 19 deficit has shown HR = 5.090 (95% CI 3.174-8.161), which indicate they have 5 times more likelihood of death comparison to baseline (Table 3, part B). Although all levels of the NFI were highly correlated to mortality, the graph shows increasing Levels of the NFI has dose-response effect in relation to survival, but this pattern is different in two groups (Figure 1; Panel A and Panel B).
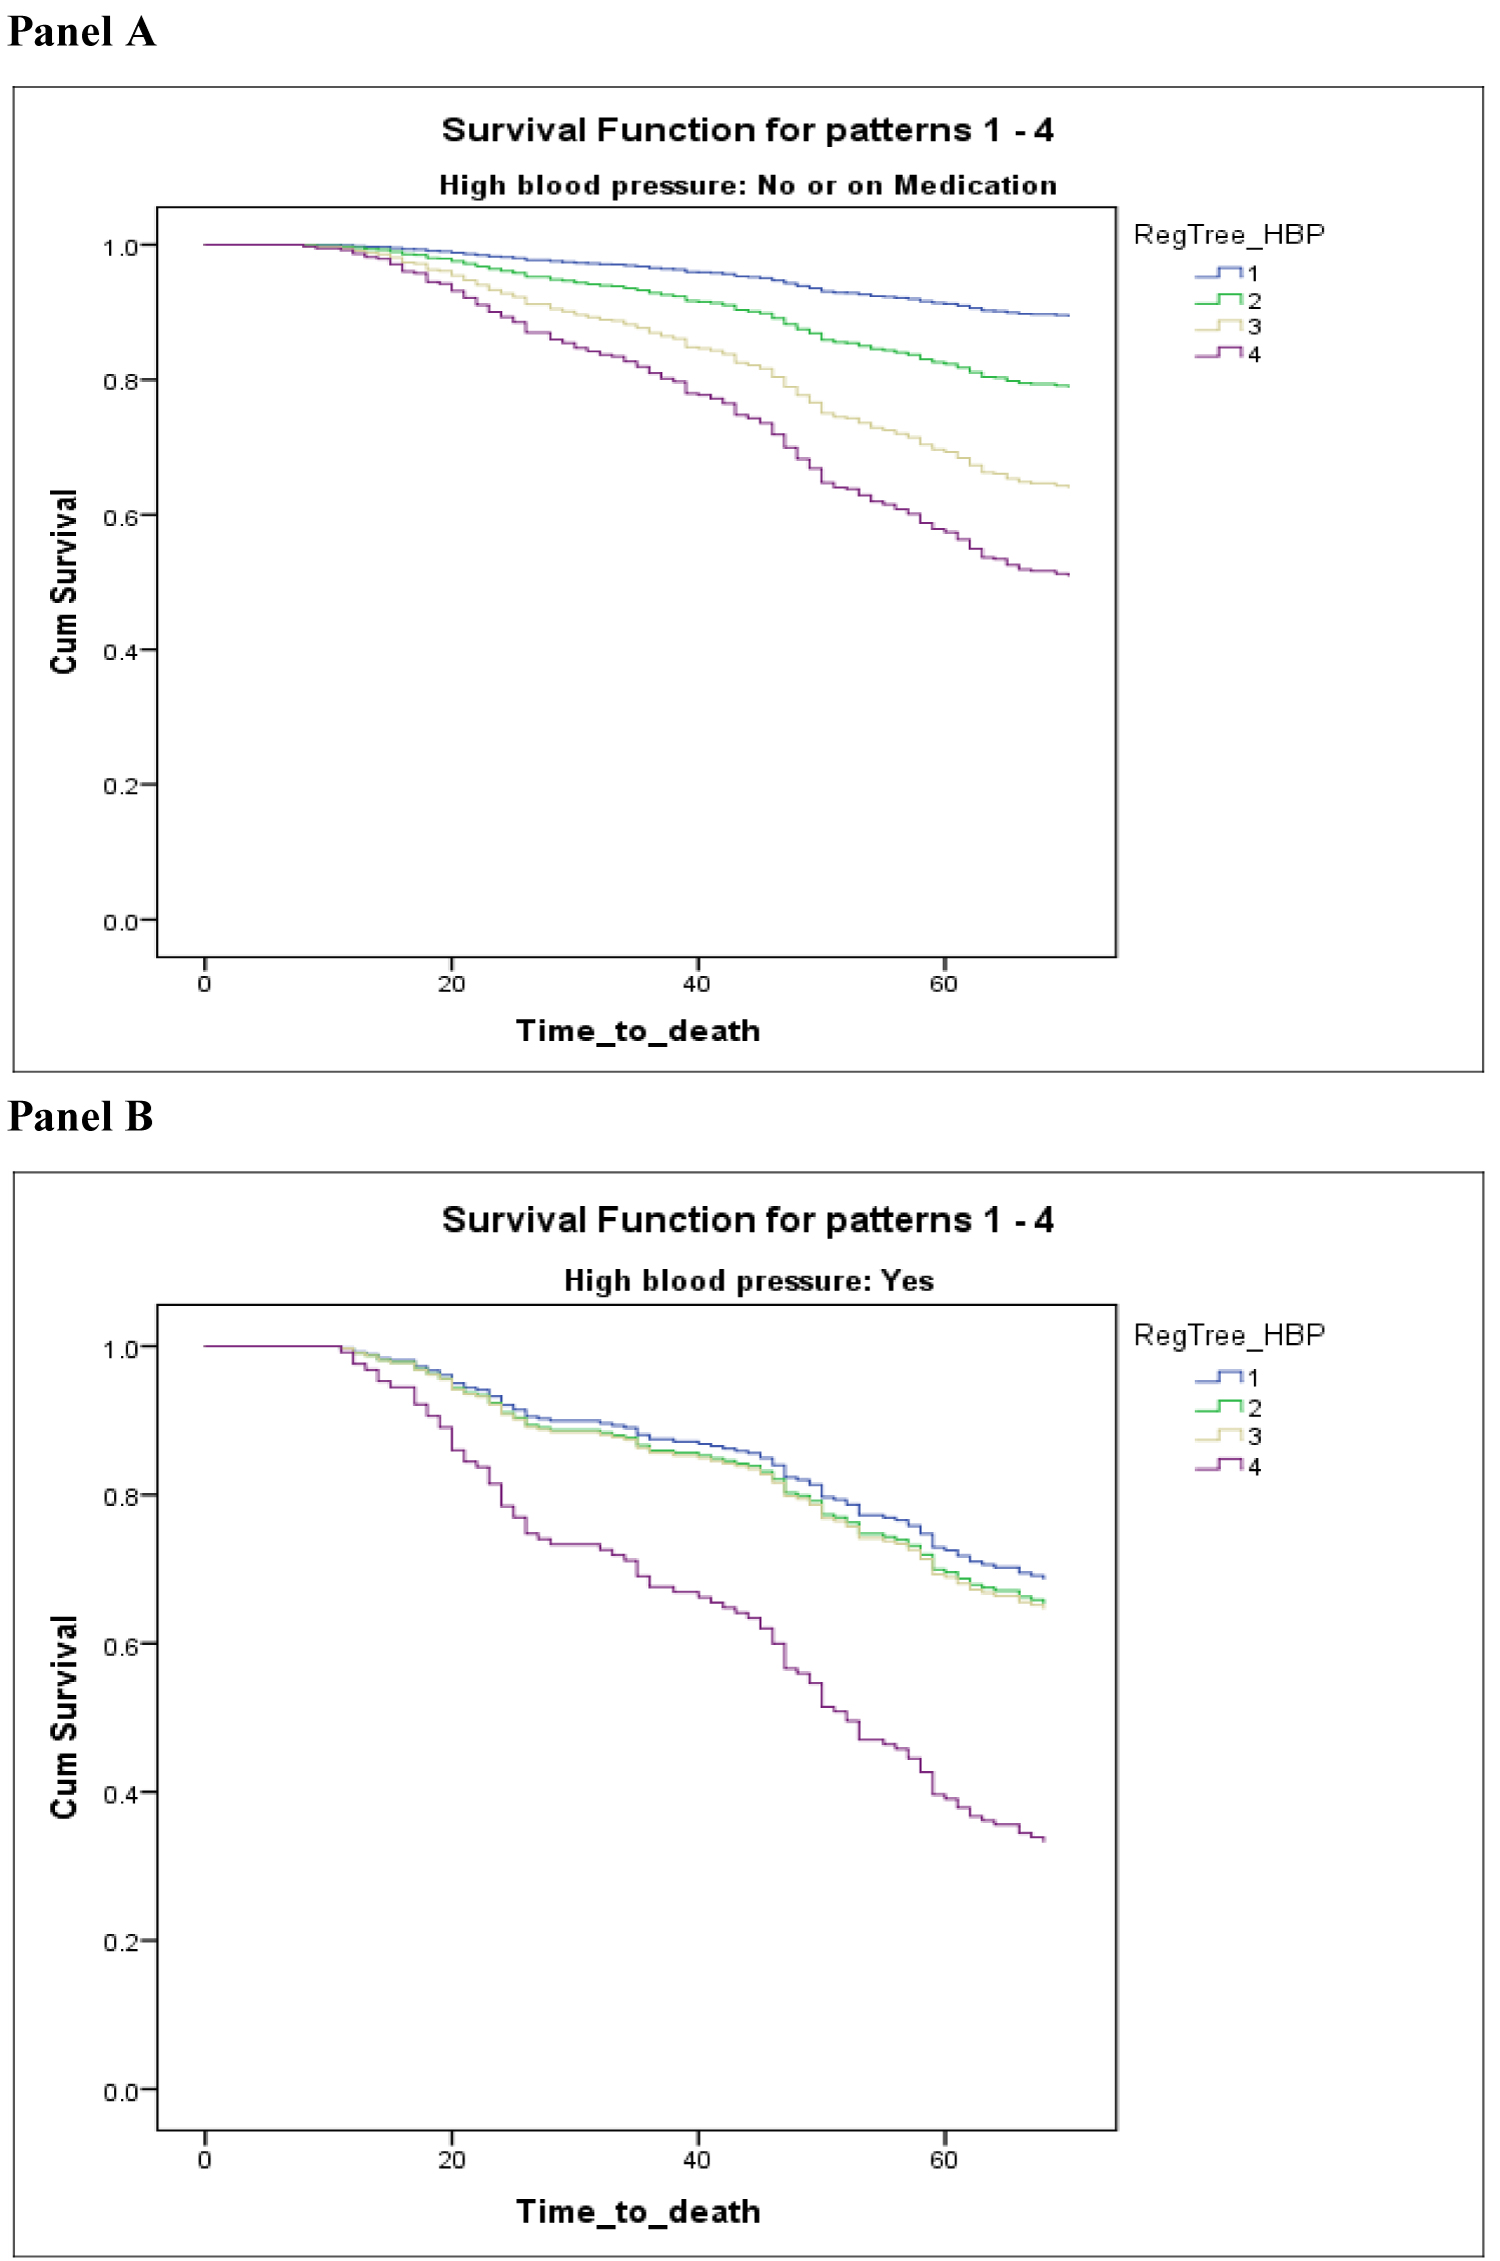 Figure 1: Kaplan Meier curves for the proportional survival of people without high blood pressure or using medication (Panel A) also with high blood pressure (Panel B).
View Figure 1
Figure 1: Kaplan Meier curves for the proportional survival of people without high blood pressure or using medication (Panel A) also with high blood pressure (Panel B).
View Figure 1
Table 3: Association between NFI and mortality using Cox proportional hazard model. View Table 3
The present study aimed to predict cognitive status and 5-year survival in individuals with hypertension. The results indicate that for individuals with and without high blood pressure the NFI when adjusted for age, gender, education and 3MS at baseline, the association was slightly stronger for those with high blood pressure. However, NFI is the only modifiable factor to predict cognitive deficits and mortality.
The present results support findings from previous studies. For instance, Oveisgharan and Hachinski [5] found that the presence of hypertension predicts progression to dementia in the sample of subjects with cognitive impairment no dementia (CIND). Goldstein, et al. [20] determined that hypertension is associated with faster cognitive decline in persons at risk for dementia. Brady, et al. [20] noted that uncontrolled hypertension regardless of age is associated to cognitive deficits. In our study, the NFI score was significantly associated with cognitive changes for the subjects with hypertension but this was stronger than age.
The present results also concur with studies examining vascular risk factors involved in cognitive decline. For instance, Kilander, et al. [21] found an association between hypertension and cognitive impairment was greater in untreated men. In a review [14], the need for more sensitive methods to detect frailty and measure its impact was raised for clinical practice in primary care. The present results show that the NFI serves as a prognosis tool to evaluate the risk of developing dementia. Findings by Tzourio [22] suggest that the identification and control of vascular risk factors at midlife is an important approach to decrease the incidence of dementia. Although our results show that the NFI was highly correlated to mortality, a dose-response effect in relation to survival is noted with increasing levels of the NFI. Thus, the identification of hypertension as a risk factor using the NFI might serve to identify those who are more at risk for dementia in order to provide preventative interventions. Given that the NFI is proving to be a valuable tool to assess the risk of developing AD and that our results have established an association with hypertension, the present findings add support to early intervention in those subjects with hypertension and cognitive decline.
In conclusion, additional research examining the contributions of the NFI in the prediction of specific CVDs could provide a better understanding of the role of these risk factors in predicting the risk of dementia.
None to declare.
None to declare.
The research team would like to acknowledge the access given to the Canadian Study of Health and Aging (CSHA) dataset by Dr. Kenneth Rockwood, which was much appreciated. All authors contributed equally to the inception and writing of the manuscript.
The authors declare that the experiments and data collected comply with the current laws of the country in which they were performed.