

International Journal of Anesthetics and Anesthesiology
Ultrasound Guided Regional Anesthesia Training Simulator Using Microsoft Kinect
AparajithSairam1, JianFeng1, Norman I. Badler1, Jiabin Liu2, Kenneth Richman2 and Nabil Elkassabany2*
1Computer and Information Science Department, School of Engineering and Applied Science, University of Pennsylvania
2Department of Anesthesiology and Critical Care, Perelman School of Medicine, University of Pennsylvania
*Corresponding author: Nabil M Elkassabany, Assistant Professor, Department of Anesthesiology and Critical Care, University of Pennsylvania, 3400 Spruce Street, Dulles 6, Philadelphia, PA 19104, Tel: 2158236700, Fax: 2158234171, E-mail: Nabil.elkassabany@uphs.upenn.edu
Int J Anesthetic Anesthesiol, IJAA-1-016, (Volume 1, Issue 3), Reserach Article; ISSN: 2377-4630
Received: August 23, 2014 | Accepted: November 21, 2014 | Published: November 24, 2014
Citation: Sairam A, Feng J, Badler NI, Liu J, Richman K, et al. (2014) Ultrasound Guided Regional Anesthesia Training Simulator Using Microsoft Kinect. Int J Anesthetic Anesthesiol 1:016. 10.23937/2377-4630/1/3/1016
Copyright: © 2014 Sairam A, et al. This is an open-access article distributed under the terms of the Creative Commons Attribution License, which permits unrestricted use, distribution, and reproduction in any medium, provided the original author and source are credited.
Abstract
We present a system for the interactive simulation of ultrasound guided peripheral nerve blocks using a Microsoft Kinect®. The system performs motion tracking of both the ultrasound probe and the nerve block needle. Software generates synthetic ultrasound images from previously captured ultrasound images. Details of the software elements in the system are described. Some of the current challenges and future work in this research are discussed.
Keyword
Ultrasound, Kinect Simulation Needle Volumetric Slicing OpenGL OpenCV
Introduction
Regional anesthesia and peripheral nerve blocks are among the most important tools used by anesthesiologists in different practice settings. Ultrasound (US) guided peripheral nerve blockade has gained popularity among anesthesiologists over the past two decades [1,2]. US guidance transformed peripheral nerve blocks from blind procedures based on anatomical landmarks or indirect methods to localize different nerves to procedures where the anesthesia provider is able to visualize the target nerve and the surrounding structures, introduce the block needle towards the target, and observe the local anesthetic being injected surrounding the nerve in real time. Using US to guide performance of peripheral nerve blocks is associated with higher success rate, less patient discomfort, and less time of block performance [2,3].The learning curve for ultrasound guided peripheral nerve blocks is steeper than conventional techniques. Learning how to perform US-guided peripheral nerve blocks is a two-step process [4]. The first step is learning the two-dimensional sonoanatomy and interpretation of the US images as they relate to the three-dimensional gross anatomy. The second step is mastering hand-eye coordination and driving the needle towards the target nerve and keeping it in the plane of the US beam. This later step can be especially frustrating for the novice and for practicing anesthesiologists who want to incorporate US into their regional anesthesia practice [5]. Traditionally, this skill set is acquired during anesthesia training through performance of these procedures on patients under supervision. There is a growing consensus that it is not acceptable to use patients to gain this early experience [6]. The use of phantom models to practice needle advancement under ultrasound guidance can be a reasonable alternative. Available phantom models are either solid blocks of gel or other materials, or other models that attempt to simulate the anatomy of the target region. A major pitfall of these models is that the anatomical configurations of these models are very primitive and basic, hardly representing the real US images of the area of the target nerve [7]. Therefore, simulation of peripheral nerve block procedures using real US images is an appealing and sensible alternative. In this manuscript, we present a simple and relatively inexpensive prototype for a simulator/trainer for US guided femoral nerve block. The femoral nerve is located lateral to the femoral artery below the inguinal ligament. The nerve is located outside the femoral sheath and is separated from the femoral artery by the fascia iliaca.
Materials and Methods
The simulation system consists of four components: a block needle, a mock ultrasound probe, a dummy in which the needle can be inserted (Figure 1) and a Microsoft Kinect. Color markers are attached to the needle and probe so that they may be consistently and accurately tracked by the Kinect (Figure 2). Simulation of ultrasound guided needle placement requires generating serial real US still images displayed on a laptop screen based on the position and orientation of the probe on the dummy. This requires detection of the positions and orientations of probe and needle in 3D. We use a Microsoft Kinect® for tracking positions and orientations of the probe and needle.
Figure 1a-d: Setup for the training system.
View Figure 1
Figure 2: Microsoft Kinect.
View Figure 2
The training system consists of two software modules (1) the tracking module, for identifying the position and orientation of both the needle and the probe in three dimensions, and (2) the module for generating ultrasound images in real time. The latter module involves two steps: generating volumetric data based on previously captured serial ultrasound images and real time rendering of appropriate slices through a volumetric dataset.
The system comprises an offline pre-processing phase and an online training phase. The offline phase first converts a sequence of ultrasound images into a unified volumetric data format, which is then used throughout the simulation. Prior to starting the training session, a calibration step is carried outthat allows the Kinect to acquire the colored markers to be tracked during the simulation. This step makes use of some simple assumptions relative to the initial positions of needle and probe with respect to the Kinect. After these preprocessing steps, the training sessions may begin. Each session consists of a repeated loop of tracking and display update operations which terminates when the trainee has the needle in the correct position or else has failed to reach the desired target. Within this loop, first step is to find the spatial locations of both the needle and the probe in three dimensions as well as the orientation of probe. The second step virtually slices the volumetric data along the plane of the probe and the third step generates a synthetic ultrasound image along that slice. In addition, a virtual needle is added into the slice image if it the trainee is able to place the needle in the US plane and steer it successfully towards the image of the target, femoral nerve. This loop is repeated every frame at 30 Hz to sense the needle and probe configuration, update the observed synthetic image, and reflect their combined spatial relationship. This workflow is diagrammed in Figure 3.
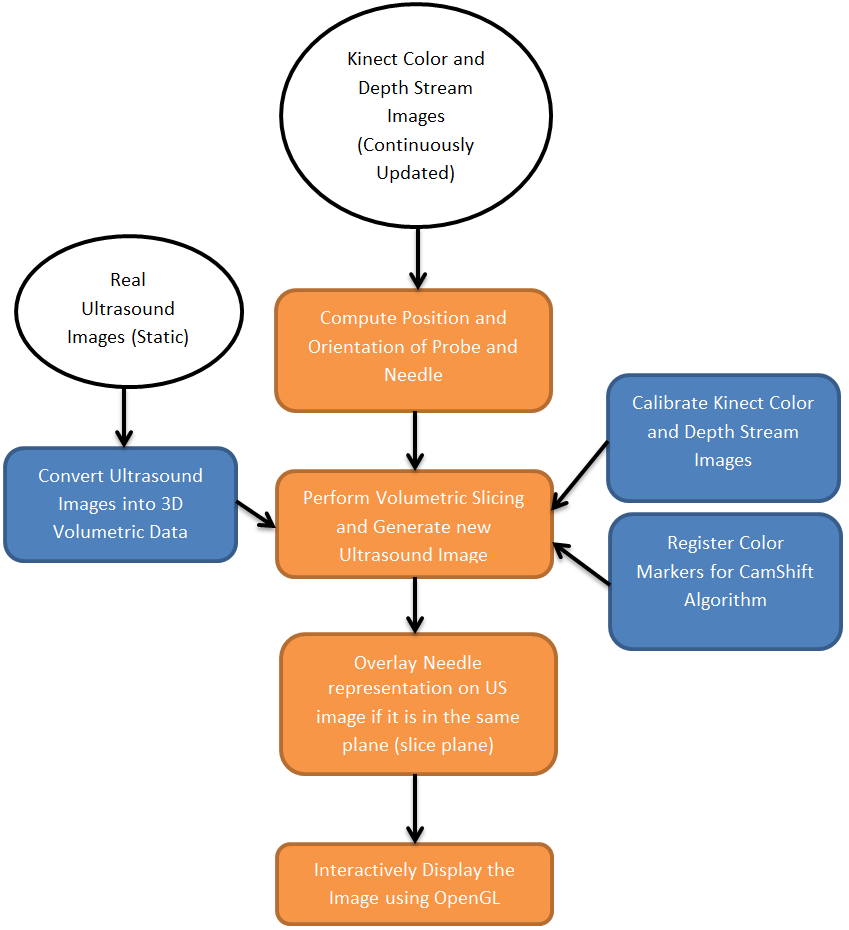
Figure 3: Setup for the training system.
View Figure 3
Volumetric Data
Volumetric Rendering is a popular means of visualization in medical studies [8,9]. It can be used for projecting 3D data into a 2D image. This technique has some variants, one of which is Volumetric Slicing; details of this process are discussed below. Volumetric data is a three-dimensional discretized grid structure in which space is partitioned into equal-sized volume elements (voxels). The voxels are typically cubes or parallelepiped structures. Each voxel has some data associated with it. Here each voxel need only contain a single value (which may be considered as density values).
Generation of Volumetric Data
The ultrasound dataset we used was provided by staff physicians at Penn Presbyterian Medical Center, University of Pennsylvania. It contained a set of ultrasound images of the femoral nerve. The images were taken along short axis of the femoral nerve serially at 5 mm spacing. The basic mechanism of generating volumetric data from images is simple. The width and height of the grid is same as the width and height of the given images. The depth of the grid (Figure 4) is equal to length of the femoral nerve scanned, which can be calculated by:
Figure 4: Volumetric Data Generation
View Figure 4
Figure 5: Volumetric Data Generation
View Figure 5
Figure 6: Kinect Depth Image
View Figure 6
depth = (number of images - 1)*(distance between images)
Given this grid size, we can still choose the number of voxels to be fitted into this grid along each direction. For maximum visual accuracy, the number of voxels along each direction was set equal to the number of pixels along each direction. This simply gives the number of voxels along the width and height, leaving just the depth dimension. Our images are 640 x 480 and represent a physical area of 38 mm x 27 mm. Using basic proportionality, the number of voxels along the depth is:
Now that the grid size and number of voxels have been decided, the next step is to identify or compute the densities present in each voxel. It is easy to determine the density contained in those voxels where image data is directly available. Since the input images are in gray scale, densities can be found by scaling the gray scale value of each pixel to the range 0 to 1. The density of voxels in between two images is calculated by simple linear interpolation of the voxels in the corresponding position in the two neighboring planes. Practically storing the entire grid is infeasible because it is too big to fit into cache memory and will slow down the entire system. So, only the voxels which are present in one of the image planes are stored. If voxels between images are needed, then the inexpensive linear interpolation is performed instantaneously.
The Microsoft Kinect produces two important information streams: a color image and a depth image. The color image stream is used to help identify the markers, which are then used for finding the positions of probe, needle and dummy. The OpenCV library has been used for image processing. OpenCV (Open Source Computer Vision Library) is a library of programming functions mainly aimed at real-time computer vision.Using OpenCV's implementation of the CamShift algorithm, the marker positions are found in 2D image space coordinates. The depth image is then queried based on the 2D coordinates to find the third dimension.
Depth And Color Images Calibration
Unfortunately, there is no one-to-one correspondence between the color image and the depth image streams.Through experimentation, however, an empirical formula that works well in the research setup was found. The procedure used for this is illustrated in figures 5, 6 and 7.. The depth and color image for the same scene were collected, the depth map was made transparent and overlaid on top of the color image, then it was moved and zoomed to match some key points like corners of objects in the color image.
Figure 7: Marker Positions Tracked.
View Figure 7
Figure 8: Calibration of the Depth Image.
View Figure 8
Marker Design
The probe has three markers attached to it for finding both its position and orientation. The needle has only two markers attached to it, as the rotation of the needle along its own axis is irrelevant. The needle parameters include its axis orientation and the tip position. Both of these can be found using the two markers. The only parameter of interest about the dummy is its distance from the Kinect, as the other parameters of the dummy remain fixed. This parameter allows us to compute the positions of needle and probe with respect to the dummy. Only one marker is needed for getting this information.
For CamShift Algorithm to work accurately and to produce precise locations of the different markers, it is important to use highly contrasting colors for the markers.
The six markers are attached as shown in figure 9. M1 is fixed on the middle of the probe handle; M2 and M3 are attached to a black board which is affixed to the top of the probe. M1 and M2 are aligned with the center of the bottom surface, while the black board which supports M2 and M3 is perpendicular to the probe axis. M4 and M5 are attached to the needle at a fixed separation distance. M6 is attached to the surface of the dummy which faces the Microsoft Kinect camera.
Figure 9: Marker Design.
View Figure 9
Figure 10: Diagrammatic representation of various parameters used during
rendering in 2D.
View Figure 10
Since all of the markers are affixed to their respective objects, the distance between the markers on each object are also fixed. We follow the convention of representing the distance between any two points P1 and P2 as L (P1, P2). We get the coordinates of the probe's bottom surface center point as:
The horizontal vector and Up vectors are calculated as:
Similar to the probe calculations, the position of the needle tip is calculated as:
The needle axis vector can be calculated as:
Subtracting M6 from O and T gives the relative positions with respect to the dummy.
The aim of this software component is to provide the trainees an interactive stream of images similar to the US images they get during scanning for the femoral nerve block. Images are generated by the process of volumetric data slicing. The data slicing algorithm is very straight forward. The inputs to the algorithm are the position of the volumetric grid origin in world space, the slice plane horizontal (horizontal) vector, the slice plane up (Up) vector, the extreme top slice plane center (O), the size (width and height) of the slice plane, the needle tip (T) and the needle axis (needleAxis).
The basic mechanism of this algorithm is to march across the entire slice plane and project all the points that are encountered during this process onto an output image. We can calculate the upper left corner of the slice plane using the formula:
upperleftcorner = O -width2 horizontal
A convenient step size would be the width of a voxel. We can iterate over the slice plane in a line-by-line manner going from left to right for each line from top to bottom. For iterating along a horizontal line, initialize the "iteration" point as the leftmost point in the line and move it along the line by:
point = point+ step*horizontal
Once the entire line has been traversed, go back to the leftmost point in the line and then go down one step:
point = point- step*Up
At every point of the slice plane we must read the density value stored at the voxel in which we are currently located and project it onto the output image.
The projection algorithm converts a 3D world position into a 2D image position. The basic mechanism is to find the positions of all points in the slice plane with respect to any one point in the same plane. For convenience we can choose the "real center" of the slice plane (referred to as r) as the reference point. The point r maps to the center of the output image. The Up vector maps to the vertical direction in image space and the horizontal vector maps to the positive X direction in image space.
Thus for any point p in the slice plane (Figure 11), we can find its co-ordinates with respect to r as:
Figure 11: Projection Situation.
View Figure 11
x = ( p - r ).horizontal
y = ( p - r ).Up
For generating an image we need values of pixels with respect to the upper left corner of the image; this is just a shift of origin. Assume the projection of r in the output image has coordinates (xCenter, yCenter). The projection of point p on the image has position (x',y') , given by:
x' = xCenter + x
y' = yCenter + y
In addition to slicing of volumetric data and visualization, we provide needle visualization too. This has been achieved by checking for the needle's presence during data slicing. To determine whether the needle is present in a particular 3D location, say x, we must perform certain tests. First, the projection of x on the needle axis should lie within the needle's length. Let us define a vector y as:
y = x -T
The tests are:
dotProduct( y, needleAxis) = 0
dotProduct( y, needleAxis) < needleLength
Secondly, we must check if the distance of x from the needle's axis is less than the radius of the needle. Let us define a vector w as:
w = y -dotProduct( y, needleAxis)*needleAxis
The test is:
length(w) = needleRadius
If both these tests pass, then needle is present at location x. The needle visualization can be achieved by increasing the brightness of the portions of images where needle is present in proportion to the distance of the location from the needle's axis.
User interface
We designed a graphical user interface for the prototype testing version to allow the trainee to use the system easily. The interface contains four components: Scene Video, Marker initializer, Control Panel, and Dashboard.
Figure 12: Graphical User Interface.
View Figure 12
Figure 12 shows the four components of the interface:
A. Scene Video. This part displays the video that Kinect sensor captures. Once a marker is identified and tracked, a red circle will show up around it. If the marker is correctly tracked, its mass center will overlap with the circle's mass center.
B. Marker Initializer. This part contains three tabs: Probe, Needle and Dummy. For each tab, a model is shown to help illustrate the markers. The user simply needs to click on the "reset" button for the marker to trigger its tracker. Then the marker in the model image would be surrounded with a red boundary. Then the user could easily initialize the marker tracker by clicking on the real marker in the scene video. If the marker is persistently tracked, the user should just click "confirm" and the red boundary of the model marker would turn green to disable the tracker.
C. Control Panel. After configuring all the six markers for the probe, needle and dummy, the user could click the "run" button to start sending the 3D spatial information of them to the renderer and generate the ultrasound image accordingly. If the user could reinitialize the markers at any time by clicking on the "reset" button. The "start" button is the switch for start the video scene.
D. Dashboard. The dashboard is designed to display the 3D spatial information of the markers is captured by the Kinect sensor in real time to make sure the data is collected properly.
Results
A working prototype of the concept has been built which is capable of producing synthetic ultrasound images based on real ultrasound images (Figure 13). The upper left corner window gives the color image captured by the Kinect along with the positions of the markers displayed. The lower left window displays the probe's center and needle's center positions. The lower right window shows the Kinect depth image. The top right corner window shows the visual simulation. This window shows ultrasound images generated based on the position of the probe on the dummy along with the virtual needle visualization. Images are generated in real time and changes in the position or orientation of probe or needle are immediately reflected in the updated images (figure 14).
Figure 13: Demonstration.
View Figure 13
Figure 14: When keyboard is used for moving probe and needle.
View Figure 14
Discussion
The femoral nerve has been chosen as the prototype for this simulator for two reasons. The first reason is theconsistent location of the femoral nerve lateral to the artery which makes tracing the nerve through serial cuts below the inguinal ligaments relatively easy. The second reason is the frequency by which the femoral nerve block is performed as part of the US guided regional anesthesia practice. Femoral nerve block has been considered to be the gold standard of analgesia after total knee arthroplasty in some institutions [10].
Simulation of US guided peripheral nerve blocks improves the performance of the anesthesia trainees. Niazi et al found higher success rate of US guided nerve blocks among trainee who used simulation when compared to those who did not [11]. Another recent study concluded that implementing a real-time feedback-based training has significantly improved UGRA-related cognitive and technical skills and proficiency of pediatric anesthesia trainees [12].
The most important characters in an interactive system are fidelity and latency. The virtual image stream generated by the system should closely match images generated by a functional ultrasound machine. The latency (delay in time) between a change in probe or needle position (or orientation) and the display should be minimal. The information obtained from the tracking module is used for generating synthetic ultrasound images.
The images generated by the simulation system closely match the real US images generated during scanning of the femoral nerve thus fulfilling the fidelity criteria. The images that are generated faithfully reflect changes in the position or orientation of needle or probe almost instantly, thus also meeting the latency criteria. We observed that the reproduced images in response to probe motion are very accurate. However, the needle visualization requires more refinement. It is quite challenging to get the needle in view, which could be beneficial for training purposes. It is our expectation that the needle visualization could be improved by adjusting the mechanical components of the system, such as stabilizing the markers on the block needle. Other stabilization algorithms such as the Kalman Filter [13] can be used to improve the needle visualization. When the position of the needle is controlled using a keyboard (during testing), very stable images like the one shown in Figure 13 are generated.
This prototype system has demonstrated that it is possible to use the Kinect for generating ultrasound images based on the position of the probe on the dummy. The probe itself does not need to be connected to an ultrasound sensor, as we have used real human ultrasound images as a surrogate. This significantly lowered the cost of our simulation system. We have also demonstrated the feasibility of using the Kinect for needle position tracking. Previous studies has shown that US guided simulation can improve performance of the inexperience anesthesia residents and improve the trajectory of their learning curve of US guided nerve blocks [4,14]. In conclusion, our preliminary work showed that a low-cost nerve block training system based on Microsoft Kinect environment for anesthesiologists is feasible and worthwhile of further investigation.
Future Directions
We plan to refine this prototype to include more stable and smaller markers applied to the components of the trainer. The same concept can be applied to reproduce US images for different types of nerve blocks (Popliteal nerve block, brachial plexus blocks,..etc.). In addition, we propose to test the effectiveness of our system in evaluating regional anesthesia skills of each trainee.
Acknowledgements
We are grateful for Rachel Liu's (Candidate for Bachelor of Science in Bioengineering, University of Pennsylvania) help in making the board attached to the probe for fixing the markers and also the stand for the probe.
References
-
P Marhofer, W Harrop-Griffiths, SC Kettner and L Kirchmair (2010) Fifteen years of ultrasound guidance in regional anaesthesia: part 1. Br J Anaesth 104: 538-546.
-
Marhofer P, Willschke H, Kettner S (2010) Current concepts and future trends in ultrasound-guided regional anesthesia. Curr Opin Anaesthesiol 23: 632-636.
-
Mariano ER, Loland VJ, Sandhu NS, Bellars RH, Bishop ML, et al. (2009) Ultrasound guidance versus electrical stimulation for femoral perineural catheter insertion. J Ultrasound Med 28: 1453-1460.
-
Dessieux T, Estebe JP, Bloc S, Mercadal L, Ecoffey C (2008) Evaluation of the learning curve of residents in localizing a phantom target with ultrasonography. Ann Fr Anesth Reanim 27: 797-801.
-
Sites BD, Spence BC, Gallagher JD, Wiley CW, Bertrand ML, et al. (2007) Characterizing novice behavior associated with learning ultrasound-guided peripheral regional anesthesia. Reg Anesth Pain Med 32: 107-115.
-
Magee D, Zhu Y, Ratnalingam R, Gardner P, Kessel D (2007) An augmented reality simulator for ultrasound guided needle placement training. Med Biol Eng Comput 45: 957-967.
-
Rosenberg AD, Popovic J, Albert DB, Altman RA, Marshall MH (2012) Three partial-task simulators for teaching ultrasound-guided regional anesthesia," Reg Anesth Pain Med 37: 106-110.
-
M. levoy (1988) Display of Surfaces from Volume Data. IEEE Computer Graphics and Applications 8: 29
-
M. Levoy (1991) Methods for improving the efficiency and versatility of volume rendering. Prog Clin Biol Res 363: 473-488.
-
Hadzic A, Houle TT, Capdevila X, Ilfeld BM (2010) Femoral nerve block for analgesia in patients having knee arthroplasty. Anesthesiology 113: 1014-1015.
-
Niazi AU, Haldipur N, Prasad AG, Chan VW (2012) Ultrasound-guided regional anesthesia performance in the early learning period: effect of simulation training. Reg Anesth Pain Med 37: 51-54.
-
Moore DL, Ding L, Sadhasivam S (2012) Novel real-time feedback and integrated simulation model for teaching and evaluating ultrasound-guided regional anesthesia skills in pediatric anesthesia trainees. Paediatr Anaesth 22: 847-853.
-
RE Kalman (1960) A New Approach to Linear Filtering and Prediction Problems, Transaction of the ASME. Journal of Basic Engineering: 35-45.
-
Sites BD, Gallagher JD, Cravero J, Lundberg J, Blike G (2004) The learning curve associated with a simulated ultrasound-guided interventional task by inexperienced anesthesia residents. Reg Anesth Pain Med 29: 544-548.
