A diagnosis of an old inferior wall myocardial infarction (IMI) by computerized interpretation of a routinely performed electrocardiogram (ECG) may lead to further consultations and imaging studies to confirm or refute that diagnosis.
This study was designed to assess the value of abnormal Q waves combined with repolarization abnormalities in inferior leads for the diagnosis of an old IMI as confirmed by imaging studies.
Fifty-six patients, in whom computerized interpretation of the ECG resulted in the diagnosis of old IMI, and in whom imaging studies were also available, were included in this study. ECGs were interpreted using the MUSE-GE system. These ECGs were also analyzed by manually measuring the depth and the width of the Q waves and morphology of ST and T-wave changes in inferior leads. Echocardiograms and nuclear medicine cardiac imaging were performed and interpreted using standard equipment and techniques. Measures of accuracy were calculated and reported with 95% exact binomial confidence intervals (CI).
Computerized interpretation of the ECGs leading to the diagnosis of old IMI when compared with IMI confirmed by imaging studies, had a positive predictive value of 52.8% (95% exact CI: 35.5%-69.6%). Adding the manually measured Q waves wider than 40 msec and amplitude of -0.2 mV and repolarization abnormalities in leads II, III and aVF increased the positive predictive value of the test to 86.2% (95% exact CI: 68.3%-96.1%).
These results suggest that the computerized interpretation of ECG results in a high rate of false positive readings of old IMI. Presence of diagnostic Q waves in inferior leads, if accompanied by repolarization abnormalities, improves the accuracy of the ECG for the diagnosis of old IMI.
Inferior myocardial infarction, Q waves myocardial infarction, Repolarization abnormalities, Q waves: positive predictive value, Preoperative electrocardiogram
Often, in the routinely or preoperative 12-lead electrocardiogram (ECG), the presence of Q waves in inferior leads (Leads II,III, aVF), results in a computerized interpretation of an old inferior wall myocardial infarction (IMI). This leads to further consultations, imaging studies, additional costs, rescheduling of the procedures and psychological stress for patients.
The diagnosis of a prior IMI is made if there are pathological Q waves in the inferior leads of the ECG with or without symptoms of myocardial ischemia and imaging studies suggest a loss of viable myocardium in the same region [1-3]. A history of a prior myocardial infarction (MI) diagnosis, confirmed by elevated biomarkers is also an indicator of a previous MI.
Typically the width (duration) and depth (amplitude) of the Q wave is used for the diagnosis of new or previous MI.Q waves are considered pathological when wider than 40 msec in duration and have an amplitude greater than -0.2 mV [4]. Despite general reliance on these ECG findings, there have been no recent studies to assess the predictive value of the Q waves and repolarization abnormalities (ST and T wave) in inferior leads for the diagnosis of old IMI in a routine ECG performed in ambulatory settings.
The aim of this study was to assess the predictive value of abnormal Q-waves, and the role of repolarization abnormalities manifested by ST changes and negative or isoelectric T waves in inferior leads in improving accuracy of the ECG for the diagnosis of old IMI. To achieve this aim, ECG findings were correlated with myocardial scintigraphy, echocardiograms and/or coronary and left ventricular angiograms.
Two thousand five hundred, routinely performed, electrocardiograms were read during the study period of 2 years. Out of these 135 electrocardiograms with a computer-generated diagnosis of old IMI were identified (Figure 1). An IRB approval was granted (IRB # E15047, submission reference # 059266) using an expedited review process. Consent requirement was waived as this was a retrospective study.
Inclusion criteria were a computer-generated diagnosis of an old IMI on an electively performed 12-lead ECG and availability of an echocardiogram, coronary angiograms or nuclear perfusion scan performed in the last one year. Routine ECGs were performed in ambulatory settings. Some of these ECGs were performed for preoperative evaluation. Patients with acute or evolving myocardial infarction were not included. Electrocardiograms were recorded using normal standardization (10 mm/mV), 25 mm/sec speed by the GE MAC - HD 5500 machine. Computerized interpretations of the ECGs were performed using the MUSE GE system. If a patient had multiple tracings, the most recent one was included in the analysis. Manual measurements of the width and the depth of Q waves in inferior leads (leads II, III, or aVF) were performed. A Q wave duration of ≥ 40 msec and a depth of the Q wave of ≥ -0.2 mV were considered suggestive of an old IMI. In addition, the deviation of the ST segment from the baseline by more than 1 mm and polarity of the T wave were also analyzed. Abnormal Q waves and repolarization abnormalities as defined above had to be present in at least two of the three inferior leads.
Echocardiograms, cardiac nuclear medicine imaging and cardiac catheterization coronary angiography were interpreted using standard equipment and techniques. The most recently performed imaging studies were included. Echocardiograms were analyzed for the presence or absence of inferior wall motion abnormalities and wall thickness. Cardiac scintigraphy images were analyzed for inferior wall defects. Defects due to diaphragmatic attenuation were excluded. Coronary angiograms were analyzed for occlusion of the coronary artery accompanied by angiographic evidence of left ventricular inferior wall motion abnormalities such as hypokinesis or akinesis.
Fifty-six patients, who had computer-generated ECG diagnosis of old IMI and who also had imaging studies performed within one year from the index electrocardiogram, were included.
There was no conflict of interest in acquisition of data, conduction of research and final preparation and submission of this manuscript.
Demographic data of the sample were summarized. The accuracy of the computerized interpretation of the ECG was assessed by using imaging studies (echocardiogram or nuclear medicine imaging or coronary and left ventricular angiography) as the gold standard. The following measures of accuracy were calculated: sensitivity, specificity, positive predictive value (PPV), and negative predictive value (NPV). The PPV was also calculated for the computerized interpretation of the ECG combined with the presence of Q waves wider than 40 msec with amplitude of -0.2 mV and repolarization abnormalities. SAS 9.4 software (SAS Institute, Inc., Cary, North Carolina) was used to calculate 95% exact binomial confidence intervals (CI) for the measures of accuracy listed above.
Electrocardiograms with computer-generated diagnosis of old IMI were identified in 135 patients (Figure 1). Diagnostic imaging studies were available in 56 of 135 patients, 30 of these patients had abnormal studies (Table 1). Among the 56 patients included in this study, the average age was 63 years, and 38 (67.8%) were male. The PPV was 52.8% (19/36) and the 95% exact CI was 35.5-69.6. Sensitivity, specificity, and negative predictive value were calculated (Table 2).
 Figure 1: Flowchart, findings of the abnormal ECG and imaging studies.
View Figure 1
Figure 1: Flowchart, findings of the abnormal ECG and imaging studies.
View Figure 1
Table 1: Distribution of the patients with computer-generated diagnosis of inferior wall myocardial infarction and imaging studies. View Table 1
Table 2: Accuracy of computerized ECG for the diagnosis of an old inferior wall myocardial infarction vs. imaging studies. View Table 2
In patients, whose ECG carried a computer-generated diagnosis of old IMI, manual measurement of the width and depth of the Q wave and ST segment and T wave analysis was performed. In 29 patients abnormal Q waves and repolarization abnormalities, characterized by ST segment changes or T-wave inversions in at least two of the three inferior leads were noted (Figure 2). Twenty-five patients who had abnormal Q waves and repolarization abnormalities also had positive imaging studies resulting in a PPV of 86.2% (95% exact CI: 68.3%-96.1%). Four patients (16%) had abnormal Q waves and repolarization abnormalities but imaging studies were normal.
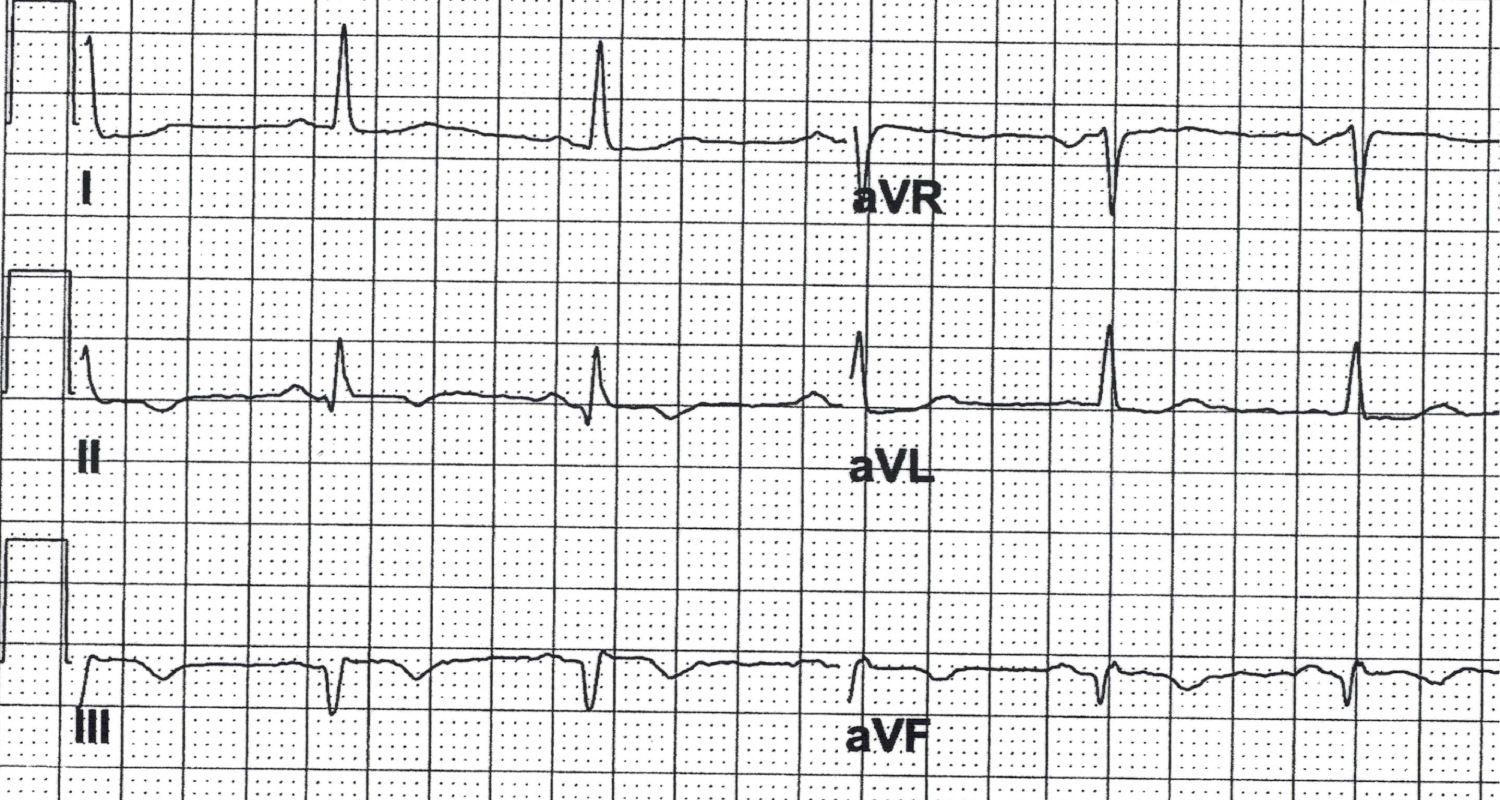 Figure 2: Abnormal Q waves (Duration > 40 msec. Amplitude -0.02 mV) with T-wave inversions.
View Figure 2
Figure 2: Abnormal Q waves (Duration > 40 msec. Amplitude -0.02 mV) with T-wave inversions.
View Figure 2
On a routinely performed ECG, computerized interpretation may suggest a diagnosis of an old IMI on the basis of the Q waves in the lead II, III and aVF. This may lead to further evaluation by imaging studies, consultations and rescheduling of elective procedures.
Historically, there has been a poor correlation between the computer-generated ECG diagnosis of an old IMI and the confirmed diagnosis of an IMI by imaging studies [5]. In our study the PPV was 52.8%. Similar observations have been made by others [6]. Availability of information regarding a patient's clinical history and risk factors for MI could enhance the interpretation of the ECG, however these variables are often not available to the clinician reading the ECGs.
Cardiac MRI is a reliable noninvasive reference standard for the identification and quantification of myocardial infarction. In the studies comparing the presence of Q wave with percent scar tissue on contrast-enhanced MR images, there is generally a good correlation [6,7]. If the infarction involved more than 10 to 15% of the left ventricular myocardium, the likelihood increases that the Q waves would be detected on the electrocardiogram. Routine performance of cardiac MRI in the general population for the diagnosis of an old MI is not feasible, while ECG is an inexpensive and readily available tool.
Studies utilizing cardiac MRI for the diagnosis of MI and its comparison with ECG diagnosis of IMI were not segment specific. In the study performed by Asch, et al. only 23 out of 146 patients with IMI were identified [5]. In most of these studies cardiac MRI was performed within 2 to 3 weeks of the confirmed diagnosis of acute MI. The study population and the methodological approach were quite different from our patient population and our approach. In our study the objective was to identify parameters that could enhance the accuracy of the electively performed ECG for the diagnosis of old IMI.
Pathologic Q waves are related to the size of the MI [8,9]. Large MIs which involve more than 10% of the ventricular myocardium often exhibit significant Q waves, while small infarcts may occur without leaving residual pathologic Q waves on electrocardiogram [10]. This may explain why in some patients with a history of previous MI the ECG findings may not correlate [10]. Stratification based on Q wave area has been shown to predict the size of MI [11]. However, methods for calculating the area of the Q wave are rather cumbersome and therefore are limited in their usefulness.
Q waves in electrocardiograms have been noted in conditions other than MI such as healthy athletes, hypertrophic cardiomyopathy [12], pulmonary disease, preexcitation utilizing posteroseptal accessory pathway, and in the second and third trimester of pregnancy. Transient Q waves may be present in intermittent preexcitation [13], misplaced arm lead electrodes or ischemia [14].
In left ventricular hypertrophy and hypertrophic cardiomyopathy Q waves are generally present in lateral leads. Q waves of ≥ 40 msec duration or > 3 mm depth in the inferior and lateral leads have been considered to be an abnormal finding requiring evaluation to rule out hypertrophic cardiomyopathy prior to participation in competitive sports. Q waves, particularly in limb lead I, can be used to distinguish Q waves in healthy athletes from patients with hypertrophic cardiomyopathy.
It has been speculated that the presence of Q waves on the surface ECG carries an adverse prognosis [15,16]. Pathologic Q waves due to myocardial scar may carry adverse prognostic implications, however physiologic Q waves appear to be benign [17,18]. The PPV of the Q wave alone in inferior leads of the ECG for the diagnosis of old MI appears to be low. In the presence of a scar from previous myocardial infarction, the Q waves may reflect the electrical neutrality of the scar tissue. However, in other situations the Q waves may be a reflection of the position of the heart in the chest and orientation of the electrical vector for a given lead.
If the Q waves in a given ECG leads, are due to orientation and direction of the electrical vector, one can speculate that there may not be repolarization abnormalities in those leads. Such Q waves may be more representative of normal anatomic variation than actual pathology while pathologic Q waves may be accompanied by repolarization abnormalities [19]. Our results are consistent with this hypothesis. Our finding indicates that the patients with abnormal Q waves and repolarization abnormalities in the same ECG leads tend to have abnormal imaging studies (PPV of 83.3%).
Persistent T wave inversion, after the resolution of the ST elevation in patients with acute MI, is considered pathologic. These changes may have diagnostic and prognostic implications [8].
If ECG showed significant Q waves and T-wave inversions in inferior leads, as shown in Figure 2, then further evaluation would be appropriate. In the absence of significant Q waves and repolarization abnormalities that interpretation could be revised. This could result in saving of valuable resources and alleviating the psychological distress of the patient.
Limitations: This was a retrospective collection and analysis of the data. Although large numbers of electrocardiograms were reviewed, the number of patients who had at least one imaging study to be included in this study was a small.
Computer interpretation of ECGs can often result in a high rate of false positive readings for old IMI. The presence of abnormal Q waves, if accompanied by repolarization abnormalities in the same leads, enhances the diagnostic accuracy of the electrocardiogram. Judicious use of imaging studies in this group of patients, if necessary, could eliminate, in a substantial number of patients, the false positive diagnosis of IMI and may help reduce the economic costs and psychological burden.
All the authors declare that there was no conflict of interest.
There was no funding involved in the research and preparation of this project.
IRB institution: Paul foster school of medicine, Texas tech University health sciences Center. El Paso Texas
IRB #: E15047 SUBMISSION REFERENCE #: 059266