Many patients with type 2 diabetes mellitus (T2DM) are on insulin analogues which are costly as well as usage of higher units of insulin on a daily basis increases the cost of the monthly therapy. Concentrated insulin are a way forward for patients who needs higher units of insulin especially Human insulin which address the issues of higher cost and the need for higher concentration in the same or lesser volume of insulin. However, data on 24-hour glycemic control with concentrated insulin in Indian T2DM patients are limited. Hence, this study was conducted to study 24-hour glycemic control in T2DM patients treated with U-200 by measuring the variability in 24-hr blood glucose profile measured using a continuous glucose monitoring (CGM) device over 6 days.
In this prospective, open label single arm, two center study, adult T2DM patients on treatment with human insulin (regular/NPH/Premix) on stable insulin dose were treated with U-200 for 6 days. Variability in 24-hour blood glucose profile was measured by estimating mean amplitude of glucose excursions (MAGE). Duration and frequency of hypoglycemic (< 70 mg/dl) and hyperglycemic (> 150 mg/dl) episodes were recorded.
Sixty patients (mean age of 55.47 ± 9.68 years) were included. Mean number of hyperglycemic and hypoglycemic episodes were 2.64 and 0.22 with mean duration of 165.16 min and 27.35 min respectively. Blood glucose levels were within the normal limits (70-150 mg/dL) for 62.35% of time. MAGE was 77.24 ± 22.50 mg/dL. In this study, not a single patient experienced any adverse event.
U200 insulin led to less glycemic variability, minimal hypoglycemia and efficient glucose control in Indian T2DM patients.
Continuous glucose monitoring, Hypoglycemia, Self-monitoring
Of the worldwide 415 million people with diabetes, India is home to 69.1 million cases, representing approximately 6% of the global population with diabetes [1]. Association between body weight and type 2 diabetes mellitus (T2DM) is well known. Higher levels of free fatty acids in patients with central obesity increase the need of more insulin production and predisposes patient to insulin resistance [2]. Thus, obesity and its associated insulin resistance have contributed not only to increased prevalence of T2DM but also to a rise in the insulin needs of insulin requiring patients with T2DM. Despite the availability of several anti-diabetic agents, most patients with T2DM need addition of insulin in their treatment regimen [2]. Thus, insulin is an indispensable treatment option for diabetes management. Several and long acting insulin analogues are available for the treatment of diabetes mellitus. The traditional insulin formulations (U-100) provide 100 units per milliliter. Apart from some endocrine disorders like polycystic ovarian diseases, Cushing syndrome, and temporary conditions like pregnancy, severe infection, and intake of steroid that cause high insulin resistance thereby increasing total daily insulin requirement, diabetes with obesity has been a common observation in outpatient clinics. Such patients in long run eventually develop high resistance and require ≥ 2 units of insulin per kilogram of body weight daily or > 200 units of insulin daily to meet their insulin needs. Such patients require high volume of insulin, in multiple doses which is painful thus leading to adherence issues.
Therefore, a need of insulin formulations providing high dose at the lower volume was felt [2,3]. In order to fulfill this unmet need, concentrated insulin formulations are prepared. U-200 i.e. r-DNA human insulin premix 30/70, a concentrated insulin formulation which provides 200 IU per milliliter is marketed in India. U-200 is a rapid-acting insulin analog which differs from human insulin in its amino acid profile [2]. The advantages of U-200 insulin include less intra-individual variability as well as reduced injection burden in individuals requiring high-dose and large volume insulin therapy with lower or similar risk of hypoglycemia like U-100 insulin [4]. Data on 24 hour glycemic control with concentrated insulin in Indian T2DM patients are limited. Thus the study was planned to study the 24 hour glycemic variability with use of r-DNA Human insulin premix 30/70 at concentration of 200 IU/mL in patients with T2DM.
The objective was to study 24 hour glycemic control with U-200 (r-DNA Human Insulin Premix 30/70 - 200 IU/mL) in T2DM patients. The glycemic control was assessed by measuring the variability in 24-hr blood glucose profile measured using a continuous glucose monitoring (CGM) device over 6 days.
This was a prospective, open label, single arm, two center, observational study conducted at 2 centers of India; Jothydev's Diabetes Research Centre, Trivandrum, Kerala and Bhatia Hospital, Mumbai during October 2016 to December 2016. Adult T2DM patients between 18-70 years of age treated with regular/NPH or premixed human insulin levels were included. Adult patients between 18-70 years of age having T2DM for minimum six months and on treatment with human insulin (regular/NPH/Premix) on stable insulin dose since last eight weeks were enrolled. Patients with body mass index (BMI) less than 18 kg/m2 and more than 30 kg/m2, those with HbA1c > 9.5% or receiving any insulin other than regular/NPH r-DNA human insulin or on any insulin analogues in last one month were excluded. Patients with modification of concomitant oral anti-diabetic (OAD) medicines regimens or insulin dose in past three months, patients treated with Sulfonylureas, Meglitinide derivatives in last 1 month, history of recurrent hypoglycemic episodes or event of severe hypoglycemia or diabetic ketoacidosis/hyperglycemic hyperosmolar coma in past three months, diabetes related moderate to severe complications, history of surgery, severe trauma, infection or hospitalization in past six months, pregnant and lactating women were also excluded from the study. Before enrollment, informed consent was obtained from eligible patients. The study was initiated after receiving approval from the Independent Ethics Committee.
The demographics, medical history, dietary history, current insulin regimen, concomitant OADs and treatment history were recorded. Variability in 24-hour blood glucose profile was measured by a CGMS device. For this, all study participants were educated about use of CGM device (iPro2, Medtronic, USA). The sensor was deployed under medical supervision at study site and the iPro2 recording device was connected to sensor. All patients were trained on operating procedure of glucometer for self-monitoring of blood glucose (SMBG) and U-200 pen.
All enrolled patients were treated with U-200 (r-DNA Human Insulin Premix 30/70 - 200 IU/mL) pre-filled disposable pens and cartridges for six days. The dose and regimen was continued as per ongoing regimen of patient. Existing dietary habits and physical activity were continued during study period. They were also be informed about possible adverse events/signs of hypoglycemia and advised to inform the investigator in event of adverse event/CGM device malfunctioning. Time of meals, time and dose of insulin administration and blood glucose levels at different time points were reported in patient diary by the patients till the next study visit. Minimum three readings i.e. pre-breakfast, pre-lunch, pre-dinner were taken at eight hour intervals for proper calibration of device.
The CGM device was removed on day seven (Visit 2) and CGM readings were recorded. The evaluation parameters included percentage of patients within acceptable glycemic range, Mean Amplitude of Glucose Excursions (MAGE) [5] and duration and frequency of hypoglycemic (< 70 mg/dL) and hyperglycemic (> 150 mg/dL) episodes. Patients were educated about the CGMS device as the part of informed consent process and study procedure by the Investigator or the person designated by the Investigator. Used/unused cartridges and pen device were collected to ensure appropriate insulin doses during entire study period and adverse events if any were recorded. Patients were advised further management as per investigator discretion and patients' choice (Figure 1).
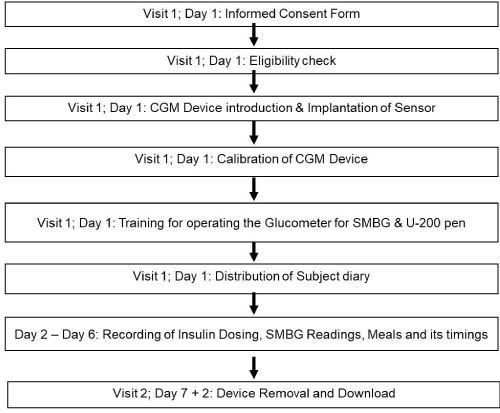 Figure 1: Study Flow Chart. View Figure 1
Demographic data such as age, sex, weight, was summarized using descriptive statistics. Time spent in acceptable glycemic range, MAGE, frequency and duration of hypoglycemic (< 70 mg/dL) and hyperglycemic episodes (> 150 mg/dL) was reported using statistical measures viz. n, minimum, maximum, mean, standard deviation and coefficient of variation for duration of 5 days (Day 2 [00:00 Hrs] to Day 6 [24:00 hrs]) collectively and separately for each day of study. Incidence of adverse events, serious adverse events (SAEs) and any other categorical data was summarized using frequency, proportions and 95% confidence intervals.
A total of 60 subjects (36 male and 24 female) were enrolled in the study and all subjects completed the study successfully as measured by completion of the CGMS recording from implantation (visit 1) to removal of the device which is 7th day (visit 2) Mean age of the patients was 55.47 ± 9.68 (26 to 70) years. Other baseline demographic characteristics of study patients are given in Table 1.
Table 1: Demographical Characteristics of T2DM patients treated with U-200 (r-DNA Human Insulin Premix 30/70 - 200 IU/mL). View Table 1
Mean daily dose of U200 among the study participants was 18.20 IU with mean morning dose of 11.42 IU and mean evening dose 7.35 IU. Total 55% patients were on monotherapy of metformin or vildagliptin and 45% patients were receiving dual drug therapy along with study medication (Table 2).
Table 2: Concomitant medications in T2DM patients treated with U200 Insulin. View Table 2
Mean number of hyperglycemic and hypoglycemic episodes were 2.64 and 0.22 with mean duration of 165.16 min and 27.35 min respectively. Blood glucose levels were within the normal limits (70-150 mg/dL) for 62.35% of time (Figure 2). MAGE was 77.24 ± 22.50 (37.47 to 153.00) mg/dL.
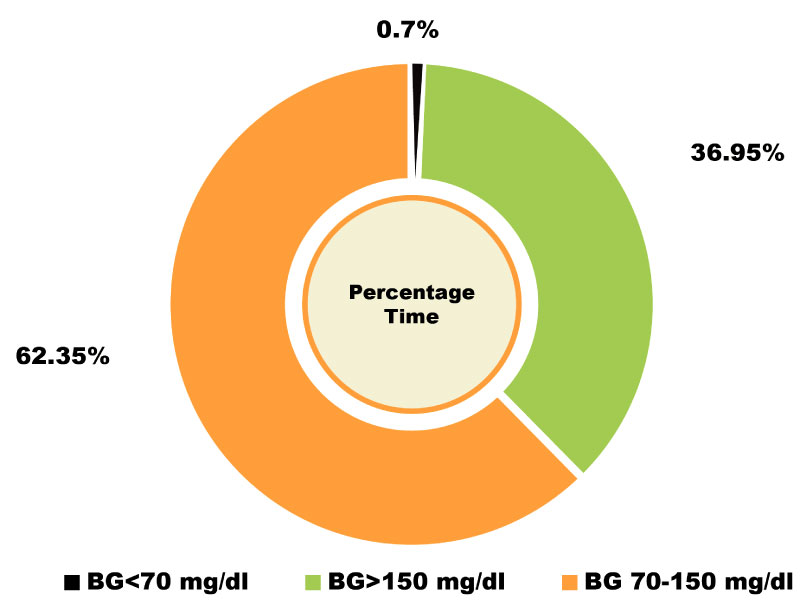 Figure 2: Percentage time spent by T2DM patients treated with U200 Insulin in respective blood glucose levels. BG: Blood Glucose. View Figure 2
The mean blood glucose level was 151.75 ± 23.93 (105.73 to 231.69) mg/dL and mean was 6.93 ± 0.80. Profile of mean blood glucose levels stratified by meal timings and 24-hour blood glucose monitoring levels in T2DM patients treated with U200 Insulin are depicted in Figure 3 and Figure 4 respectively.
 Figure 3: Profile of mean blood glucose levels by meal timings in T2DM patients treated with U200 Insulin. View Figure 3
 Figure 4: 24-hour blood glucose monitoring levels in T2DM patients treated with U200 Insulin. View Figure 4
Medication adherence rate was 100% with no adverse event other than minor hypoglycemia reported. No deaths or other serious adverse events occurred during the study period.
Blood glucose control (As per American Diabetes Association {ADA} 2019 a glycemic target [HbA1c] of < 7%) is the primary goal of diabetes management in which blood glucose monitoring plays a critical role [6]. Continuous blood glucose monitoring system may be a preferred option than self-monitoring of blood glucose in this regard as it provides more insights regarding the blood glucose levels, rate of blood glucose variability and signals of hypoglycemia and hyperglycemia, thus highlighting areas that require greater attention. It has also been proven to be highly advantageous in motivating and increasing the therapy compliance among the patients [7-15]. In this study, we evaluated 24 hour glycemic control by using CGMS device for 6 days, in T2DM patients treated with U-200.
200 IU human insulin is 2 times more concentrated than 100 IU human insulin, and 5 times more potent than 40 IU human insulin that are available in the market. Concentrated insulins offer less pain and discomfort. Concentrated insulins address the high insulin requirements of the growing population of patients with T2DM who require higher insulin doses than permitted in a single injection with currently available pens. Smaller volume of injection allows fewer injections and thus overall enabling better patient adherence to therapy.
Use and benefits of concentrated insulin in obese patients or those with high insulin resistance are known [4]. We did not include obese patients in this study. The mean weight of patients in this study was 65.35 kg. Overall, 62.35% time, patients in our study spent time in the acceptable blood glucose level. Reference ranges for Indian patients regarding ideal time in the acceptable blood glucose range are lacking. A study among healthy subjects recommended less than 12% time to be spent in with blood glucose level 70 mg/dl or below [16]. In our study, the time spent in hypoglycemic range was only 0.7%. Another study reported 1.4% time spent in hypoglycemia by patients admitted for glycemic control [17]. Slightly lower time spent in hypoglycemia range with U200 could be explained by more vigilant intervention in admitted patients compared to patients treated on outpatient basis. Our study included only ambulatory patients. Based on the observations of a study conducted in healthy subjects, Zhou and colleagues have recommended less than 17% time to be spent in the blood glucose level 140 mg/dL or above [16]. In current study, patients with T2DM spent 36.95% time in hyperglycemia range. Indian guidelines on recommendation on ideal time to be spent in hyperglycemia, normoglycemia and hypoglycemia for type 2 diabetes subjects are required. A study by Torimoto K, et al. in Japanese T2DM patients admitted for glycemic control reported 67.2% time being spent at the glucose level of 140 mg/dL or above [17]. In our study, we examined time spent at or above sugar level of 150 mg/dL. Higher time spent in hyperglycemic range in a study by Torimoto K, et al. could be because of two reasons. First, the criteria for defining hyperglycemia in previous study was lower than our study and secondly, we included outpatients on stable dose in contrasts to patients admitted for glycemic control in previous study.
Minor hypoglycemic episodes are most likely missed by diabetes patients. Acute hypoglycemia can result in severe complications; hence a formulation not causing frequent hypoglycemic episodes is preferred in diabetes management. In our study, there were only 0.22 mean episodes of hypoglycemia. Glycemic variability is common concern in patients with T2DM due to its potential to cause adverse impact mainly on the cardiac health and other complications [18-21]. Several factors including diet, exercise, oxidative stress and psychological factors contribute to the variation in level of glucose [22-23].
A study has shown that glycemic variability is an independent risk factor for cardiovascular risk in T2DM patients with good glycemic control. Mean amplitudes of glycemic excursion (MAGE) was shown to be an independent factor for high 10-year cardiovascular risk [19]. In our study, MAGE was 77.24 (± 22.50) mg/dL. The episodes, number of patients and duration of hypoglycemia were lower compared with hyperglycemia during study period. The MAGE in our study was much lower than reported in other study conducted in patients admitted for glycemic control (77.24 vs. 110.3 mg/dL) [17]. In another study (n = 108), CGMS wore for five days showed minimum one hypoglycemia episode in 49.1% and three forth of them experienced minimum one asymptomatic hypoglycemic episode [24].
Another study comparing daily glucose excursion in T2DM patients receiving same dose of biphasic insulin as part 30 vs. biphasic human insulin 30 reported higher MAGE than observed in our study [23,25]. The difference could be explained by inclusion of patients with inadequate control in that study as opposed to patients on stable insulin dose in our study.
No adverse event were reported other than mild hypoglycemia (events requiring minimal or no treatment and do not interfere with the patient's daily activities) [6] in this study. Overall, we observed that r-DNA human insulin premix 30/70 - 200 IU/mL effectively controls 24 hour blood glucose level in T2DM patients without significant adverse events. Our observations suggest that U-200 can be started in T2DM patients requiring high dose of insulin, thereby enhancing the adherence to treatment and better glycemic control. Our study has some limitations. Two center, open label study and short duration of follow up limit generalization of observation to the entire diabetes population. Larger randomized clinical trials are required to confirm findings of our study.
Concentrated insulin U200 (r-DNA Human Insulin Premix 30/70 200 IU/mL) demonstrated low intraday variability as measured by MAGE of 77.24 mg/dL. Patients spent 62.35% of time within normal glucose limits, allowing for a more constant action with less frequent hypoglycemic or hyperglycemic excursions. Thus, U200 insulin led to less glycemic variability, minimal hypoglycemia and efficient glucose control in Indian T2DM patients.
Nil.
Study was sponsored by Wockhardt Pharmaceuticals Limited. The three authors named as Dr. Shahu Ingole, Dr. Jayesh Rajgopal and Dr. Rishi Jain is employees of Wockhardt Pharmaceuticals limited.