The change in cell size and alterations in the distribution of cells at different phases of the cell cycle are indicators of change in cell homeostasis. In this study, the HEp-2 cell line cells were treated for 24 hours by two shapes of Gold nanoparticles (GNPs): Gold nanospheres (GNSs) and Gold nanorods (GNRs). The cytotoxic effect of GNPs was evaluated by different methods. The MTT assay revealed that GNPs have a cytotoxic effect on HEp-2 cells and the GNRs are more toxic than GNSs. Image morphometric analysis showed a decrease in the mean values of Nuclear Area Factor (NAF) of HEp-2 cells treated with GNPs when compared to control cells. We found that cell size decreased in cells treated with GNPs and most of the cells were in S-phase and decreased at G2-phase of the cell cycle when compared to control cells. Also, it was noted that in cells treated with GNSs the apoptotic features increased with increasing concentration from pre IC50 to post IC50, contrary to cells treated with GNRs the apoptotic features decreased with increasing concentration from IC50 to post IC50. Cell size and cell cycle distribution changed after treatment by GNPs. The GNRs may be more toxic than GNSs.
HEp-2 cell line, Gold nanorods, Gold nanospheres, Forward scatter histograms, Flow cytometry
Cell size is an important parameter in histopathology as the change in size may indicate cancer and/or cell damage (as atrophy, hypertrophy and disturbed cell membrane). Increasing the amount of DNA is associated with an increase in cell size [1]. The cell cycle is divided into four phases: G1, S, G2 and M consequently. A phase does not start unless the previous one is complete [2]. To maintain the cell size or decrease the dispersion of size, the cell cycle progresses with the attainment of a critical size [3]. To achieve this goal, G-phase allows cells to form mass before physical division to prevent them become smaller with every division [1]. All phases of the cell cycle are present in cell cultures, simultaneously undergoing progression and cell division [4]. However, in malignancy, there is an acceleration of the cell cycle due to alterations in the genome [5]. During cell death, the size of cells is changed. For example, the apoptosis is characterized by cell shrinkage, nuclear fragmentation, nuclear shrinkage, irregular nuclear outline and chromatin condensation [6]. On the other hand, the necrosis is associated with increases in cell size, eosinophilic cytoplasm and patchy chromatin. Also, cell swelling occurs in secondary necrosis [7]. The uptake and internalization of nanoparticles to cell during cell cycle depend on several factors such as: The phase of cell cycle [8-10], the degree of closeness between cells [11], and cell density [4]. According to Kim, et al. G2/M > S > G0/G1 is the ranking of the uptake of nanoparticles during cell cycle after 24 hours [4].
Easy manipulation, optical features, heat production and non-toxic nature make GNPs excellent tools in imaging, drug delivery and photothermal therapy [12]. GNPs can destroy cancer cells with minimum damage to normal healthy cells because cancer cells are vulnerable to the GNPs [13].
The effect of GNPs varies according to several factors such as shape [14], size [15], the concentration of particles [16], duration of treatment [17] and type of cell studied [18]. Regarding the shape, they classified GNPs as spherical and non-spherical particles [19]. In the current study, we investigate the effect of two different shapes of GNPs on cell size and cell cycle distribution of HEp-2 cell line.
Head and Neck Squamous Cell Carcinoma (HNSCC) HEp-2 cell line was obtained from Cell Culture Department (VACSERA-EGYPT). Cultured cells were divided into two groups: the first group was the control untreated cells, and the second group was HEp-2 cells treated with GNPs. The second group was further divided into GNSs treated HEp-2 cells and GNRs treated HEp-2 cells. GNPs were synthesized based on the chemical reduction of the Gold (Au3+) aqueous solution with citrate ions [20]. In case of GNRs, a seed-mediated approach by using silver seeds was followed [21]. Size & Shape: TEM were performed on JEOL JEM-2100 high-resolution transmission electron microscope at an accelerating voltage of 200 Kv (Figure 1).
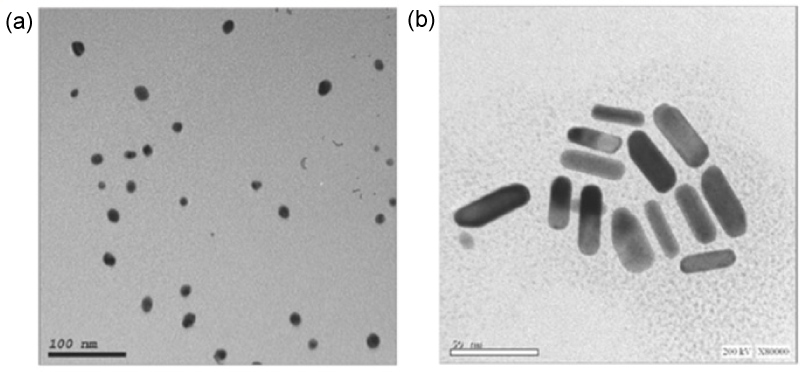 Figure 1: TEM images showing a) Spherical shape of particles of GNSs; b) Rod shape of particles of GNRs. View Figure 1
MTT assay utilizes yellow tetrazolium salt (3-[4,5-dimethylthiazol-2-yl]-2,5-diphenyltetrazolium bromide) which is water-soluble salt and is reduced to an insoluble purple MTT-formazan complex by cleavage of the tetrazolium ring by Lactate Dehydrogenase (LDH) within the mitochondria. This reduction takes place only when mitochondrial reductase enzymes are active, thus the conversion can be directly related to the number of viable (living) cells. The MTT viability test measures the cell proliferation rate and conversely, when metabolic events leading to apoptosis or necrosis, there is a reduction in cell viability. The resulting intracellular purple formazan crystals can be solubilized and quantified by spectrophotometric means [22]. Different concentrations of GNSs and GNRs are showing in (Table 1).
Table 1: The concentrations GNPs on HEp-2 cell line after 24 h. View Table 1
Hematoxylin and Eosin Staining was applied after slide preparation by following steps:
• The fixed slides were rehydrated in descending concentrations of alcohol (100%, 90%, 75% then 50%) and then washed in distilled water for 5 min.
• The slides were immersed in filtered hematoxylin stain for 3 min and then washed with distilled water twice.
• The slides were immersed in filtered eosin stain for 5 seconds and then washed with distilled water.
• Dried slides were immersed in xylene, mounted with Canada balsam then coverslips were placed and left to dry.
Ten microscopic fields of each slide were photomicrographed at the power of 400X. This was done using a digital camera mounted on a light microscope (Leica, DM 2700). Then, images were transferred to the computer system for analysis. Field selection was based on the presence of the highest number of apoptotic cells. The photomicrographs were evaluated for the presence of morphological criteria of apoptosis.
The photomicrographed fields were analyzed using image analysis software (Image J, 1.27z, NIH, USA). Images were automatically corrected for brightness and contrast. Corrected images were converted into 8-bit grayscale type. Phase color coding of the desired area was done automatically. The color threshold was adjusted to select the nuclei of HEp-2 cells. To standardize the method for all analyzed images, efforts were made to minimize the operator guided in favor of the automatic thresholding throughout this step. The surface area and circularity of the nuclei were automatically measured. Nuclear area factor was calculated using the following formula [23].
Nuclear area factor = Circularity × Object area,
The data were then tabulated in Microsoft Excel sheet (Microsoft Office 2010®).
Flow cytometric DNA analysis was done using the fluorescence-activated cell sorting (facscan) flow cytometer, becton and Dickinson (B-D), Sunnyvale, CA).
Metals nanostructures have unique electrical, optical and thermal properties because of their higher surface-to-volume ratio, electron plasmon resonance, and quantum confinement effects [22]. Currently, GNPs have been studied for medical applications as therapeutic and drug delivery agents. The researchers tried to review promising applications of GNPs in chemotherapy of cancer highlighting in-vitro efficacy studies in the recent studies [24]. In the current study, the MTT assay revealed three main information: Firstly, the GNPs had cytotoxic effects when compared to control cells. Secondly, the GNRs are more cytotoxic on HEp-2 cells than GNSs. Finally, the viability percentages of cells are decreased by increasing the concentrations of GNRs and GNSs (Figure 2). The curve of toxic concentration range for GNRs was found to be widely below the ones observed for GNSs. This can be explained by: 1- Cetyl Trimethylammonium Bromide (CTAB) molecules form a bilayer on the surface of the GNRs and it also gives a toxic character to GNRs [25,26], 2- the GNRs have rough surface when compared with the GNSs, and this play a role in internalization to the cell [27]. The TEM images showed that the GNSs have around the shape and a smooth surface whereas the GNRs have four tips or angles at the surface, 3- the viability test also revealed that the GNRs induce early inhibition than GNSs. The reason of this is the responsibility of roughness in cell membrane disruptions. The damage to the plasma membrane is due to the decreasing lipid bilayer stability [17] and 4- The cationic surface charge of GNRs makes them more toxic than the anionic charge of GNSs. The GNRs gain a positive charge from the cationic surfactant CTAB [24] and the GNSs have a negative charge due to the citrate anions.
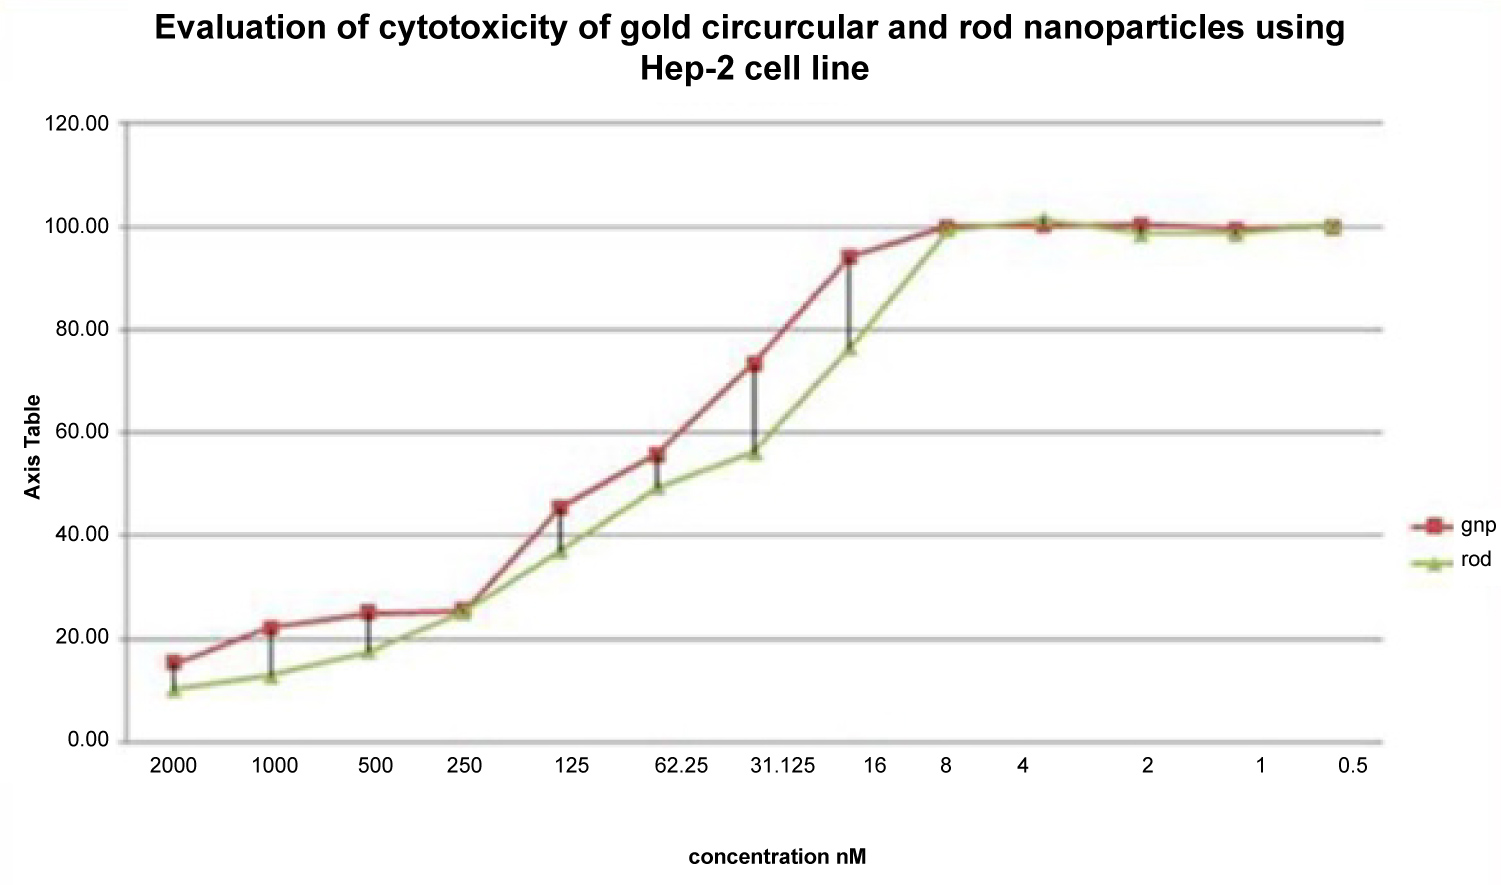 Figure 2: Comparison between cell viability of HEp-2 cells treated with GNPs. View Figure 2
Surprisingly, we noted that the morphology of necrosis and cell debris were dominant at a pre-IC50 concentration of GNSs and GNRs after 24 hours. These findings propose that the necrosis is the essential mechanism of death at those concentrations. Concerning the IC50 concentration of both GNSs and GNRs after 24 hours, the early apoptotic morphological changes such as nuclear shrinkage, nuclear fragmentation, irregularities in the nuclear membrane, the beginning of peripheral chromatin condensation, blebbing of the cell membrane that contains organelles and apoptotic bodies [6] were more obviously seen. Moreover, the criteria of necrosis and cell debris became less than those at pre IC50 of both GNSs and GNRs. Furthermore, features of secondary necrosis were also seen. Thus, as appeared in the present study there was a synergetic mechanism occurred in cell death between apoptosis and necrosis. Despite that the apoptosis plays the big part at IC50 concentrations of GNPs. The HEp-2 cells treated with post IC50 concentrations of GNSs and GNRs for 24 hours have shown apoptotic morphological changes, necrotic features and secondary necrosis. The necrotic criteria, cell debris and secondary necrosis were more dominant in post IC50 concentration of GNRs than those of GNSs after 24 hours. Furthermore, the adhesion between cells became more obvious at post IC50 concentration of GNRs. The adhesion occurred between cells as the GNPs increase the secretion of Intercellular Adhesion Molecule 1 (ICAM-1) and this might play a role in tumor cell lysis [28]. So, the main death mechanism at post IC50 concentration of GNSs is probably apoptosis while the necrosis and apoptosis work together at post IC50 concentration of GNRs (Figure 3 and Figure 4).
 Figure 3: A photomicrograph of a) Control HEp-2 cell 24 hours post treatment showing pleomorphism, hyperchromatism and cell with nuclear shrinkage (blue arrow); b) HEp-2 cell 24 hours post treatment with pre IC50 concentration of GNSs showing nuclear fragmentation (black arrow), necrotic body (red arrow), patchy chromatin (yellow arrow), necrotic cell with cellular swelling (brown arrow), necrotic cell with cell swelling (blue arrow) and cell debris (green arrow); c) HEp-2 cell 24 hours post treatment with IC50 concentration of GNSs showing apoptotic body (green arrow), nuclear fragmentation (red arrow), secondary necrotic cell (blue arrow), membrane blebbing (black arrow), necrotic body (yellow arrows) and nuclear shrinkage; d) HEp-2 cell 24 hours post treatment with post IC50 concentration of GNSs showing necrotic body (red arrow), necrotic cell with patchy chromatin (yellow arrow), apoptotic body (green arrow), irregular nuclear outline (brown arrow), nuclear fragmentation (black arrows) and membrane blebbing (blue arrow), (H & E × 1000 oil). View Figure 3
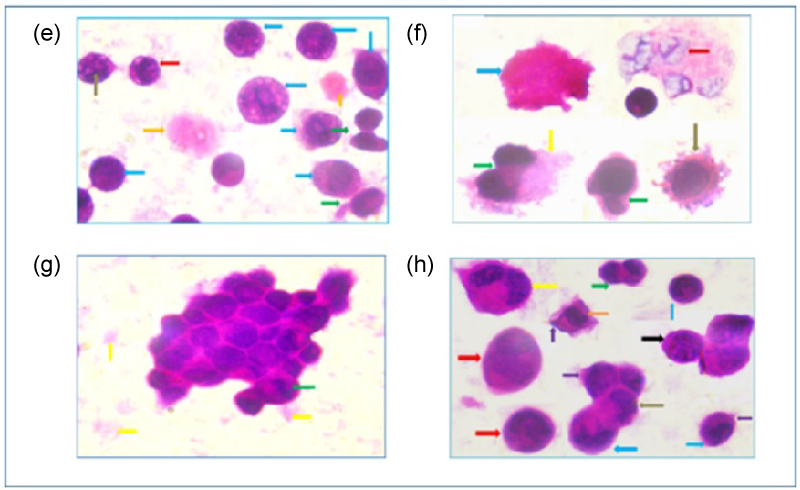 Figure 4: A photomicrograph of e) HEp-2 cell 24 hours post treatment with pre IC50 concentration of GNRs showing irregular nuclear outline (red arrow), nuclear fragmentation (brown arrow), necrotic bodies (orange arrows), necrotic cell with patchy chromatin (blue arrow) and apoptotic bodies (green arrow); f) HEp-2 cell 24 hours post treatment with IC50 showing necrotic cells with cellular and nuclear swelling (red arrow) membrane blebbing contain organelles and nuclear fragmentation of apoptotic cell (brown arrow), necrotic cell with cellular swelling (blue arrows), apoptotic body (green arrows) and cell debris (yellow arrow); g) HEp-2 cell 24 hours post treatment with post IC50 concentration of GNRs showing aggregation of cells, peripheral chromatin condensation (green arrow) and cell debris (yellow arrows); h) HEp-2 cell 24 hours post treatment with post IC50 concentration of GNRs showing necrotic cell with cellular swelling (red arrows), apoptotic bodies (green arrow), nuclear shrinkage (blue arrows), irregular nuclear outline (orange arrows), a secondary necrotic cell (yellow arrow), cell adhesions (brown arrows), cell adhesion of necrotic cells with patchy chromatin (black arrow) and membrane blebbing (violet arrows), (H & E × 1000 oil). View Figure 4
The statistical analysis showed a highly significant decrease of the mean NAF of HEp-2 cells treated with GNSs and GNRs independently when compared with control cells after 24 hours (p < 0.0001). These results indicate the occurrence of apoptosis. Increasing the concentrations of GNSs from pre IC50 to IC50 to post IC50 showed a statistically insignificant decrease in the mean value of NAF after 24 hours (p = 1.00). Regarding GNRs, statistical analysis revealed that there was a highly significant decrease in the mean value of NAF after 24 hours from pre IC50 to IC50 concentrations (p < 0.0001). Also, the lowest reduction in mean value of NAF occurred at a pre-IC50 concentration of GNRs when compared to the control cells. So, at this concentration, the essential way of cell death is probably necrosis. On the other hand, there was a statistically insignificant increase in the mean of the value of NAF from IC50 to post IC50 concentration of GNRs after 24 hours (p = 0.441). This increase might be explained by the presence of adhesions between cells and a notable amount of necrosis due to the action of ICAM-1.
In the present study, the changes in cell size during cell cycle were evaluated by forward scattering histograms of flow cytometry assay [29,30]. The FSC histograms revealed that there was the reduction in cell size increased by increasing concentrations of GNSs (Figure 5 and Figure 6). These results were confirmed by cytological examination and image morphometric analysis which revealed that there was an increase of apoptotic features by increasing concentrations of GNSs.
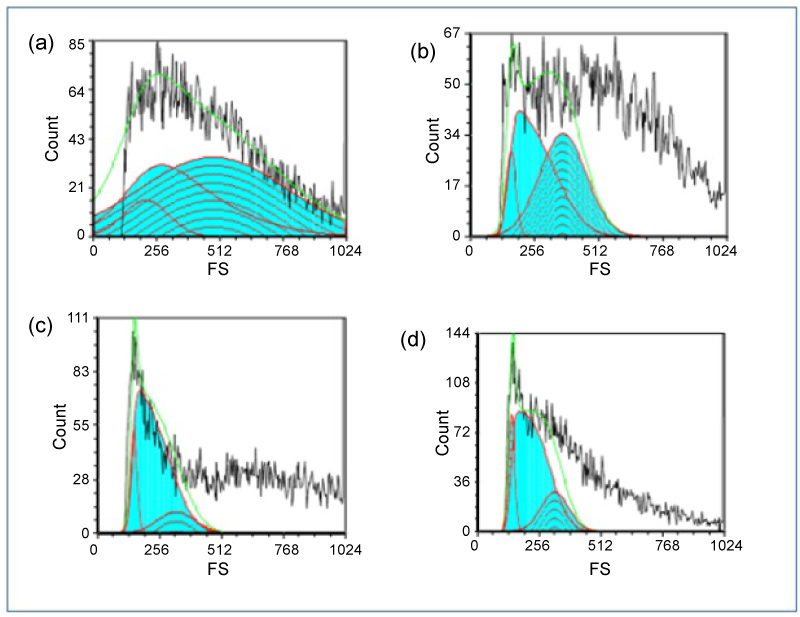 Figure 5: Forward scatter histogram of a) Control HEp-2 cells showing the mean size of cells in cell cycle; b) Pre IC50 concentrations of GNSs treated HEp-2 cells showing the mean size of cells in cell cycle; c) IC50 concentrations of GNSs treated HEp-2 cells showing the mean size of cells in cell cycle; d) Post IC50 concentrations of GNSs treated HEp-2 cells showing the mean size of cells in cell cycle. View Figure 5
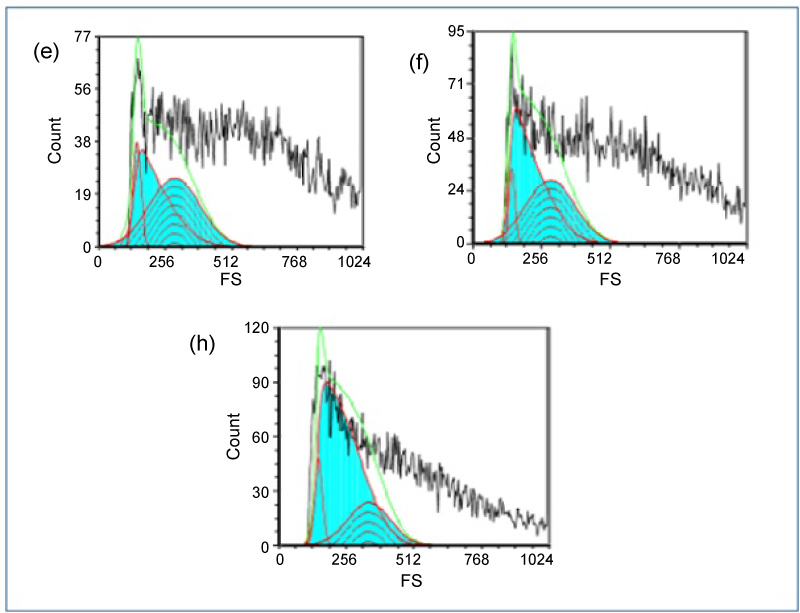 Figure 6: Forward scatter histogram of e) Pre IC50 concentrations of GNRs treated HEp-2 cells showing the mean size of cells in cell cycle; f) IC50 concentrations of GNRs treated HEp-2 cells showing the mean size of cells in cell cycle; h) Post IC50 concentrations of GNRs treated HEp-2 cells showing the mean size of cells in cell cycle. View Figure 6
Regarding the group treated with GNRs, the cytological examination and image morphometric analysis revealed that the apoptotic changes increased from pre IC50 to IC50 of GNRs and then the apoptotic changes decreased from IC50 to post IC50 of GNRs. These results were confirmed by flow cytometry data as the cell size decreased with increasing concentrations of GNRs from pre IC50 to IC50. However, there was an increase in cell size from IC50 to post IC50 which means that there was a decrease in apoptosis with increasing concentration from IC50 to post IC50.
Data obtained from flow cytometry results also denoted that there was an increasing percentage of cells at S-phase followed by a decrease at G2-phase in cells treated by GNPs when compared to control cells after 24 hours (Table 2). This reduction in percentages of cells can be explained by the effect of GNPs on cells as the GNPs induced DNA damages [31] by their effects on mitochondria or/and by facilitating the formation of reactive oxygen species. Thus, GNPs might suppress the DNA synthesis at S-phase.
Table 2: The effect of different shapes and concentrations of GNPs on cell cycle distributions of HEp-2 cells. View Table 2
In the current study, the cell cycle distribution of GNRs treated HEp-2 cell line indicated that the amount of apoptosis is more than that in GNSs after 24 hours which means that the DNA damage is more evident than in GNRs. Thus, different shapes of GNPs have different cytotoxicity levels on Hep-2 cells. The GNRs are probably more toxic than GNSs.
This work was supported by STDF (5505, 2015), Minia University and Assiut University.