Lead exists naturally in the earth's crust and it is widely used as a heavy metal. It is an environment toxicant that may deleteriously affect nervous, hematopoietic, skeletal, renal, endocrine and reproductive systems. So, exposure to lead in the environment continues to be a serious public health problem for all ages. Children are particularly susceptible to lead poisoning. They absorb more lead from their environment and their developing central nervous systems are vulnerable to the toxic. Fifty percent of children aged from 0 to 17-years-old presented blood lead levels above 100 μg/L and forty three percent of the same population presented blood lead levels above 50 μg/L. There was no correlation between urinary lead level and D-ALAU (urinary δ-aminolevulinic acid) with lead blood levels. But it was observed a small correlation between urinary lead and blood lead concentrations.
Blood lead, Urinary lead, Urinary δ-aminolevulinic acid, Levels, Children and Kinshasa
Lead is a heavy metal mainly in the earth's crust. Up to now, no health benefits to humans have been reported for this metal or its compounds. It is an environment toxic affecting deleteriously nervous, hematopoietic, skeletal, renal, endocrine and reproductive systems. It is classified in its inorganic form as possible human carcinogen (group 2A) by International Agency for Research on Cancer (IARC). So, exposure to this metal in the environment continued to be a serious public health problem for all ages [1-9].
Compared to adults, children were particularly susceptible to lead poisoning because they are in the phase of growth and development and have immature detoxication capabilities. Hand-to-mouth activities and playing pattern may intake more this toxic metal. In addition, children absorbed more lead from their environment and their developing central nervous systems are vulnerable to the toxic. Studies have reported associations between blood lead levels of ≥ 100 μg/L, the threshold of lead poisoning defined by WHO and the Centers of Disease Control and Prevention, and impaired growth and cognitive development, attention and behavioral problems among children can be taken in account with many cautions. These effects persist into adulthood and appear to be irreversible [10-19].
Lead can be toxic to humans and produce multiple adverse health effects, even at low levels of exposure, due to his ability to accumulate in the environment and organisms. (WHO, 2007) Today, a solid scientific consensus exists that exposure to even low levels of lead reduces intellectual quotient (IQ) and causes profound developmental disorders in children [3,12,20-23].
In 2007, the « Declaration of Brescia on Prevention of the neurotoxicity of metals » proposed a reduction of blood lead action level to 5 μ/dl as new evidence accumulates on toxicity at still lower blood lead levels. Thus, US, CDC accepted the recommendation by the Advisory Committee on Childhood Lead Poisoning Prevention that a blood level reference value of 5 μg/dl be used to identify children with elevated blood levels [24,25].
During the last twenty years, important measures of public health were undertaken in many high-income countries to decrease lead exposure. Recent National Health and Nutrition Survey data on lead exposure in the United States indicates that the average blood lead level in population is 1.6 μg/dl and 1.91 μg/dl in children 1-5 years of age, a dramatic decline from the averages of 10-20 μg/dl measured in 1976-1980 [26]. In Europe, the means of blood lead levels for non-exposure people depend to any country: 4.86 μg/dl in Belgium and 1.51 μg/dl for children 1-6 years in France. This remarkable public health achievement of the decade can be attributed to the reduction of lead exposures from automobiles, house paints, drinking water and consumer products [26,27].
Gasoline sold in most African countries contains 0.5-0.8 g/L of lead. Programs to reduce the environmental lead levels and exposure has been eschewed in most countries of the continent but in urban areas and near mining centers, high concentrations of lead in the air have come quite common [27].
In Democratic Republic of Congo, the leaded gasoline and leaded paint are remaining in common uses and little is known about lead exposure. A pilot study was carried out in order to determinate the level of lead in blood from 485 healthy people living in Kinshasa between May 2003 and June 2004 by using atomic absorption with graphite furnace as dosage method. This study has reported a geometric mean blood lead of 120 μg/L (IC 95%: 115-125) and sixty-three percent of children aged less than 6-years-old with blood lead levels above 100 μg/L [28].
There were also others potential sources of exposure to lead in Kinshasa area as lead food, lead drinking water pipes, recycle metal utensils. Some literatures showed that vegetables cultivated along the side of the main roads of the city contained high lead levels [29-32].
During the last twenty years, important measures of public health were undertaken in several countries to decrease lead exposure. In our knowledge, this is not the case in D.R. Congo and there are no routine screenings and monitoring processes for lead exposure. Few studies were done in D.R Congo to determine lead level. Joel, et al. indicated a relatively important lead impregnation of the Kinshasa population (mean 120 μg/L) [28]. In addition, there had been no reported studies in the evaluation of the relationship between urinary lead and urinary δ-aminolevulinic acid as well as the lead blood level in Congolese children. This was the aim of the present study.
Kinshasa is a metropolitan area in the southwest of the DRC that spans 9,965 km2 or 0.42% of the national territory. It is located to the west of the country between 3.9 and 5.1 degrees south latitude and between 15.2 and 16.6 degrees east longitude. It is bordered in the northeast and east by the province of Bandundu, to the south by the province of Kongo central, north-west and west by the Republic of Congo Brazzaville, a liquid boundary formed by part Congo River. It is divided into four districts and 24 municipalities. There are no industries in the place of study susceptible to release significant amounts of lead in the atmosphere.
This study was conducted on children population living in Kimbanseke city wish is an urban commune in the south-east of Kinshasa, south of the communes of Ndjili and Masina. It is one of the new settlements, located in the hilly area. It is the most populated municipality of Kinshasa since 1980s, it is also one of the largest urban communes of the city-province of Kinshasa with nearly a million inhabitants.
This study was conducted from November 2012 to May 2013. Participants were randomly selected from children between 0 and 17 years of age. The design of the study was approved by the ethical committee of Public School of the University of Kinshasa (UNIKIN) on 18th January 2013. Parents were provided with a written description of the study and asked to fill-in a structured questionnaire and to sign a voluntary consent before their children participated in the study. The questionnaire consisted on factors such as age, gender, distance between house and road traffic. 100 children were recruited.
Venous blood samples (5-7 ml) of each person were collected by a trained nurse. The puncture point was cleansed with alcohol, soapy water and then distilled water. Each sample was placed in a 10 ml lead-free Li-heparin tube. All samples were immediately refrigerated and shipped (8 h travel time) to the laboratory of toxicology in Belgium (ULg), where they will be refrigerated at -20 ℃ until they were processed.
Urine and blood: Blood lead and urinary lead levels were measured using inductively coupled plasma mass spectrometry. The blood sample above 100 μg/L was confirmed with a second analysis andthe concentration of lead in the urine was reduced per gram of creatinine in order to standardize the results and allow comparison with the reference values. The Bio-Rad ALA/PBG by column test and spectrophotometer methods were used to quantify the concentration of δ-aminolevulinic acid (D-AlaU) in urine.
All data were introduced into a database built with the software Foxpro 2.5. The analyses were performed with the SAS V6.12 software package. The analysis of variance (ANOVA) and Student test were applied for the comparison of the difference of blood lead levels in different groups of children. Since the blood lead levels were fitted in a log normal distribution, Geometric mean (GM) was used in the statistical analyses and p less than 0.05 is considered as significant. Principal component analysis (PCA) was applied to assess the association between blood level, urinary lead level and ALAU.
It was observed that half of children were female and half were male. The mean blood lead level of male children is almost similar (MG = 93.40 μg/L) to that of female children (MG = 93.67 μg/L).The average age of children in this study was 8.9 years (range: 0-17.0 years).
It was observed that 10% of children between 0 and 6-years-old, and 77% between 7 and 8-years-old had blood lead level of 136.93 μg/L and 108.45 μg/L respectively, 23% of children between 9 and 10-years-old and 17% between 11 and 12-years-old presented blood lead levels of 80.30 μg/Land 92.34 μg/L respectively. The blood lead levels of 69.90 μg/L and 92.51 μg/L were shown by 13% of children between 13 and 14-years-old and 10% between 15 and 17-years-old. There results indicated that children with 0 to 12-years-old presented an average of blood lead level of 98.52 μg/L compared to children old 13 to 17-years-old with an average of 78.80 μg/L. They also suggested that young children consumed most this toxic metal than their older brother probably due to the weakness of organism of young children.
With regard to the frequency of level of lead impregnation, it was observed that 43.33% of the studied population presented a blood level between 50 and 90 μg/L, 30% and 16.66% had blood lead levels between 100 and 149 μg/L and 150 and 199 μg/L respectively, while 6.66% presented a concentration between 200 and 250 μg/L.
Considering the length of the road with heavy traffic where lived children, it was observed that 10% of children living between 0 and 5 m showed a geometric blood lead level of 65.67 μg/L, 20% and 10% between 6 to 20 m and 21 to 50 m presented a geometric blood lead levels of 69.77 μg/L and 104.17 μg/L respectively, 17% and 43% between 51 to 100 m and beyond 100 m had a geometric blood lead levels of 103.44 μg/L and 108.99 μg/L respectively. Significant difference was observed between there geometric blood lead values compared between them (p < 0.05). The average of geometric blood lead from children living at a distance < 500 m was 85.76 μg/L.
About urinary lead and ALAD of the infant population of the study, we observed that the mean of urinary lead level is about 5.1 ± 4.45 μg/L, 83 percent of children showed a mean of ALAD less than 4 mg/g of creatinin (1.95 ± 1.14) and 17 percent showed a mean high or equal than 4 mg/g of creatinin (4.95 ± 1.07) (Table 1, Table 2, Table 3, Figure 1 and Figure 2).
Table 1: Characteristics of the children blood lead, urinary lead and ALAD levels of participants. View Table 1
Table 2: Childhood prevalence by age group. View Table 2
Table 3: Frequency of blood leads level by distance from house and road with high traffic. View Table 3
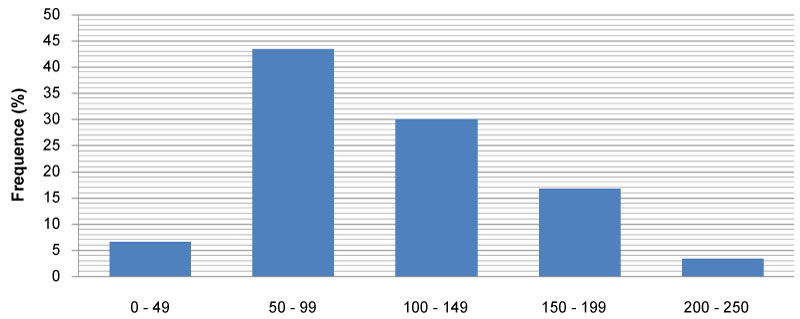 Figure 1: Frequency of lead detection (% samples) in blood samples from the studied population.
View Figure 1
Figure 1: Frequency of lead detection (% samples) in blood samples from the studied population.
View Figure 1
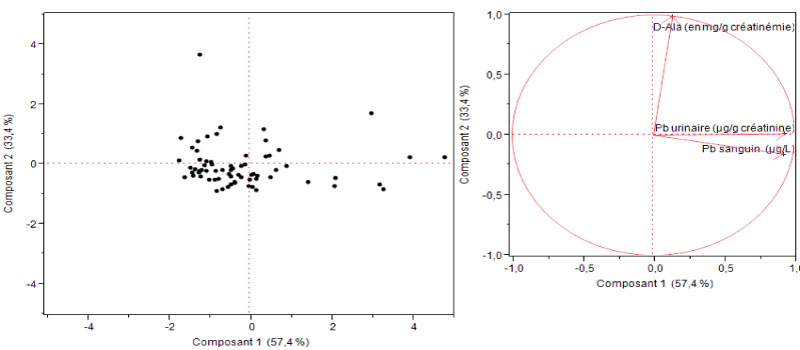 Figure 2: Principal Component analysis of three interests' responses.
View Figure 2
Figure 2: Principal Component analysis of three interests' responses.
View Figure 2
Lead had serious and irreversible consequences, especially in children (damage to the central nervous system, leading to an alteration of higher functions: Learning, memory and behavior) [20,33].
The results of our study showed a mean of blood lead level in children equal to 102.71 ± 45.70 μg/L with values ranging from 38.52 to 219.70 μg/L. The observed average seemed similar in accordance with the average values observed in some developing countries: 116 μg/L between 1998-2000 in Venezuela, 98 μg/L in 2011 in Mexico, 96 ± 29 μg/L in 2001 in Brazil, 94 ± 29 μg/L in 2003 to Uruguay, 93.2 μg/L between 2003-2006 in India and 86 μg/L in 2001 in Indonesia [34-36]. Compared to average values found in high-income countries, we noticed that the average blood lead level of the children in our study (DR Congo) was far superior. There is an average children blood lead level of 10.20 μg/L between 2007-2009 in Canada, 13 ± 20 μg/L between 2007-2008 in Spain, 19 μg/L between 1999-2002 in the US, 18.2 μg/L between 1995-2007 in Sweden, 15.1 μg/L between 2008-2009 in France and 24 μg/L in 2008 in Brazil [35,37].
In addition, 50% of children had mean blood lead levels ≥ 100 μg/L, which was an average of 138.45 ± 36.33 μg/L. This prevalence found is lower than that found by Tuakuila J (63%) [28] that found in Albania (68%) [38], 70% in Nigeria, 78% in Johannersburg and 80% in Pakistan [33]. It seemed similar to that found in China, 54% [39] and Mexico (44%) in 2011 [14]. Finally, it was far below that found in countries where the use of leaded gasoline had been banned. Indeed, many studies showed that the gradual decrease in the use of leaded gasoline was correlated with a decrease in the average level of blood lead [40-43]. There was a prevalence of 2.1% between 2008-2009 in France [37] and 7.4% in Colombia [7].
Currently, there was strong scientific consensus on the harmful effects of lead even at low levels. Numerous studies using psychomotor tests had revealed a decrease in intellectual quotient (IQ) and developmental disorders in children in parallel with the increase in blood lead [3,10,17-20]. Thus, the trend was to reduce the tolerable threshold of blood lead levels in children to < 50 μg/L [21,22]. For example, lead poisoning in children was defined as a blood lead ≥ 50 μg/L. Based on this new trend and referring to the results reported in Table 1, we found that 93.33% of children showed mean blood lead levels ≥ 50 μg/L. This allowed us to advocate early screening and medical monitoring in the population of children from 0 to 6 years.
Our study also showed that children aged 0-12 years had a higher mean blood lead level ((107.52 ± 46.94 μg/L) than adolescents aged 13-17 (86.91 ± 40.45 μg/L). These results are in agreement with those found in the literature [39]. This was because young children spend a lot of time playing outside and a no significant difference was observed, the same as in a study conducted in Colombia [9].
In addition to blood lead, the best biological indicator of lead exposure, we measured urinary lead and urinary ALAD in urine. The results of this study show an average of 3.50 ± 3.02 μg/g creatinine (MG = 2.69 μg/g creatinine) far below the tolerable threshold of < 25 μg/g creatinine for the population not exposed to lead [24]. The average urinary lead level found in children (MA = 5.1 ± 4.45 μg/L or MG = 3.70 μg/g creatinine) is higher than the values found in the literature among adults living in high-income countries: 1.11 μg/g of creatinin in Spain, 1.28 μg/g of creatinin in Japon, 0.45-0.93 μg/g of creatinin in Canada and 0.64-0.72 μg/g of creatinin in others countries [44].
Principal component analysis (PCA) showed that ALAU is not significantly associated with blood lead. This confirms the hypothesis that the ALAU assay is not a good biological indicator of lead exposure because hereditary tyrosinemia, liver diseases and stress, whatever the cause, can also increase ALAU [26,39].