Obesity rates differ between Hispanic and White (non-Hispanic) women in the United States, with higher rates among Hispanic women. Socioeconomic processes contribute to this disparity both at the individual and the environmental level. Understanding these complex relationships requires multilevel analyses within cohorts of women that have a shared environment. In population-based samples of Hispanic and White (non-Hispanic) women from the same neighborhoods, we evaluated within each ethnic group a) The association of individual-level socioeconomic status (SES) with body mass index (BMI); and b) The additional contribution of neighborhood-level measures of SES.
Using population-based multi-stage sampling methods, we oversampled low SES and Hispanic block groups. During household screening, we identified women aged 30 to 50 years. Among White women, we specifically oversampled women with low educational levels. 515 Hispanic and 503 White women completed baseline. Height and weight were measured. Baseline surveys, in Spanish and English, included four measures of SES. Three measures of area-level SES were examined. Analysis of loge BMI on each SES measure used linear mixed models, incorporating design effects.
Among White women, low education, social status, and neighborhood SES were associated with higher BMI (p < 0.001, p < 0.0001, and p < 0.05, respectively), independent of other SES measures. Although the highest grouped category of education, income and subjective social status within the Hispanic cohort had the lowest mean estimated BMI, the point estimates across categories were not monotonic, and had wide confidence intervals. As a result, in contrast to the findings among White women, no statistically significant associations were found between BMI and measures of SES among Hispanic women.
Neighborhood and individual measures of SES operate differently in Hispanic compared with White women. We had assumed the measures we included to be most salient and operate similarly for both groups of women. Rather the salient factors for Hispanic women have yet to be identified. Improved understanding may ultimately inform the design of culturally-relevant multilevel obesity prevention strategies.
Obesity, Socioeconomic status, Body Mass Index, Neighborhood, Education
BMI: Body Mass Index; IQR: Interquartile Range; Loge: Natural Logarithm; SES: Socioeconomic Status; NSES: Neighborhood Level Socioeconomic Status; HS: High School; AA: Associate of Arts; AS: Associate of Science; GED: General Education Diploma
Obesity remains a major public health problem, and preventive interventions to reduce body mass index (BMI) have had mixed results [1-3]. Interventions focused at individual behavioral strategies alone, disregarding the participants' social environment, have not been uniformly successful in the long term. Possible reasons for lack of success may include a failure of interventions to address upstream factors contributing to obesity that relate to both individual socioeconomic status and to the socioeconomic environment in which one lives. Significant excess risk of obesity and its related diseases occur for White (Non-Hispanic) people with lower SES, as reviews published in the past 10 years have identified, especially for women [4-6]. Differences in risk by ethnicity as well as by socioeconomic status deserve additional focused study.
It is a basic tenet of intervention science that understanding individual differences in factors associated with an outcome leads to development and evaluation of tailored interventions through targeting these individual differences. Therefore, understanding the complexities of SES as a mechanism might help identify new intervention targets. The general construct of SES has multiple dimensions, including income, education, occupation and social status and it is not clear which are most closely related to obesity [7].
As countries develop economically, the social value of larger body size changes. The industrial revolution called for increasing the productivity of the workforce by increasing energy intake, and in Britain, for example, the policy of the Food and Agricultural Organization was to increase availability of low-cost energy sources (fats & sugars) [8]. It has long been recognized that succeeding generations of people living in industrialized countries tend to increase in height, but more recently, the genetic potential for increased body size has been associated with weight gain as opposed to height gain [8]. Similar weight for height increases have been documented in population groups migrating to the United States, including Hispanic groups. Studies of first, second and third generation Hispanic residents have shown that at every level of BMI in the first generation, succeeding generations of Hispanics have experienced systematic weight gain [5,9]. This is consistent with the rising prevalence of obesity experienced by each level of income or education reported for the period 1995 to 2009 [5].
The socioeconomic context at the neighborhood level may also be associated with obesity, not just as a proxy for individual-level SES [10], but in its own right [11,12]. Indeed, acculturation may influence which social environment attributes are important to obesity risk as well as how they operate. Studies of socioeconomic context at the neighborhood level typically rely on aggregated census or American Communities Survey data information and calculate a neighborhood SES composite score as a linear combination of income, education, and occupation indicators [13-15]. Poverty, defined as very low SES, can be conceived at both the individual and at the neighborhood level. Poor neighborhoods are often neighborhoods with increased stressors such as neighborhood problems, food swamps, low walkability and poor housing quality. Poor neighborhoods also have inadequate access to neighborhood resources, services and infrastructure such as economic, nutrition, and physical activity opportunities, community engagement and collective efficacy, all of which can improve health status. There is considerable variability in SES between individuals living in the same neighborhood [16]. For the few times that individual dimension measures and area level SES have been studied together in relation to adverse health, modest associations with neighborhood deprivation have been reported after adjustment for individual-level socioeconomic factors [17,18]; these analyses have mostly focused on mortality as an outcome, not obesity.
The National Academy of Medicine (formerly IOM) report on obesity prevention [19] calls for a more targeted approach to reduce obesity, acknowledging disparities in minority populations. In the Pacific Northwest, the Hispanic population is the fastest growing minority population, and substantial numbers of Hispanic individuals reside in the southern part of the Greater Seattle area. Hispanic women in particular have a higher proportion of obesity (45.6% nationwide in 2014) compared to 35.3% in Non-Hispanic Whites [20]. We recognized the potential to study both individual-level and area level socioeconomic factors in relation to obesity risk in two different cohorts of women. Non-Hispanic White and Hispanic people are the two largest racial/ethnic groups in the U.S. The gender and ethnicity gaps in obesity for Hispanic women provide us with a cue to search for socioeconomic differences that could explain the obesity differences and provide a mechanism for future intervention work.
We recruited a socio-economically diverse sample of middle-aged Hispanic and White women living in the same neighborhoods. (Here, and throughout, we refer to Non-Hispanic White women as White women in this paper). The objectives of this cross-sectional analysis of baseline data are to: 1) Evaluate the strength of association of multiple individual-level measures of SES on BMI; 2) Evaluate the additional contribution of neighborhood-level measures of SES on BMI over and above the associations with individual-level SES within each ethnic group separately. Understanding these complex relationships requires multilevel analyses within cohorts of women that have a shared environment.
The Socioeconomic Status and Obesity Study was designed to evaluate the longitudinal association between SES and risk of obesity among Hispanic and White (non-Hispanic) women in southwest Seattle, Washington and to test three specific mediating pathways between SES and obesity. These included: 1) Access to material resources in the neighborhood; 2) The psychosocial context; and 3) The stress process [21,22]. In this paper, we describe the population-based study design and the characteristics of the participants and provide the baseline analyses of the associations between risk of obesity and individual and area level measures of SES. We used population-based multi-stage sampling methods where the first stage involved selecting block-groups within Seattle with a high representation of Hispanics, low education and low income as determined by the 2000 census. These block groups were categorized into thirds of household income and thirds of education attained. All block groups with low income were sampled, as were those with low education but high income. One third of the low education but medium income block groups, and 20% of all remaining block groups were also randomly selected. A list of 143 block groups resulted, forming the sampling frame for the next stage, using procedures adapted from the Los Angeles Family and Neighborhood Survey [23]. We divided each block group into segments of 10-25 geographically clustered households, from which 10-12 segments were chosen at random using probability proportional to size sampling. Higher weights were given to households with Hispanic surnames. This multistage sampling yielded approximately 22,000 household addresses. We augmented the addresses by adding segments containing 3 or more Hispanic surnames sampled from the original 143 block groups, for a new total of 24,500 addresses. Between January 2010 and December 2011, all household addresses were approached by female study interviewers to screen for age-eligible women living there. The study was approved by the University of Washington Institutional Review Board.
Eligible women were healthy, aged 30-50 years, spoke English or Spanish as their preferred language, and not planning to move out-of-area in the next 2 years (to facilitate longitudinal follow-up). For households containing more than one age eligible woman, we selected the respondent with the most recent birthday. We invited all eligible White (non-Hispanic) women who had completed high school or earned a GED® to join the study. Because of expected higher recruitment rates among highly educated white women and with a goal of achieving a spread of educational levels over five categories of education, we under-sampled White (non-Hispanic) women with some college through post-bachelor course or training, with a Bachelor's degree and with a Master's or doctoral or professional degree, using sampling fractions of 25%, 25% and 50% respectively. In relative terms, this is equivalent to "oversampling" women with years of education to less than a bachelor's degree level. We invited all age-eligible Hispanic women. We selected 1040 potential participants at the screening stage, but only 1018 (515 Hispanic, 503 White (non-Hispanic)) were confirmed age-eligible on baseline survey and enrolled in the cohort. Analyses were restricted to women not currently pregnant, with complete information on education, measured height and weight and, for the Hispanic cohort, acculturation (as measured by primary language spoken), yielding an analytic dataset of 487 White (non-Hispanic) women and 479 Hispanic women.
We measured weight and height in each participant's home without shoes and outer layers of clothing using a Seca 869 portable flat scale and Seca 213 portable stadiometer (Seca North America, Hanover, MD). Weight and height were measured to the nearest one-tenth kilogram and centimeter, respectively. BMI was calculated for each person using weight/height squared (kg/m2). Obesity is defined as BMI ≥ 30 kg/m, [24] but we used BMI as a continuous indicator of obesity risk, and its log transformation in analyses. A small number of women had recorded values of measured height or weight that were out of plausible range (n = 5), and for these we used self-reported values to compute BMI.
Income: We asked: "What was the total family income (before taxes) from all sources within your household (including paychecks, social security, retirement income, and public assistance) in the last year?" Fourteen possible responses, including "Don't know", had cutpoints spread between $7,000, and $150,000. In descriptive analyses, we used 5 collapsed income categories (Table 1). The midpoints of categories were used as the income values and modeled as a continuous variable. In estimating association with BMI, a change equivalent to the interquartile range ($55,000 in White (non-Hispanic) women, and $28,500 in Hispanic women) was used.
Table 1: Individual - level study characteristics, by ethnic cohort of enrolled women. View Table 1
Education: We asked: "What is the highest degree or level of school you have completed?" There were 16 possible responses ranging from "no schooling completed" through "doctorate degree (PhD, EdD)". In descriptive analyses, neighboring categories of years of education with low frequencies were combined in each cohort separately. The five categories for White (non-Hispanic) women and six for Hispanic women are shown in Table 1. "Vocational/training or some college or associate degree" was used as the referent category for analyses in each cohort.
Employment status: We asked: "What is your current job status?" Six possible responses were dichotomized in analyses into "Other (not working, disabled, homemaker, raising children, caring of others, student, etc.)" and "Employed (full-time, part-time, self-employed)".
Perceived social status: The Macarthur ladder is a single-item measure of subjective social status that uses a picture of a ten-rung stepladder. Participants mark where they would rank themselves relative to others. In coding, each rung was scored consecutively. Predictive validity has been demonstrated by showing a relationship to health status [25,26].
We chose 2010 census block-group as the level of aggregation for our neighborhood-level measures using the American Communities Survey (2005 to 2009). Census block-group is the smallest geographic area for which most census information is available, generally containing 600 to 3000 persons [27]. We used six census-based variables identified by Diez-Rouz: Household income, housing unit value, income from investments, high school education, college education, and occupation [28]. The normalized scores for each variable in a block group were summed to obtain the composite score NSES6. In addition, we examined two other salient neighborhood variables [29], percent unemployment and percent under the poverty line.
Age was included in all regression models because of its strong association with BMI. In the multivariate models, measures of SES other than that considered the "exposure" measure were included as adjustment variables (income, education, employment status, perceived social status). Acculturation, measured using a single item "What language would you say you speak most of the time?", was included as an additional covariate in all models for Hispanic women.
We contrasted the baseline characteristics of our White and Hispanic women using chi-square tests of categorical demographic and health-related variables. BMI, our primary outcome, had a skewed distribution as is common. We used log-transformed BMI to obtain sample distributions that were approximately Normal. Exploratory analyses suggested that the error distributions were homoscedastic. Linear mixed models allowed estimates of multi-level effects, and we incorporated the design effects of neighborhood clustering via a block-group-level random effect defined by Census 2010 identifiers.
Anti-log transformation of regression coefficient estimates allowed us to present results as mean BMI and associated 95% confidence intervals (CI), under homoscedastic error (30). These back-transformed regression coefficients are interpreted as the relative change of mean BMI associated with a one unit change in the exposure measure. When comparing two subgroup means, the back-transformation of their difference on the logarithmic scale provided an estimate of the ratio of their means.
Separate models were built for the White (non-Hispanic) and Hispanic cohorts because of our a priori assumption that SES variables have different effects on BMI for different ethnic groups. Differences in SES-BMI associations between the cohorts are described but not evaluated statistically. For all models, age was included as a fixed-effect covariate; in the models restricted to the Hispanic cohort an additional fixed-effect adjustment for acculturation, was included to remove the potential differences in obesity risk associated with acculturation. For each cohort, we initially fit four linear mixed regression models on BMI with each individual-level SES measure entered separately to evaluate the simple associations with obesity risk. We then used a common multivariable model that included all four individual SES variables simultaneously, to evaluate the partial association of a given index independent of the other indices. In examining NSES associations, we initially fit three linear mixed regression models on BMI with each NSES measure ((% unemployed, % of persons below 100% Federal Poverty Level), and NSES6 composite score [28]) entered separately. We then used a common multivariable model with all three neighborhood SES variables and all four individual SES variables. Collinearity among SES measures (correlation at least 0.8) was not found. The analyses estimated the association of neighborhood SES over and above individual SES on BMI. Regression analyses used SAS Proc Mixed from SAS software version 9.3 (SAS Institute Inc., Cary, North Carolina).
Table 1 presents baseline characteristics of the enrolled White (non-Hispanic) and Hispanic study cohorts. The BMIs of women in the two cohorts differed in proportion of participants in each weight category with a higher proportion of White (non-Hispanic) women in the lowest BMI category (p < 0.001). Three individual-level SES variables - income, education, and employment status - differed between the two cohorts as well, with a higher proportion of Hispanic women reporting lower SES and non-employed categories (p < 0.001). Subjective social status also differed between the two cohorts, with larger proportions of Hispanic women reporting lower social status (p < 0.001). More Hispanic women reported poorer general health, compared to the White (non-Hispanic) sample (p < 0.001). Among census 2010 block groups, NSES variables were associated with the overall neighborhood SES composite score (NSES6, data not shown). All the measures track in the expected direction across the tertiles, including percent unemployed (6.8% in the lowest tertile of composite score to 4.6% in the highest tertile) and percent below 100% Federal Poverty Level (30.1% to 10.4% respectively).
The remaining analyses focused on BMI, and excluded women who were pregnant at baseline or had missing year of birth or acculturation measures. The resulting analytic dataset included 966 women. Table 2 shows estimated BMI from analyses modelling loge (BMI) on individual categorical measure of SES, using random intercepts corresponding to block groups. The Table provides back transformed means and 95% confidence intervals of loge BMI by level of education among white women (over 5 categories) and Hispanic women (over 6 categories), and by category of each other SES variable, adjusting for age and acculturation. Although among Hispanic women, the point estimates across categories are not monotonic and have wide confidence intervals, for both White women and Hispanic women, those in the highest grouped category of education, income and subjective social status had lowest estimated mean BMIs. Figure 1 shows the estimated mean BMI, with associated standard error bars by education category for both white and Hispanic women.
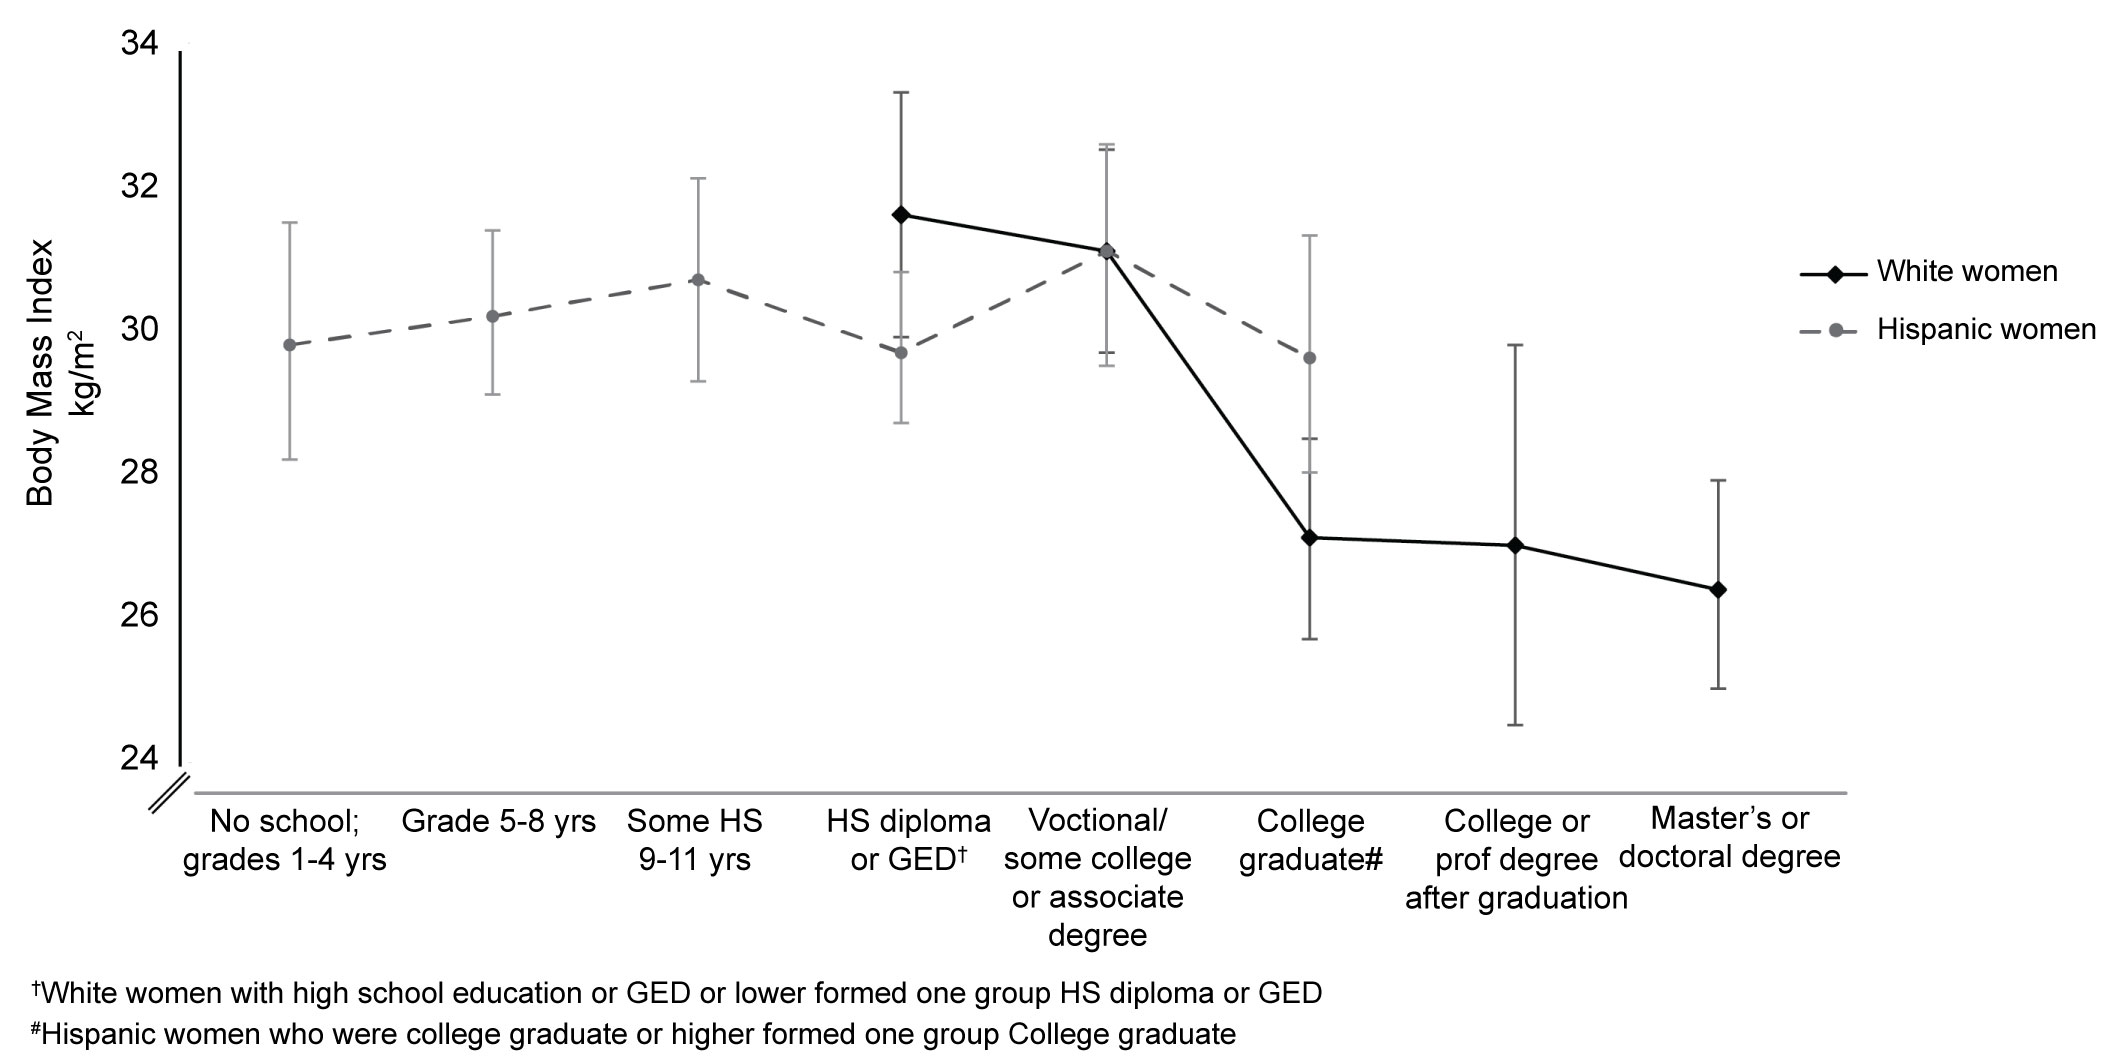 Figure 1: Mean Estimated Body Mass Index by Years of Education for Each Ethnicity at Baseline.
Note: Error bars represent +/- standard error of the estimated BMI for each category.
View Figure 1
Table 2: Mean Estimates of BMI by Measures of SES Within Race/Ethnicity Groups§. View Table 2
The results of the linear mixed models of the associations between BMI and individual level SES measures are shown in Table 3. Among white women, education, income, employment status and subjective social status were significantly associated with BMI, after adjusting for age. The model coefficients can be interpreted as follows: the ratio of mean BMI for an individual with a Bachelor's degree compared to the referent category (some college or associate degree) was 0.87 (95% CI: 0.82 to 0.93), and for an individual with a master's or doctoral degree was 0.85 (95% CI: 0.79 to 0.91). The relative change in adjusted mean BMI was 1.08 (95% CI: 1.05 to 1.11) for a decrease in income equivalent to the inter-quartile range ($55,000) of total family income. After adjusting for age and all other individual-level SES measures, BMI remained significantly associated with education (P for trend across the categories = 0.004), and with subjective social status, (P for trend = 0.04). In contrast, within the Hispanic cohort, none of the SES measures were found to have a significant association with BMI in the models specified.
Table 3: Estimated Change in BMI per Change in SES Predictor Variable†. View Table 3
Table 4 shows results for the neighborhood level SES measures. All three NSES measures at the census block group level were associated with individual-level BMI in the White (non-Hispanic) cohort only, as shown in the Table. For example, the relative change in age-adjusted mean BMI was 1.10 (95% CI: 1.05 to 1.14) for a decrease of 6 score units (the interquartile range) in NSES6 composite score, and remained significant after adjusting for the four individual-level SES measures (P < 0.05). Neither unemployment nor poverty at the area level were associated with BMI, after adjustment for the individual SES measures. No associations between NSES and BMI were found in the Hispanic cohort (Table 4).
Table 4: Additional contribution of area - level SES, independent of individual - level SES measures†. View Table 4
We identified individual-level measures of SES that are most strongly associated with BMI among two cohorts of middle-aged women in southwest Seattle, and further identified neighborhood-level measures of SES that are associated with BMI over and above the associations with SES at the individual level. Within the White (non-Hispanic) cohort, every index of SES that we studied was inversely associated with BMI. On the other hand, not all measures of SES were independently associated with BMI within this cohort. Years of education and perceived social status at the individual level, as well as one area level index (the NSES6 composite score) had persistent inverse associations with BMI even after accounting for the variation in the remaining indices. This finding of independent contribution of years of education, after adjusting for other SES indices can be interpreted as follows: for a set level of income and employment and a given level of social status, variations in years of education are associated with corresponding variations in BMI within the White cohort.
Other studies in Western countries [26,30-32] have shown consistent inverse gradients of percent obese with increasing income and education levels each year between 1995 and 2009 [5]. Similar results were reported using NHANES data from 1971 to 2000 [6]. As has been pointed out, SES is a multidimensional construct that includes rank and prestige, and although correlated, each element represents distinct socioeconomic information [7]. This study adds to the literature by confirming which elements of SES are independently associated with BMI.
In contrast, in the Hispanic cohort, none of the individual-level indices, even education in the categories that were grouped specific to the Hispanic women, nor any area level index, were linearly associated with BMI after adjusting for other indices. The findings within the Hispanic cohort suggest the possibility of opposing or moderating influences (e.g. acculturation differences) that cancel each other out, as has been suggested in relation to the so-called Hispanic paradox [33]. That is, Latino populations in the United States have reported or have been found to be in better health than non-Latino populations despite their lower average income and education.
The different countries of origin (USA and Mexico) for the majority of women in the two cohorts are in different quartiles of the so-called human development index [34]. The human development index is a summary measure of average achievement in three key dimensions of human development: life expectancy, education and standard of living. A review of 333 published studies from different parts of the world, divided the countries according to tier of human development index [4]. Among studies of women in the high tier countries, about two-thirds showed an inverse association between SES and body size, while more than 90% studies in the low tier countries found a positive association between SES and body size [4]. Similar differences can be detected in countries that are undergoing periods of rapid economic development. In Brazil in 1989, obesity was common among people with high SES, but ten years later, it was more common in people with low SES, suggesting the shape of the SES-obesity relationship was reversed with economic development [8].
Again, the possibility of underlying opposing SES gradients within our Hispanic sample (e.g. an inverse gradient within highly acculturated women combined with a positive gradient within less acculturated women) might explain why the overall association is null. Unfortunately, small numbers preclude evaluating this possibility (effect modification of acculturation within ethnicity) within this study. Theoretically, the underlying factors contributing to either possible gradient may include the cultural perceptions around ideal weight or body size, the healthy immigrant effect [35,36], and different motivations influencing more acculturated women of high educational level to make healthy eating and physical activity choices. SES gradients of health have been reported to be flattened in different ethnic populations, including Hispanic, Asian and African American groups [37]. Future research will need to monitor degrees of westernization of obesogenic behaviors and possible changes in the SES-obesity association within different cohorts of Hispanic women as acculturation changes are made.
Determining causal directions from our findings is difficult because of the cross-sectional nature of the baseline data. For example, social causation of SES influencing health may be responsible for the associations found, but alternatively health status, through social drift or selection, may have contributed to socioeconomic status. Further, the Hispanic cohort in this study included a smaller proportion of Hispanic women born in the US than found elsewhere in the U.S., so, as stated above our study may be underpowered to disentangle the posited acculturation modifying associations on the SES-BMI relationship.
Strengths of our study include the geographically-based sampling frame that was identical for both Hispanic and White women, the appropriate use of multilevel analyses in evaluating the associations with neighborhood-level indices, and the over-representation (to improve precision of estimated associations with BMI) of low SES at both the individual and the neighborhood levels.
In conclusion, shared common SES-based individual and neighborhood features appear to have very different associations with BMI in different ethnic groups. We identified individual- and area-level measures of SES that are most strongly associated with BMI among White (non-Hispanic) middle aged women in southwest Seattle, namely education category (individual-level) and composite score of NSES (neighborhood-level). The flattened associations between any of the SES measures and BMI among Hispanic middle-aged women are consistent with other studies of Hispanic groups. The identified SES measures will be used in analyses of our longitudinal data in White women exploring potential mediators of this ethnic and socioeconomic disparity in obesity. Nonetheless, we do not have the appropriate measures to explain the complex socioeconomic processes at the individual and the environmental level contributing to obesity in Hispanic women. Improved understanding of contextual, psychosocial, and physiological mediators of SES and obesity within each ethnic group may help explain the differences between White and Hispanic women.
We gratefully acknowledge the contributions of the women who participated in this study. Especial thanks goes to Alan Kunayuki for his assistance with the statistical analyses.
None.
The work was supported in part by the National Institute for Diabetes, Digestive, and Kidney Diseases (R01 DK079042).