There is a remarkable variety of human facial appearances, almost exclusively the result of genetic differences, as exemplified by the striking resemblance of identical twins. Despite intensive research on the genetics of craniofacial morphology using animal models and human craniofacial syndromes, the genetic variation that underpins normal human facial appearance is still largely elusive.
As a part of efforts on detecting genomic variants affecting normal craniofacial appearance, we have implemented a targeted candidate gene approach by selecting 1,319 single nucleotide polymorphisms (SNPs) in over 170 candidate genes and intergenic regions. This list has been further expanded with additional 4,732 tag polymorphisms, representing extended haplotype. All the markers were genotyped in 587 DNA samples using a massively parallel sequencing approach. We used 3-dimentional (3D) facial scans and direct cranial measurements to calculate 104 craniofacial anthropometric distances, which were analysed for associations with 2,332 polymorphisms.
An application of a Bonferroni - corrected genome - wide significance threshold produced associations between six SNPs and five craniofacial traits. Specifically, significant associations of nasal width with rs8035124 (15q26.1), cephalic index with rs16830498 (2q23.3), nasal index with rs37369 (5q13.2), transverse nasal prominence angle with rs59037879 (10p11.23) and rs10512572 (17q24.3), and a composite trait represented by a principal component with rs37369 (5p13.2) and rs390345 (14q31.3) were observed.
Due to over-conservative nature of the Bonferroni correction, we also report the associations that reached the traditional genome-wide p-value threshold (< 5.00E-08) as suggestive. Based on the genome-wide significance threshold, 8 craniofacial phenotypes demonstrated significant and mostly novel associations with 33 intergenic and extragenic SNPs, potentially involved in gene regulation.
This study identified a large number of genetic variants associated with normal craniofacial morphology variation, including confirmation of the two previously reported genes. These results enhance our understanding of the craniofacial genetics affecting normal craniofacial appearance and will be of particular value for clinical diagnostics and forensic molecular phenotyping.
SNPs, Craniofacial, Facial appearance, Embryogenetics, Forensic DNA phenotyping
3D: 3-Dimentional; AIMs: Ancestry Informative Markers; ASW: African Ancestry in Southwest USA; BAM: Binary Alignment Map; BMI: Body Mass Index; CAU: Caucasian; CHB: Han Chinese in Beijing, China; ENGINES: ENtire Genome INterface for Exploring Snps; EVT: Externally Visible Characteristic; DVI: Disaster Victim Identification; FDP: Forensic DNA Phenotyping; GWAS: Genome Wide Association Studies; HWE: Hardy-Weinberg Equilibrium; JPT: Japanese in Tokyo, Japan; LD: Linkage Disequilibrium; lncRNAs: Long Non-coding RNAs; LINE-1: Long Interspersed Nuclear Element 1; MAF: Minor Allele Frequency; ME: Measurement Error; MD: Mean Difference; OMIM: Online Mendelian Inheritance in Man; ORFs: Open Reading Frames; pfSNP: Potentially Functional SNP; PCA: Principal Component Analysis; RGB: Red, Green, Blue (colours); SNP: Single-nucleotide Polymorphism; SNAP: SNP Annotation and Proxy Search; STR: Short Tandem Repeat; TF: Transcription Factor; VCF: Variant Call Format; YRI: Yoruba in Ibadan, Nigeria
The human face is probably the most commonly used descriptor of a person and has an extraordinary role in human evolution, social interactions, clinical applications as well as forensic investigations. The influence of genes on facial appearance can be seen in the striking resemblance of monozygotic twins as well as amongst first degree relatives, indicating high heritability [1,2].
Uncovering the genetic background for regulation of craniofacial morphology is not a trivial task. Human craniofacial development is a complex multistep process, involving numerous signalling cascades of factors that control neural crest development, followed by a number of epithelial-mesenchymal interactions that control outgrowth, patterning and skeletal differentiation [2]. The mechanisms involved in this process include various gene expression and protein translation patterns, which regulate cell migration, positioning and selective apoptosis, subsequently leading to development of specific facial prominences. These events are precisely timed and are under hormonal and metabolic control. Most facial features of the human embryo are recognizable from as early as 6 weeks post conception, developing rapidly in utero and continuing to develop during childhood and adolescence [3,4]. Development of the face and brain are interconnected and occur at the same time as limb formation. Facial malformations therefore, frequently occur with brain and limb abnormalities and vice versa. Consequently, the development of both craniofacial and limb segments is likely to be regulated by the same genes and epistatic interactions. Genetic regulation of craniofacial development involves several key morphogenic factors such as HOX, WNT, BMP, FGF as well as hundreds of other genes and intergenic regulatory regions, incorporating numerous polymorphisms [2].
The loci involved in the craniofacial syndromes may in fact influence the extraordinary variety of human facial appearances, in the same way that genes responsible for albinism have been shown to be involved in normal pigmentation phenotypes [5]. Additionally, non-genetic components such as nutrition, climate and socio-economic environment may also affect human facial morphology via epigenetic regulation of transcription, translation and other cellular mechanics. To date, both the genetic and even more so, the epigenetic regulation of the craniofacial morphology are poorly understood.
The genetic basis of craniofacial morphogenesis has been explored in numerous animal models with multiple loci shown to be involved [2]. The majority of human studies in this field have focused on the genetics of various craniofacial disorders such as craniosynostosis and cleft lip/palate [6,7], which may provide a link to regulation of normal variation of the craniofacial phenotype, as for example observed between cleft-affected offspring and the increase of facial width seen in non-affected parents [8]. These studies have identified several genes with numerous genetic variants that may contribute to normal variation of different facial features, such as cephalic index, bizygomatic distance and nasal area measurements [9-11]. Studies of other congenital disorders involving manifestation of craniofacial abnormalities such as Alagille syndrome (JAG1 and NOTCH2 gene mutations), Down syndrome (chromosome 21 trisomy - multiple genes), Floating-Harbor syndrome (SRCAP gene mutations) and Noonan syndrome (mutations in various genes such as PTPN11 and RAF1) provide additional information on the candidate genes potentially involved in normal craniofacial development [12-17].
One of the main restrictions in performing genome - wide association studies in this field relies in requirement for a large number of DNA samples, accompanied with comprehensive facial phenotypes. In recent years, new digital technologies such as 3-Dimentional laser imaging have been used in numerous anthropometric studies. 3-D laser imaging allows accurate and rapid capture of facial morphology, providing a better alternative to traditional manual measurements of craniofacial distances [18-20]. The high-throughput genotyping technologies and digital methods for capturing facial morphology have been used in a number of recent studies that demonstrated a link between normal facial variation and specific genetic polymorphisms [21-23]. Despite these promising results, our current knowledge of craniofacial genetics is sparse.
This study aims to further define the polymorphisms associated with normal facial variation using a candidate gene approach. The advantage of a candidate gene approach over previous genome wide association studies (GWAS) is that it focuses on genes, which have previously been associated with craniofacial embryogenesis or inherited craniofacial syndromes, rather than screening hundreds of thousands of non-specific markers. This approach aims to increase the chances of finding significant associations between SNPs and visible traits and requires fewer samples for robust association analysis [24,25].
The current research aims to assist in uncovering the genetic basis of normal craniofacial morphology variation and enhance our understanding of craniofacial embryogenetics. These findings could be useful in building statistical models to predict facial appearance from a forensic DNA sample where no suspect has been identified, thereby providing valuable investigative leads. It could also assist in identifying skeletal remains by allowing more accurate facial reconstructions.
A total of 623 unrelated individuals, mostly Bond University (Gold Coast, Australia) students, of Australian ancestry (mainly of European descent) were recruited. The participants provided their written informed consent to participate in this study, which was approved by the Bond University Ethics committee (RO-510). To minimize any age-related influences on facial morphology the samples were largely collected from volunteers aged between 18 and 40. The mean age of the volunteers was 26.6 (SD ± 8.9) years old. Samples from the individuals who had experienced severe facial injury and/or undergone facial surgery (e.g. nose or chin plastics) were ommited.
Each participant donated four buccal swabs (Isohelix, Cell Projects, Kent, UK). 3-Dimentional (3D) facial scans and three direct cranial measurements were obtained as described below. Samples with low DNA quantity or low quality facial scans were eliminated, leaving 587 DNA samples for subsequent DNA sequencing.
Additional information, such as: height, weight, age, sex, self-reported ancestry (based on the four grandparents' ancestry), eye lid (single or double), ear lobe (attached or detached), hair texture (straight, wavy, curly or very curly), freckling (none, light, medium or extensive), moles (none, few or many), as well as iris, skin, and hair pigmentation was collected by a single examiner in order to reduce potential variation. The pigmentation traits were arbitrary assigned according to colour charts [26-28].
Craniofacial scans were obtained using the Vivid 910 3D digitiser (Konica Minolta, Australia) equipped with a medium range lens with a focal length of 14.5 mm. The scanner output images were of 640 × 480 pixels resolution for 3D and RGB data. Two daylight fluorescent sources (3400K/5400K colour temperature) were mounted at approximately 1.2 meters from the subject's head to produce ambient light conditions.
The scanner was mounted approximately one meter from the volunteer's head. Each volunteer remained in an upright seated position and was asked to keep neutral facial expression during the scan. Subjects with long hair pulled their hair behind the ears or were asked to wear a hair net. Glasses and facial jewelery were removed.
Each volunteer was scanned from a distance of approximately one meter from three different angles (front and two sides). The final merged 3D image was produced by semi-automatically aligning the three scans and manually cropping non-overlapping or superfluous data such as the neck area and hair using Polygone® software (Qubic, Australia). The complete coordinates of each merged 3D image were then saved in a 'vivid' file format (vvd) and exported to Geomagic® software (Qubic, Australia) for subsequent image processing.
Based on the anthropometrical literature [29] 32 anthropometrical landmarks were manually identified on each 3D image using the Geomagic software (Figure 1 and Supplemental Table S1). Each landmark was represented by 'x', 'y' and 'z' coordinates as part of the Cartesian coordinate system. The Cartesian coordinates were used for subsequent calculation of 86 Euclidean distances, including 54 linear distances, 10 angular distances and 21 indices (ratios) between the linear distances (Figure 2 and Table 1).
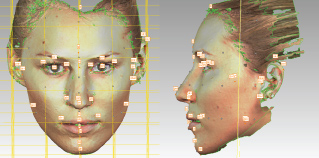 Figure 1: Anatomical position of the 32 manually annotated anthropometric landmarks used for calculation of linear and angular distances and ratios between the linear distances. Some landmarks are not clearly visible due to image orientation.
gn = Gnathion, pg= Pogonion, sl = Sublabiale, li = Labiale Inferius, sto = Stomion, ls = Labiale superius, ch-r = Right Chelion, ch-l = Left Chelion, go-r = Gonion Right, go-l = Left Gonion, sn = Subnasale, prn= Pronasale, al-r = Right Alare; al-l= Left Alare, n = Nasion (in fact this is Sellion), g= Glabella; tr = Tragion, en-l = Left Endocanthion, en-r = Right Endocanthion, ex-r = Right Exocanthion; ex-l = Left Exocanthion, ps-r = Right Palpebrale superius, ps-l = Left Palpebrale superius, pi-r = Right Palpebrale inferius, pi-l = Left Palpebrale inferius, zy-r = Right Zygion Right, zy-l = Left Zygion, pra-r = Right Tragion, pra-l = Left Tragion, sba-l = Left Subalare, sa-l = Left Superaurale, pa-l = Left Postaurale. View Figure 1
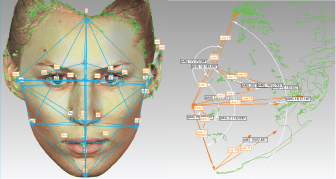 Figure 2: Illustration of linear and angular distances calculated from manually annotated landmark coordinates. View Figure 2
Table 1: Craniofacial anthropometric measurements recorded in the study and used for genetic association analyses. View Table 1
Additionally, three direct cranial measurements: maximum cranial breadth (Euryon - Euryon), maximum cranial length (Gonion - Opisthocranium) and maximum cranial height (Vertex - Gnathion), were collected manually using a digital spreading calliper (Paleo-Tech Concepts, USA). Based on the craniofacial and body height measurements, three craniofacial ratios were calculated: Cephalic index: (eu-eu)/(g-op), Head width - Craniofacial height index: (eu-eu)/(v-gn) and Head - Body height index: (v-gn)/(body height), as summarised in Table 1. The linear and angular facial distances were used to calculate 10 principal components (PCs). Additionally, the details on the eyelid and earlobe morphology (single/double and attached/detached respectively) were recorded. In total, 104 craniofacial traits for each individual were recorded and used for genetic association analyses. All the facial measurements were recorded by a single analyst to reduce potential variability.
Two complementary strategies were used to generate a preliminary list of candidate genes and genetic markers. The first focused on searching the literature and web resources for candidate genes involved either in normal craniofacial variation or in craniofacial malformations in humans and model organisms (Supplemental Table S2).
The search for candidate genes focused not only on specifically defined craniofacial disorders, but also on genetic syndromes with various manifestations of craniofacial malformations, such as Down syndrome, Noonan Syndrome, Floating-Harbor Syndrome and others, as detailed in the Supplemental Table S2. The main resources for locating candidate genes in the animal models were Mouse Genome Informatics [30] and AmiGo databases [31] The main resources for identifying candidate genes in the human genome were OMIM [32] and GeneCards websites [33]. The online search was performed using the keywords such as: "craniofacial", "craniofacial mutants", "craniofacial anomalies", "craniofacial dimorphism" and "facial morphology" (as summarized in the Supplemental Appendix S1).
The second approach initially implemented a broad search for high Fst SNPs, such as ancestry informative markers (AIMs), with the rationale that many genes affecting craniofacial traits would express significantly different allele frequencies across populations, following non-neutral evolutionary pressure. AIMs were selected from a variety of published and online resources [34-43].
The relevant genes obtained by both approaches were subsequently analysed for potential involvement in the craniofacial embryogenesis, limb development and bilateral body symmetry. It should be noted however, that the final candidate gene list was not limited to craniofacial genes and included high Fst SNPs in genes with unknown function as well as markers located in intergenic regions, potentially possessing regulatory functions.
The resulting set of SNPs was further screened for high Fst SNPs (≥ 0.45) in three '1000 genomes' populations (CAU, ASW, CHB) using ENGINES browser [44] as well as potentially functional polymorphisms, such as non-synonymous SNPs [45], markers in transcription factor binding sites [46] and splicing sites [47] using various web resources, as detailed in the Supplemental Appendix S1 and reviewed elsewhere [48]. The candidate markers search resulted in identification of 1,319 SNPs, located in 177 genes and intergenic regions, as discussed in the Results section. In addition to the craniofacial candidate markers, 464 pigmentation and ancestry - informative polymorphisms were selected from the literature (Supplemental Appendix S1).
The chromosomal locations of final candidate markers (n = 1,783) were submitted to the custom Ampliseq primer design pipeline (Life Technologies), according to manufacturer recommendations. Following primer design failure for 881 markers, the marker list was redesigned to include alternative SNPs in high linkage disequilibrium with the original markers, resulting in 1,670 candidate polymorphisms. The final custom Ampliseq panel was manufactured as two separate pools of 849 and 847 primer pairs, with each amplicon length between 125 bp and 225 bp, covering 15.78 kb of the human genome. This panel comprised of 902 originally targeted candidate markers and 4,732 alternative tag markers, as a replacement for candidate SNPs that failed primer design pipeline. Subsequent genomic annotation of the total amplicon sequences for SNPs with MAF ≤ 1% resulted in 8,518 markers as detailed in Supplemental Table S1 (Supplemental Appendix S2).
DNA was purified from buccal swabs using the Isohelix DDK isolation kit (Cell Projects, Kent, UK) according to the manufacturer instructions. DNA samples were quantified using a Real Time quantitative PCR (q-PCR) method using a Bio-Rad CFX96 (Bio-Rad, Gladesville, Australia). This assay amplified a 63bp region of the OCA locus. The primer sequences were 5'-GCTGCAGGAGTCAGAAGGTT-3' (forward primer) and 5'- CATTTGGCGAGCAGAATCC-3' (reverse primer) at a final concentration of 200 mM. All DNA samples were additionally quantified using Qubit 2.0 fluorimeter (Invitrogen) prior to library construction as per manufacturer recommendations.
Multiple DNA libraries were constructed from sets of 32 Ion Xpress™ (Life Technologies) barcoded samples using the Ion AmpliSeq™ library Kit 2.0 (Life Technologies) in conjunction with two custom primer mixes that were pooled according to manufacturer recommendations. Libraries were quantified using the Ion Library Quantitation kit (Life Technologies) and pooled in equal amounts for emulsion PCR, which was performed using the OneTouch™ 2 instrument (Life Technologies) according to manufacturer recommendations. All DNA samples (n = 587) were genotyped by massively parallel sequencing on the Personal Genome Machine (PGM) (Life Technologies) using the Sequencing 200 v2 kit and 316 Ion chips (Life Technologies).
Raw sequencing data were collected and processed on the Torrent Suite Server v3.6.2 using default settings. Alignment and variant calling were performed against the human genome reference (hg19) sequence at low stringency settings. Binary alignment map (BAM) files were generated and exported into Ion Reporter™ (IR) cloud-based software for SNP annotation along with the reference hotspot file. The IR analysis resulted in generation of the individual variant caller files (VCF) with genotype calls for each sample as well as sequencing performance statistics.
To reduce potential bias of the self-reported ancestry, ancestry inferences were obtained by 3,302 markers using STRUCTURE version 2.3.4 with default parameters as per software developer recommendations [49]. SNPs in long-range Linkage Disequilibrium (> 100,000 bp) were excluded from the STRUCTURE run. The ancestry was estimated based on four predefined population clusters: Europeans, East Asians, South Asians and Africans, according to software developer recommendations. Relative allele calls for four predefined HapMap population clusters (CEU, YRI, CHB and JPT) were used as reference populations [50]. The ancestry origin was estimated as a single (unmixed) source where the main ancestry cluster could be affiliated with at least 80% of the total mixed ancestry. The samples with mixed ancestry (> 20% admixture) were assigned to an 'Admixture' cluster.
Association analyses were performed using SNP & Variation Suite v7 (SVS) (Golden Helix, Inc., Bozeman, MT) and replicated using PLINK v1.07 software [51]. Statistical analyses in both software programs were performed using linear regression with quantitative phenotypes, and logistic regressions with binary phenotypes under the assumption of an additive genetic model, while each genotype was numerically encoded as 0, 1 or 2. Population stratification correction, incorporated by EIGENSTRAT program was implemented in the analyses [52,53]. In order to reduce any potential confounding effects, all the craniofacial traits association analyses were performed using sex, BMI and EIGENSTRAT ancestry clusters as covariates. In PLINK, p-values were adjusted using the '-adjust' option. The final reported association results are based on the PLINK statistical analyses with the EIGENSTRAT PCA clusters, BMI and gender as covariates.
Annotation analysis of the significantly associated genes was performed using GeneCards, ENTREZ and UniProtKB web portals [33,54]. The MalaCards web site was used to detect association between the genes and hereditary syndromes [55]. The GeneMania web site was used to identify a functional network among the genes and encoded proteins [56]. Gene ontology web resource was used to find orthologs of human genes in other organisms [31,87]. The MGI database was used to search for the phenotype in relevant craniofacial mouse gene mutants [30]. The dbSNP, 1000 genomes, SNPnexus and Alfred websites were used for SNP annotations [58-61].
The SNP Annotation and Proxy Search (SNAP) web portal was used to find SNPs in linkage disequilibrium (LD) and generate LD plots, based on the CEU population panel from the 1000 genomes data set, within a distance of up to 500 kb and an r2 threshold of 0.8 [62].
The Regulome database and potentially functional database (PFS) searches were implemented to annotate SNPs with known and predicted regulatory elements in the intergenic regions of the H. sapiens genome [47,63].
The online database search for candidate SNPs revealed a list of 150 genes with 310 annotations. In parallel, a search for high Fst markers, resulted in identification of additional 938 targets, for a total of 1,088 genes and intergenic regions (a detailed list of online resources is summarized in the Supplemental Appendix S1).
Manual examination of the candidates list revealed no apparent link with normal craniofacial development or malformations for 592 of these genes and these were therefore excluded. The remaining 496 regions were further screened for non-synonymous and potentially functional SNPs, as well as SNPs with high population differentiation, which resulted in a shortlist of 269 genes and intergenic regions.
Subsequent analysis of these 269 genes/regions for functional annotation, resulted in 177 candidate genes/intergenic regions, possessing 1,319 genetic polymorphisms potentially involved in various stages of human embryonic development, including: embryonic morphogenesis, sensory organ development, tissue development, pattern specification process, tissue morphogenesis, ear development, neural tube morphogenesis, epithelium development, chordate embryonic development and morphogenesis of an epithelium (Supplemental Appendix S1). Notably, the majority of these markers are located in introns and intergenic regions, including 5' and 3' UTRs. This outcome is quite expected, based on the initial assumption that most of the genetic variants influencing phenotypic traits lie in the noncoding part of the human genome, as demonstrated by numerous genome - wide association studies [64]. Such sequence polymorphisms are mostly rare (MAF < 0.1) and have tiny effect size, while thousands of them required to jointly affect complex traits, such as facial morphology or body height [65-68].
In terms of molecular function, AmiGO showed that craniofacial candidate markers might be involved in a range of regulatory activities including: protein dimerization activity, chromatin binding, regulatory region DNA binding, sequence-specific DNA binding RNA polymerase II transcription factor activity, sequence-specific distal enhancer binding activity, heparin binding, RNA polymerase II core promoter proximal region sequence-specific DNA binding transcription factor activity involved in positive regulation of transcription, BMP receptor binding and transmembrane receptor protein serine/threonine kinase binding (Supplemental Appendix S1). The final candidate marker list annotation revealed that almost 99% of the genomic regions (which may cover multiple markers) are associated with one or two genes with 62% of genomic regions located up to 500 kb downstream of a transcription start site (data not shown). This is again an anticipated outcome, given that non-coding variants are likely to reside within cis-regulatory genomic elements, such as enhancers [69,70].
Subsequent analysis of candidate SNPs for mouse phenotype associations confirmed that orthologous candidate markers were previously detected in mouse models displaying abnormal morphology of the skeleton, head, viscerocranium and facial area, as well as specific malformations of the eye, ear, jaw, palate, limbs, digits and tail (data not shown).
Targeted massively parallel sequencing of the 587 samples resulted in 8,518 genetic markers, with the majority of markers (> 5,000) represented by rare polymorphisms with MAF ≤ 1% (data not shown). This outcome was a result of identification of novel and rare markers in individual DNA samples. Three of the DNA samples did not produce high quality genotypes because of poor DNA quality or unsuccessful library and template preparation.
Data quality control steps were performed by removing markers of low genotype quality (GQ > 10) and sequencing depth (DP > 10X). Further filtering of markers using a 2% MAF cut-off resulted in 3,075 markers (Supplemental Appendix S2). Additional filtering based on the HWE threshold of p-value ≥ 0.01 resulted in 2,332 markers. The mean sequencing depth for significantly associated markers was 58 fold (± 48.9 SD).
The association analyses were performed using a linear regression model, incorporating EIGENSTRAT-generated PCAs as well as sex and BMI as covariates. The use of covariates in the statistical analysis aimes to reduce the risk of introducing confounding effects, which can result in false positive associations. While sexual dimorphism in the craniofacial morphology is well-known [71], BMI is likely affect certain craniofacial traits, since the soft facial tissue may change significantly with weight gain or loss. Notably, this potential confounding factor has to date been disregarded in association studies of normal craniofacial morphology. Age was not considered a significant covariate, given that average age of the subjects in this study was 27 (± 8.9 SD). Nevertheless, the potential effect of age as a cofactor was assessed on three craniofacial traits and found not significant (data not shown).
While the majority of current GWA studies rely on a p-value < 5.00E-08 significance threshold, some publications suggest this threshold may be too stringent, especially for complex traits that are regulated by a large number of small effect alleles [72,73]. In contrast to GWAS, candidate gene studies undertake a more focused genetic strategy, concentrating on a relatively limited number of putative markers. As this study analysed a significantly lower number of SNPs than usual GWA-studies, we could use a higher p-value cut-off, since the smaller sample size means the probability of false positive at extremely low p-values is itself lower. Nevertheless, we decided to keep the traditional GWAS p-value significance threshold (< 5.00E - 08) in order to reduce the possibility of detecting false positive results.
In addition, we subsequently applied a more stringent Bonferroni - corrected threshold in order to minimize the chance of detecting spurious associations. Following the association analysis of 104 craniofacial phenotypes with 2,332 genetic markers, the significance threshold based on the Bonferroni correction with a desired α of 0.05 would be 2.06E - 07 (= 0.05/(2,332*104)).
However, it should be emphasized that the Bonferroni correction is widely considered over-conservative, especially in the case of complex phenotypic traits with small individual effects of each allele. Considering that our results confirm the previously published findings, we believe the GWAS p-value threshold is conservative enough to avoid or at least significantly reduce potentially spurious associations. Following this rationale, we report all the variants, which met the unadjusted genome-wide association p-value threshold, as suggestive. We believe these findings are useful for the future studies focusing on genetics of normal craniofacial morphology.
The results of the association analyses of the craniofacial traits are summarized in Table 2 and Supplemental Figures S1-S19. In general, following the application of a stringent Bonferroni-corrected GWAS threshold (adjusted p-value < 1.6E - 07), we observed five craniofacial traits being associated with six genomic markers. Specifically, nasal width with rs8035124 (p-value 1.74E - 07, Beta = 1.366, SE = 0.209), cephalic index with rs16830498 (p-value 8.67E - 08, Beta = 3.005, SE = 0.4518), nasal index with rs37369 (p-value 1.43E - 07, Beta = 4.025, SE = 0.6124), transverse nasal prominence angle with rs59037879 (p-value 6.07E - 09, Beta = 4.765, SE = 0.6685) and rs10512572 (p-value 1.57E - 08, Beta = 1.505, SE = 0.2171), and principal component (EV = 1391.99) with rs37369 (p-value 2.85E - 08, Beta = -0.021, SE = 0.003079) and rs390345 (p-value 8.55E - 08, Beta = -0.0184, SE = 0.002768). The polymorphisms: rs16830498, rs59037879 and rs390345 are intronic variants in CACNB4, ZEB1 and FOXN3 respectively; rs37369 is a missense mutation in the AGXT2 gene and rs8035124 and rs10512572 are intergenic variants in 15q12.2 and 17q21.33 chromosomal locations respectively.
Table 2: Results of genetic association analyses between candidate SNPs and craniofacial traits, including all genomic markers reached the unadjusted p - value threshold of < 5.00E - 08. View Table 2
However, given the over-conservative nature of the Bonferroni correction and also assuming that polygenic traits are likely to be dominated by numerous alleles with small causal effect we also report suggestive associations reaching the unadjusted 5.00E - 08 p-value threshold. In summary, two linear distances (nasal width and nasal tip protrusion), two angular distances (nasolabial angle and transverse nasal prominence angle), three indices (cephalic index, nasal index and nose-face width index) and one principal component revealed significant associations with 33 SNPs in 28 genes and intergenic regions (Table 2).
These factors can be arbitrarily divided into three main categories based on their cellular function: 1) Genes with known roles in the craniofacial morphogenesis and/or mutated in various hereditary syndromes displaying craniofacial abnormalities; 2) Genes or pseudo-genes without known function in the craniofacial morphology regulation or previously uncharacterized genes; and 3) Non-protein coding genes, such as lncRNA class genes. There are also a number of significant variants that are located in the intergenic regions, with or without proximity to open reading frames (ORFs).
The majority of associated markers (n = 21) are located in 17 protein-coding genes and pseudo-genes such as AGXT2, CACNB4, COL11A1, EGFR, EYA1, EYA2, FAM49A, FOXN3, LHX8, LMNA, MYO5A, PAX3, PCDH15, RTTN, SMAD1, XXYLT1 and ZEB1. Five variants are present in RNA-coding (lncRNA) genes, which include AC073218.1, RP11-494M8.4, RP11-408B11.2, RP11-785H20.1 and TEX41. The rest of the markers (n = 6) are found in the intergenic regions, near the following genes and pseudogenes: BMP4, HAS2-AS1, LOC124685, LOC100131241, MRPS36P3, PTCH1, SLC25A5P2, SV2B and TRNAY16P.
Functional annotation of the significantly - associated markers revealed that one variant represent a missense mutation (rs37369), one SNP is a synonymous transversion (rs2290332), while 20 markers are found in intronic sequences and 11 markers located in intergenic regions (Table 1). As stated above, the noncoding genomic location for most of the markers makes sense as they expected to have mild affect on a normal craniofacial phenotype than exonic polymorphisms. This conclusion however, could be biased as a priori, most candidate markers were selected in the non-coding regions (Supplemental appendix S1). As expected, the majority of significantly associated SNPs (n = 27) are found in the regulatory elements of the genome, such as in transcription factor (TF) binding sites, and represent potentially functional SNPs (pfSNPs). These variants may be involved in regulation of gene expression by "fine tuning" of the normal craniofacial phenotype as part of the enhancer/silencer mechanisms, as has been recently suggested [69].
The nasal area measurements, using either "n", "prn", "sn" or "al" landmarks, produced the majority of the total number of significant associations (6 out of 8). These measurements include nasal width (al-al), nasal tip protrusion (sn-prn), nasolabial angle (prn-sn-ls), transverse nasal prominence angle (t_l-prn-t_r), nasal index (al-al/n-sn), and nose face width index (al-al/zy-zy). The apparent overrepresentation of associations with the nasal area is likely a result of the easier allocation and consequent superior reproducibility of the nasal area landmark measurements on 3D images. It may also be a result of a focused selection of candidate genes from the JAX mice database resource, which concentrated on mutants with nasal abnormalities.
The analysis of the direct cranial measurements and their relative indices revealed significant associations for cephalic index (CI) with 9 SNPs (Table 2). The association analysis of the principal components (PC) representing all the craniofacial measurements, revealed one principal component (explaining 73.3% of all the craniofacial phenotypes) that was associated with 14 genetic markers (Table 2).
In contrast to most other craniofacial association studies that focused on a specific homogeneous population group (mostly Europeans), this study included samples from several population groups, which enabled investigation of the genetic factors influencing normal craniofacial morphology in different ethnicities [74]. Self-reported ancestry however, cannot be considered fully reliable, as demonstrated previously [75,76]. In order to address this issue we assessed the self-reported ancestry using STRUCTURE with 186 SNPs removed due to long-range disequilibrium [49]. Following the rationale that the best ancestry estimates are obtained using a large number of random markers [77], we used all the available markers (after MAF ≤ 2% filtering) in STRUCTURE analysis. The STRUCTURE analysis resulted in clusters of 367 Europeans, 51 East Asians, 43 South Asians and 16 Africans, with 107 samples designated as admixed ancestry (Figure 3). Of the samples tested with STRUCTURE, 459 (89%) were assigned the same ancestry cluster (sole or mixed origin) as the self-reported information. Of the remaining 57 individuals, 39 were estimated as 'admixture' (based on up to 20% admixture threshold) and 18 were assigned a single ancestry, different to the self-reported ancestry (Figure 3).
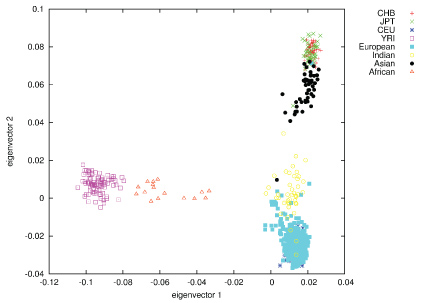 Figure 3: Population structure as represented by plotting genomic PCs 1 and 2, using 270 HapMap individuals as anchor clusters. View Figure 3
The risk of detecting false positive results due to population stratification was carefully assessed and further reduced by applying an EIGENSTRAT correction. Specifically, EIGENSTRAT's smartpca.perl script was used to perform PCA-clustering in comparison to reference populations from HapMap reference clusters. The Q-Q plots of the associated traits confirmed the expected distribution of data after applied correction (Supplemental Figures S1-S8).
Due to a limited number of genotyped markers typed, genomic allele imputations were not performed.
In our attempt to identify genetic markers influencing normal variation in craniofacial traits, we initially incorporated 464 markers previously associated with human pigmentation and ancestry - informative markers, while many of these overlap. These markers were included to validate the statistical methods used for the craniofacial traits association analysis.
The application of the Hardy-Weinberg equilibrium (HWE) threshold resulted in filtering 25% of the total number of SNPs. These markers included almost all the "key" SNPs, previously associated with pigmentation traits, such as rs12913832, rs1129038, rs8039195 and rs16891982. This is not surprising, since population-specific markers are likely not being in HWE 'a priori'. Another explanation for this observation is potential bias from partially uncorrected heterogeneous ancestry, since the ancestry correction algorithm can only minimize, rather than completely remove spurious associations [52]. In fact, the association analyses of the HWE non-filtered genotyping data with pigmentation traits (eye, skin and hair colour), demonstrated highly significant associations, fully concordant with the previously published sources (Supplemental Table S3). It should be noted however, that these results may not necessarily confirm the craniofacial markers associations.
Due to space limitations, the functional annotation of the significantly associated SNPs and their potential role in regulating normal craniofacial phenotype has been provided in a Supplemental Appendix S3.
This study focused on the identification of genetic markers in a set of candidate genes potentilly involved in normal craniofacial development. We report significant associations (Bonferroni adjusted p-value threshold of < 1.6E - 07) between 5 craniofacial traits (nasal width, cephalic index, nasal index, transverse nasal prominence angle and principal component) and 6 SNPs (rs8035124, rs16830498, rs37369, rs59037879, rs10512572 and rs390345) located in 6 genes and intergenic regions (15q26.1, 17q24.3, CACNB4, AGXT2, ZEB1 and FOXN3 respectively). We also report all the significant associations that met the less stringent GWAS threshold (unadjusted p-value < 5.00E - 08) between 8 craniofacial traits and 33 polymorphisms in 28 genes and intergenic regions, as Bonferroni correction is generally considered over-conservative, especially when analysing complex traits such as craniofacial morphology, which is likely to be influenced by a large number of alleles with relatively small individual effect, similar to body height [65-67,78-80]. In fact, most of the significant SNPs (31 out of 33) are noncoding variants, located in the regulatory regions such as: promoters, enhancers and splicing sites, as discussed below. These associations are suggestive and would require additional studies for potential confirmation.
The association of the PAX3 gene and the COL11A1 gene with the transverse nasal prominence angle and cephalic index respectively, confirms previous findings [11,22,23,80]. In fact, an intronic SNP rs11164649 that was associated with cephalic index in the current study, was recently associated with normal-range effects in various craniofacial traits and used for their prediction [80], while the other variants in COL11A1 (rs4908280) and in PAX3 (rs2289266) have not been reported previously. The rest of the significantly - associated markers are also novel and include 20 polymorphisms in protein-coding genes and pseudo-genes, such as AGXT2, CACNB4, EGFR, EYA1, EYA2, FAM49A, FOXN3, LHX8, LMNA, MYO5A, PCDH15, RTTN, SMAD1, TEX41, XXYLT1 and ZEB1. Interestigly, at least 8 of these genes (EYA1, EYA2, FAM49A, FOXN3, LHX8, SMAD1, TEX41, ZEB1) represent transcription factors, affecting numerous signaling cascades during craniofacial embryonic development (discussed below and in more detail in the Supplemental Appendix S3). Additional 7 significantly-associated SNPs are found in intergenic regions adjacent to several loci, such as BMP4, LOC124685, LOC100131241 and PTCH1. Some of these genes and chromosomal segments were previously linked to craniofacial embryogenesis, while others represent novel associations.
Six genetic variants were found in lncRNA genes, which have not been previously linked to craniofacial morphogenesis. These findings may suggest an yet unexplored level of epigenetic regulation affecting craniofacial morphology. lncRNAs represent a recently discovered class of regulatory factors, whose expression is thought to be important for regulation of gene expression through direct competition with transcription factors in promoter regions, as well as by indirectly affecting gene expression via interaction with miRNAs, histone modifying complexes and other cellular factors [81,82]. The role of these ncRNA molecules in the craniofacial development clearly requires additional research.
Another interesting example of potential epigenetic regulation is the gene EYA1, which encodes a histone phosphatase protein and transcriptional coactivator for SIX gene family. This factor regulates transcription during organogenesis of various craniofacial domains, such as branchial arches, eye and ear and known being mutated in Otofaciocervical Syndrome 1 and Branchiootorenal Syndrome 1 (discussed in detail in the Supplemental Appendix S3). Based on ENCODE and Regulome analysis, at least two of the significantly associated SNPs in the intronic region of this gene (rs1481800 and rs73684719) are potentially functional variants, located distal to EYA1 transcription start site. These polymorphisms may essentially cis-regulate its expression, as well as trans-regulate expression of other craniofacial genes via chromatin modification mechanisms. The comprehensive role of epigenetic gene regulation in general, and in the craniofacial embryonic development in particular, is poorly understood. Our results support the importance of epigenetic regulation behind normal craniofacial morphology and require further research.
Notably, there is a limited number of recent studies showing existence of thousands of enhancer sequences, potentially active in the developing craniofacial complex in mice and in humans [69,83]. Given the extremely high complexity of the craniofacial morphology, its developmental regulation and consequent phenotypic variety is likely influenced by both cis and trans epistatic interactions between genetic and epigenetic regulatory factors, which require further investigation.
Even though a relatively large number of phenotypes were studied (92 linear and angular measurements and indices), this may still represent an oversimplification of the complexity of the human face. Despite the importance of the association between specific 3D measurements and SNPs demonstrated in this study, the association of facial shapes, represented by the principal components might better represent facial morphology complexity. However, only one of the 10 principle components analysed in this study, showed significant associations at the GWAS threshold level. While the explanation of this observation is unclear, it is consistent with other similar studies [22,23]. The specific anthropometric measurements on the other hand, produced numerous significant associations, identifying many genes and intergenic regions that appear to play important roles in the development of normal human facial appearance.
We also note the relatively small sample size used in this study, which led to a major limitation: lack of replication of these results in a separate set of samples. However, the confirmation of the two previously associated genes (PAX3 and COL11A1) supports the validity of our findings.
The high complexity of facial anatomy, and the composite nature of genetic regulation that affects its development, requires novel comprehensive approaches of capturing facial morphology. A number of such methods has recently revealed additional genes with a few polymorphisms associated with the normal craniofacial variation range in the Caucasian population [82,80,84]. Further studies may involve the use of similar or even more advanced methods to capture the majority of craniofacial variation and benefit from larger and more diverse population samples.
A recent attempt to predict facial appearance was performed using only 24 SNPs [85]. This approach has promise, although it is largely based on reconstruction of a 'facial composite image' via prediction of ancestry, sex, pigmentation and human perception of faces. While absolutely reasonable, this approach highlights the need for additional association studies looking at specific craniofacial traits. Genetic association studies of a large scope of anthropometric measurements and other facial phenotypes are essential to uncover the dense genetic and epigenetic landscape, affecting normal facial apperance and may subsequently being useful in its prediction.
Additional association studies utilizing large sample sizes and incorporating dense SNPs and DNA methylation panels or even whole genome sequencing approaches, in conjunction with morphologically adequate representation of the craniofacial characteristics would be a valuable adjunct to the promising results obtained in this study. These studies would likely require extensive collaboration between research groups and greatly improve our understanding of the dynamic gene expression influencing craniofacial morphology, which in turn enable better prediction of the visual appearance of a person from a DNA sequence.
We would like to thank the volunteers who participated in this study without whom we could not have performed this research. We would like to thank Olga Kondrashova who helped with the sample collection. We also thank Technical Support Working Group (TSWG) and Pelerman Holdings Pt Ltd. for their generous support of this project.
The participants provided their written informed consent to participate in this study, which was approved by the Bond University Ethics committee (RO-510).
The authors declare that they have no competing interests.
MB designed the study, carried out the molecular genetic studies, carried out the data analysis, participated in the statistical analysis and drafted the manuscript. PB performed the statistical analysis and drafted the manuscript. AvD participated in the design of the study and drafted the manuscript. All authors read and approved the final manuscript.
The data supporting the conclusions of this article are included within the article and its additional files.
The funding for this research was provided by the Technical Support Working Group (Award Number: IS-FB-2946) and Pelerman Holdings Pt Ltd.