The decline in haemoglobin (Hb) levels with advanced age is a widely known event. Nevertheless, it remains unclear whether this is a normal consequence of aging or a feature of age-related comorbidities. The World Health Organisation (WHO) definition of anaemia, although commonly used, was based on small epidemiological data and did not include individuals over 64-years-old. The aim of the present study is to evaluate haemoglobin levels and establish a reference range for a Brazilian population of the oldest old with active aging.
This was a cross-sectional study of community-dwelling independent elderly aged 80 years or older in the city of São Paulo, Brazil. Patients were excluded if they were institutionalised, diagnosed with dementia, Parkinson's disease or current cancer, were undergoing dialysis or had been hospitalised in the last 3 months. Chronic diseases had to be under control. The reference range was calculated excluding patients with transferrin saturation below 16%, serum ferritin levels below 10 μg/L or eGFR < 30 ml/min/1.73 m2. Values were obtained according to recommendations of the International Federation of Clinical Chemistry (IFCC).
Of the 256 subjects included in this study, 182 (71%) were women, and the median age was 85-years-old (80-99). A total of 47 individuals met the exclusion criteria for statistical analysis. The median haemoglobin level was 13.9 g/dL in men and 13.3 g/dL in women. The calculated 0.95 reference range of haemoglobin concentration was 11.2-16.7 g/dL for men and 11.3-15.7 g/dL in women.
A lower threshold of haemoglobin was found for both men and women when compared to levels set by the WHO. Further studies must indicate the normal level of haemoglobin concentration in the elderly in the Brazilian population.
Elderly, Haemoglobin, Anaemia, Reference intervals, Oldest old
The number of elderly individuals is rapidly growing in most countries and clinical particularities of this group have been increasingly described. Studies reported the decline of haemoglobin (Hb) levels in advanced age [1,2]. The prevalence of anaemia is 5% to 18% at the age of 65 years and can reach up to 40% in individuals older than 80 years. Anaemia represents an important global health issue, but it remains unclear whether the decline in haemoglobin levels is merely a consequence of aging or associated with age-related comorbidities [1-3].
In elderly patients, the association of lower haemoglobin (Hb) levels and poor clinical outcomes has been reported, suggesting that anaemia represents an independent risk factor for frailty, morbidity, hospitalisation and mortality [4-9]. However, there is still no consensus on the definition of normal haemoglobin levels in the elderly population, particularly in individuals aged eighty-years-old or older, who are also known as the oldest old [10-13].
Most studies of anaemia in the elderly use the World Health Organisation (WHO) definition, with the same Hb threshold established for young adults, below 12 g/dL for non-pregnant women and below 13 g/dL for men [10]. However, although widely used, the WHO definition of anaemia published in 1968 was based on small epidemiological data and did not include individuals over 64-years-old or consider racial differences.
Race and ethnicity are important determinants of haemoglobin concentration [11,14]. Lower Hb levels have been observed in African descendants when compared to Caucasians, even after exclusion of individuals with thalassemia, iron deficiency, renal failure and sickle cell trait [15-17]. Geographic variations may also influence Hb levels. For example, it was reported that the population of Gambia has lower median Hb levels compared with the population of the United States [18].
The International Federation of Clinical Chemistry (IFCC) recommends that each country should establish reference ranges for its own population, selecting healthy individuals in order to reduce inaccuracies and misdiagnosis [19,20].
In Brazil, a country with a miscegenated population, studies of normal Hb levels in the oldest old have not yet been published.
The aim of the present study was to evaluate Hb levels in a Brazilian population of the oldest old with active aging. This description contributes to the establishment of reference intervals for Hb and cut-offs to define anaemia in this population.
Study procedures were performed in accordance with the principles outlined in the Declaration of Helsinki of 1964 and its subsequent amendments. The study protocol was approved by the local Ethics Committee (Process 1532/09) and all participants gave their written informed consent.
Community-dwelling independent elderly aged 80 years or older from the city of São Paulo, Brazil, were included. The elderly were selected through regional surveys from April 2010 through September 2014. Only clinically stable individuals and those who show independence with regard to activities of daily living were accepted. To establish the normal haemoglobin range, patients with overt diseases had to be excluded. Therefore, patients were excluded if they were institutionalised, diagnosed with dementia, Parkinson's disease or current cancer, were undergoing dialysis or had been hospitalised in the last three months. Chronic diseases were deemed as being under control by using clinical and laboratory evaluation.
At the first medical appointment, samples of venous blood were collected from all participants. The following laboratory tests were performed at the Nephrology Laboratory of the Federal University of São Paulo: complete blood cell counts (CBC), creatinine, urea, cystatin C, ferritin and transferrin saturation.
Glomerular filtration rate (eGFR) was estimated by The Chronic Kidney Disease Epidemiology creatinine-cystatin C (CKD-Epi_cr-cys) equation [21].
Two analyses were performed: Initially all individuals were studied. The second analysis was performed excluding patients with transferrin saturation below 16% and serum ferritin levels below 10 μg/L to eliminate subjects with iron deficiency and anaemia of inflammation; also, subjects with eGFR < 30 ml/min/1.73 m2 were excluded because of a significant association with lower Hb levels. This will be called the selected group. Exclusion criteria were the same as those used by the main studies of Hb levels in the elderly [15,22,23].
The central 0.95 fractile intervals of the distributions of Hb were calculated according to the recommendations of the International Federation of Clinical Chemistry (IFCC) [20].
Partitioning of the distribution of reference values by age was evaluated using a standard deviation test recommended by Harris and Boyd [24]. The Reference Interval (RI) in women was calculated using a non-parametric percentile method for the low and high reference limits as the 2.5% and 97.5% percentiles. In men, due to the smaller sample size, the RI was calculated using the "robust method", as described and recommended by the CLSI Guidelines C28-A3 [25]. For the robust method, the confidence intervals were estimated with the bootstrap method [26]. The analyses were performed using MedCalc Statistical Software version 16.8.4 (MedCalc Software bvba, Ostend, Belgium) and IBM SPSS statistics version 21 (SPSS Inc., Chicago, IL, USA).
The characteristics of the entire population and of the selected group are described in Table 1.
Table 1: Demographic and clinical characteristics of the entire population and the selected group. View Table 1
Values were obtained from all eligible participants (n = 256). Participants with abnormal laboratory results (n = 47) were removed from further analysis. No additional extreme values were detected or discarded as outliers. In summary, a total of 209 subjects (male, n = 60; female, n = 149) were found to be acceptable for calculating the RI for haemoglobin levels in the oldest old. The Hb RI, according to sex, are present in Table 2 (Figure 1and Figure 2).
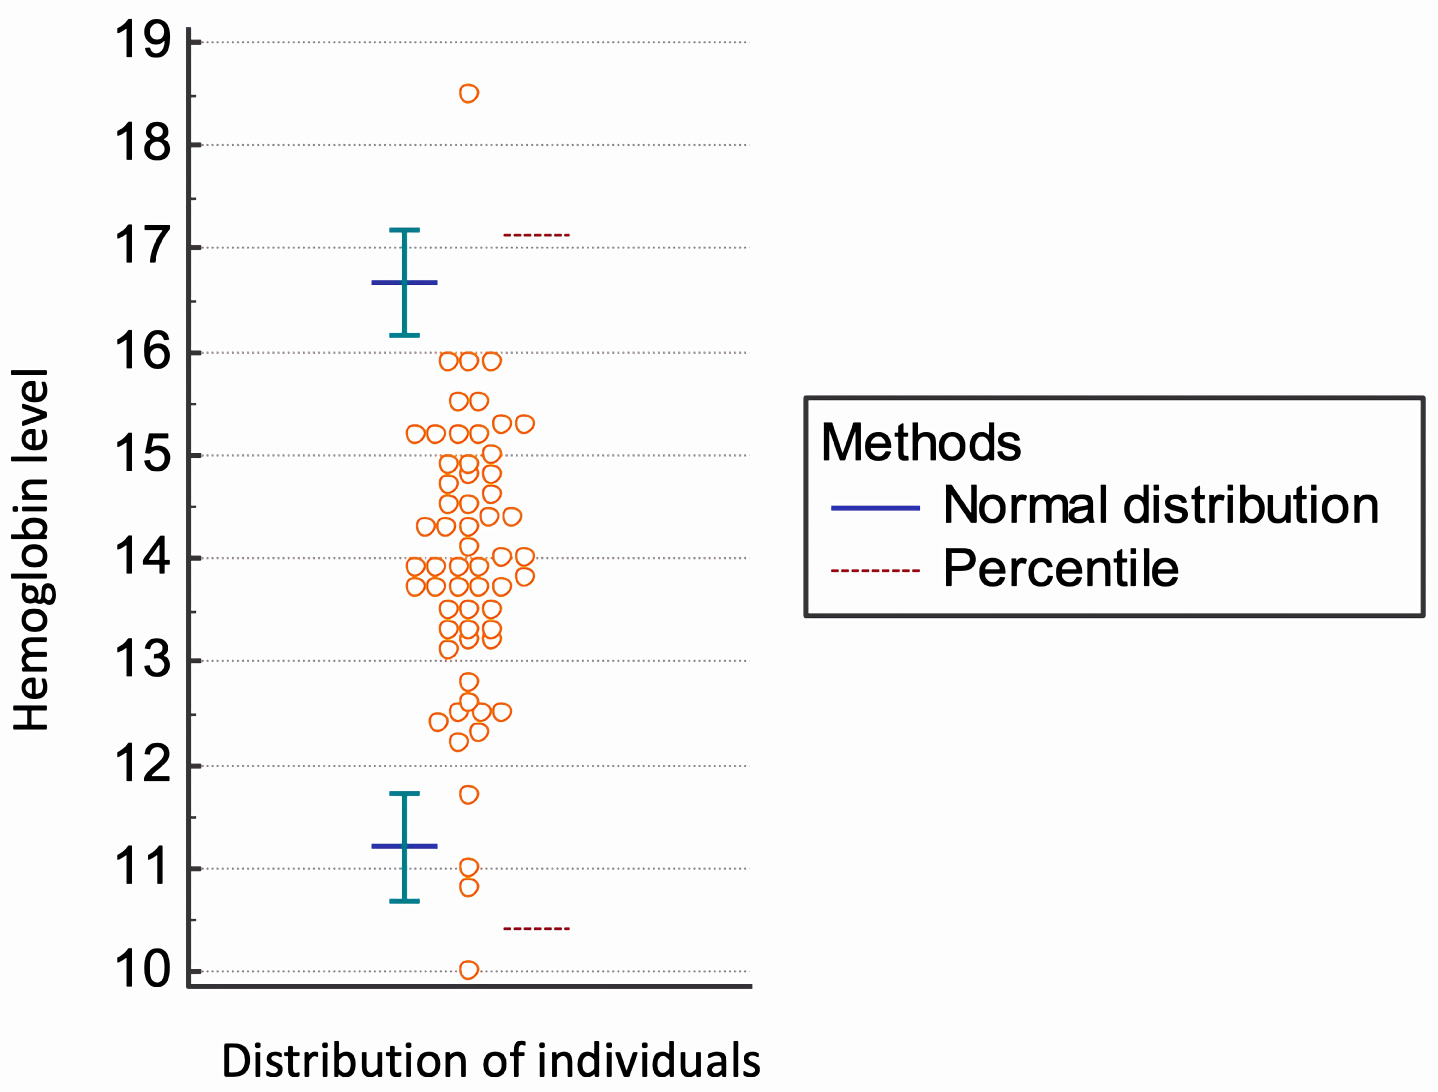 Figure 1: Analysis of Hb reference intervals in oldest old men (n = 60).
View Figure 1
Figure 1: Analysis of Hb reference intervals in oldest old men (n = 60).
View Figure 1
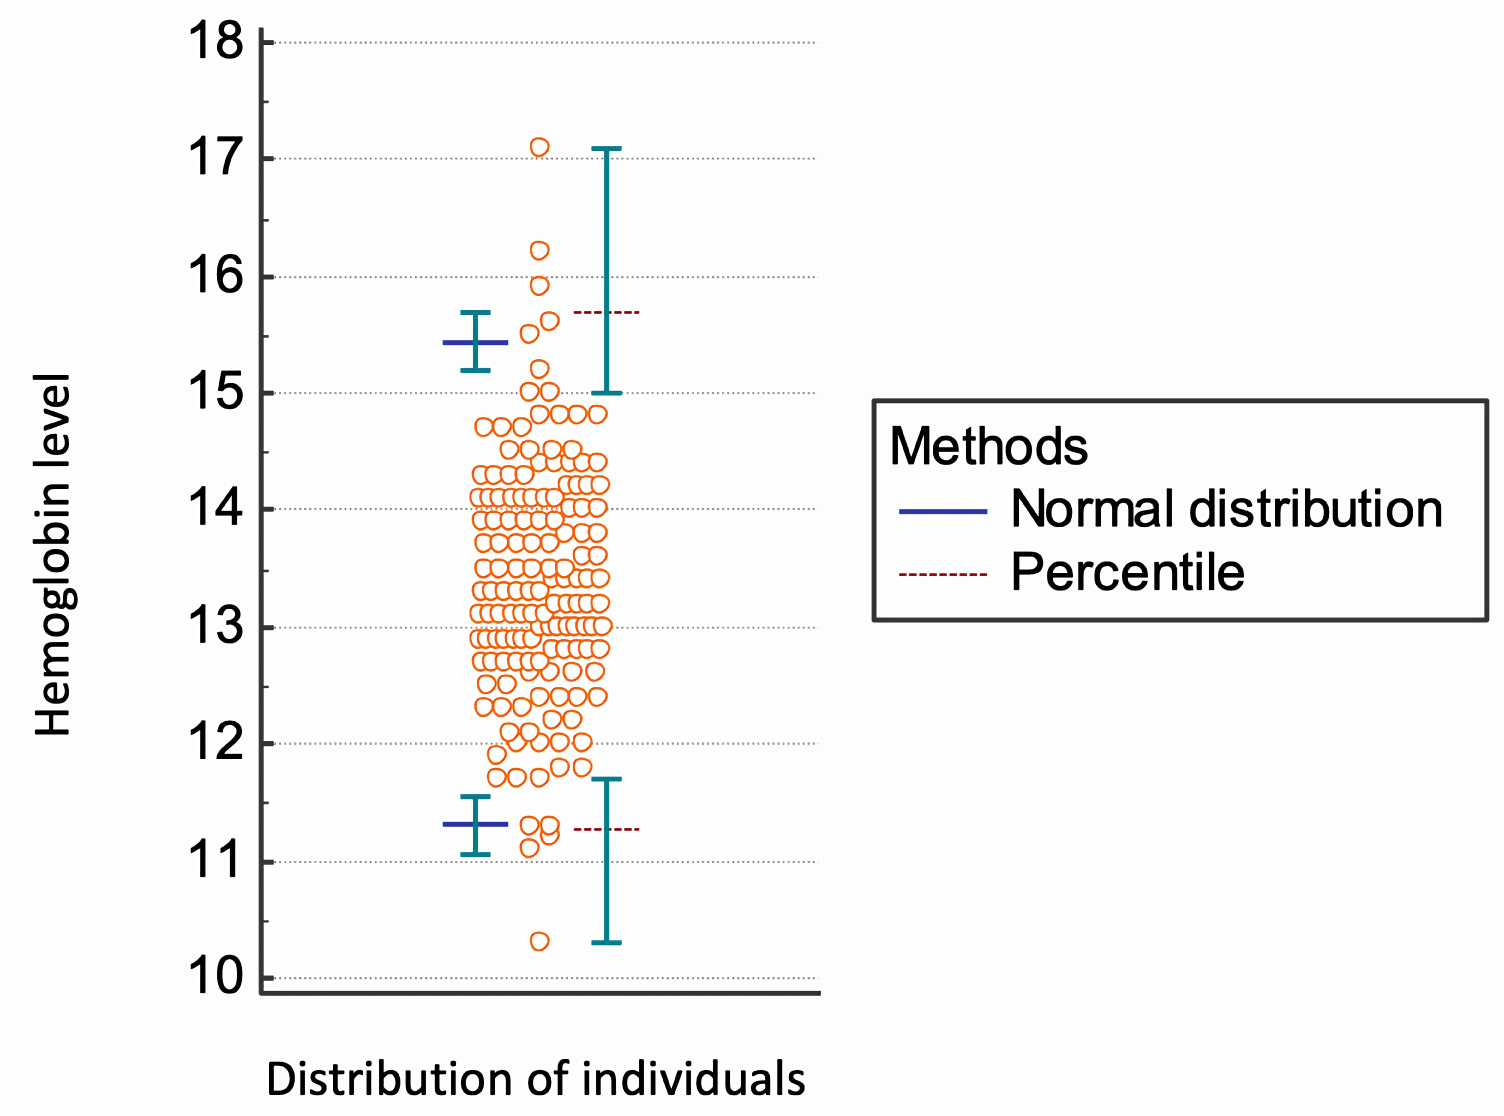 Figure 2: Analysis of Hb reference intervals in women oldest old (n = 149).
View Figure 2
Figure 2: Analysis of Hb reference intervals in women oldest old (n = 149).
View Figure 2
Table 2: Summary of the Hb reference intervals analysis in the entire population and the selected group. View Table 2
The main challenge to define the normal reference range of any test is to select the appropriate group of reference individuals. It has been recommended that a reference interval should be established by selecting a statistically sufficient group (a minimum of 120) of healthy reference subjects. However, health is known to be a relative condition lacking a universal definition [19,27]. We selected a specific group of the oldest old with active aging, defined by compensated comorbidities, functional independence and preserved cognition, no current diagnosis of cancer, Parkinson's disease or dementia, non-institutionalised and non-hospitalised in the last three months. To evaluate normal Hb concentrations, we excluded from statistical analysis patients with transferrin saturation below 16%, serum ferritin level below 10 μg/L or eGFR < 30 ml/min/1.73 m2. This approach is the same as that used by the two main studies of the Hb reference range in the elderly [15,23].
The reference intervals found in this study are lower than those set by the WHO [10]. The WHO criteria, therefore, have been often questioned, as they were based on limited population data, did not include elderly individuals and did not consider racial and ethnic differences.
The lower limits of normal Hb concentrations were also lower than the values found in other studies (Table 3) [15,22]. Milman, et al. [12] determined Hb concentration in 358 "iron replete" elderly individuals aged 80 years who reached successful aging in Denmark and found haemoglobin cut-off levels of 14.0 g/dL for men and 13.1 g/dL for women. Two large studies, The Third US National Health and Nutrition Examination Survey (NHANES III, 1988-1994) [15]. and the Scripps-Kaiser database [22], describe higher threshold levels in Caucasians than those proposed by the WHO, but lower levels for Afro descendants (Table 3).
Table 3: Comparison of proposed definitions of lower limit of normal blood haemoglobin concentration. View Table 3
Therefore, the multi-ethnicity of Brazilian population could be responsible for the results found [19,20,28]. It has been well documented that Afro descendants and Asians have significantly lower Hb levels compared to Caucasians [15]. Beutler and West [17] examined 1,491 African-Americans and 31,000 Caucasians, observing that Hb levels were significantly lower in blacks in all age groups, even after adjusting for the presence of thalassemia and iron deficiency, whereas serum ferritin was higher in these individuals. The National Health and Nutrition Examination Survey (NHANES III) [15] observed that the risk of death increased with lower Hb levels. Based on WHO levels, this risk was increased with levels 0.4 g/dL below the reference range in Caucasians, but only 0.7 g/dL below the reference range in African-descendants.
The large miscegenation of Brazil includes the influence of Indian natives, Portuguese, Africans and groups of European and Japanese immigrants, making this population unique and justifying lower limits for Hb concentrations when compared to other populations.
The main limitations of our study include a single laboratorial evaluation for each individual. The small sample of individuals for the male group should also be highlighted. Ethnic classification was not performed. This classification in Brazilian individuals would be complex and questionable.
The median haemoglobin level was 13.9 g/dL in men and 13.3 g/dL in women. We found lower limits of the haemoglobin inferior reference threshold (Hb 11.2 g/dL in men and 11.3 g/dL in women) than levels set by the WHO. Further studies must be performed to establish normal haemoglobin concentrations in the elderly in Brazil and other countries.
The authors declare that they have no conflicts of interest.
This study was supported by FAPESP (Fundação de Amparo à Pesquisa do Estado de São Paulo; Grant no. 13/12161-9 09/53658-8). CAPES (Coordenação de Aperfeiçoamento de Pessoal de Nível Superior) provided research scholarships.