Recent findings established that underweight (UW) and extremely obese (EO) people were over-represented in the inpatient cohort of one Australian tertiary hospital. This study aimed to describe the characteristics of these patients and identify if differences existed between this subset and the remaining cohort.
Single-centre retrospective case-note review of patients previously identified as being UW or EO during a 2015 prospective point prevalence study, and comparison with those who had "closer-to-normal-weight" body mass index (BMI).
Forty eight patient notes were reviewed (33 UW; 15 EO). The majority of UW patients were admitted under General Medicine with cancer-related illness, whereas EO patients were admitted across specialties, most commonly with a cardiovascular condition. The most frequent past medical history for both groups was a cardiovascular disorder. Compared to patients in all other BMI categories, there was no higher risk of prolonged hospital length of stay in either patient group (p = 0.94). Underweight patients had significantly higher age-adjusted Charlson co-morbidity index scores compared to the EO group (p = 0.01), and although not statistically significant, there was higher frequency of mortality (in-hospital, 28-day and 1-year post-discharge) in those UW (p = 0.54; p = 1; p = 1 respectively). Both groups demonstrated higher rates of hospital re-admission within 28 days of discharge than those reported for this hospital as a whole.
Data presented adds to the limited evidence relating to health outcomes for patients at either end of the BMI spectrum. Decreasing hospital re-admission frequency in these groups might result in considerable cost savings in the future.
Body mass index, Hospital, Inpatient, Length of stay, Readmission, Obesity
Body mass index (BMI) describes a value derived from an individual's weight and height that reflects whether or not the person is in a healthy weight range in relation to their height. Numerous BMI calculators and charts are freely available that reflect both normal and abnormal ranges across various heights. According to both the World Health Organisation [1] and Australian Department of Health BMI guidelines [2], a person may be classified as underweight (< 18.5 kg/m2), normal weight (18.5-24.99 kg/m2), overweight/pre-obese (25-29.99 kg/m2), obese class I and class II (30-39.99 kg/m2) or extremely obese/obese class III (40 kg/m2 or above).
Although there is much data pertaining to the BMI of the general Australian population [3,4], with regular Australian Bureau of Statistics reports around Australian population health statistics, little data exists describing the hospitalised cohort [5,6]. Our group recently established that underweight and extremely obese patients were over-represented during a point prevalence study of patients admitted to an Australian tertiary hospital [7]. It has been identified in the literature that these cohorts are expensive to manage, using more resources during hospital admission compared to patients in the normal body mass index (BMI) category [8].
The primary aim of the present study was to describe and compare the characteristics, hospital course and 1-year mortality of both extreme subsets of the hospitalised cohort (those UW and EO). The secondary aim was to provide a comparison between these groups and the remaining cohort of hospitalised patients in terms of demographics, clinical specialty, length of stay (LOS) and discharge destination.
Two investigators (DD and JH) undertook a single centre retrospective case note review of an opportunistic sample of patients previously identified as having extremely abnormal body mass index during a prospective point prevalence study during 2015 [7]. At the beginning of the review, both investigators extracted data from 2 sets of notes and compared information. A standardized form was then developed to extract remaining data. This form had nine data boxes into which free text was written. These data boxes were: Demographics (age, gender); admission date; admission specialty; indication for admission (presenting complaint); past medical history; medical management summary; additional comments; discharge date and destination; readmission dates (if applicable). Both investigators sat together to obtain data and discussed any ambiguities as they arose.
The main variables of interest pertained to the clinical specialty on admission and indication for hospital admission, past medical history and presence of co-morbidities, LOS and re-admission to hospital or death within 28 days and 1 year of hospital discharge. All admissions were grouped into one of six categories of clinical speciality-Cardiology/Cardiothoracic, General Medicine, General Surgery, Neurology/Neurosurgery, Orthopaedics/Rehabilitation and all other.
Co-morbidity data was reviewed and the Age-adjusted Charlson Comorbidity Index (ACCI) [9] was calculated for each patient, based on their presenting complaint on admission and past medical history. This index was developed in order to classify prognostic comorbidities in longitudinal studies and provides scores ranging from 0-37.
Data from the original point prevalence study of 410 patients was also accessed in order to provide comparison between the "closer-to-normal BMI" group and the UW and EO groups. These data included age, sex, clinical speciality on admission, LOS and discharge destination. The hospital's overall re-admission rate within 28 days was 8.6% [10].
Means and standard deviations are presented for normally distributed continuous variables, whilst medians and ranges are presented for non-normally distributed continuous variables. Counts and percentages are provided for categorical variables. Initially, analysis were conducted considering the three BMI groupings of UW, EO and all others. Specifically, chi-squared tests, or Fisher's exact tests where appropriate, were performed to analyse the relationships between these BMI groupings with sex; a one-way ANOVA was used to determine the relationship between BMI groupings and age; and a Cox proportional hazards regression was used to analyse hospital LOS between BMI groupings, where those who died are censored at their date of death. Furthermore, UW and EO patients were grouped to form an 'Extreme BMI' grouping, and specialty and discharge destination of these patients were compared to that of other non-extreme BMI patients.
Subsequently, data was limited to only the UW and EO BMI groupings and comparisons were made between these. Specifically, an independent sample t-test was used to compare continuous Charlson Comorbidity Indexes between UW and EO patients and chi-squared tests were conducted to analyse in-hospital, 28-day and 1-year mortality rates between UW and EO patients.
P-values are provided, significance was considered at the 5% level and all data were analysed using the R environment for statistical computing [11].
This study was approved by the Hospital Human Research Ethics Committee (study number 2014-102) with a waiver of patient consent granted based on negligible risk.
Data were collected from the notes of 48 patients (33 UW; 15 EO), representing 12% of those reported in the original study (n = 410). Demographic characteristics are shown in Table 1, with no significant differences found between groups for age (p = 0.06) and more females in the UW and EO groups (p = 0.01). Although there was no statistically significant difference in clinical specialty on admission between the UW and EO groups and all other BMI groups (p = 0.49), there was a higher proportion of UW patients admitted through General Medicine (36%) and a lower proportion through Neurology/Neurosurgery (3%) compared to either the EO patient group (20% and 20% respectively) or patients in the remaining hospitalised population (20% and 16% respectively). In these groups, there appeared to be a more equal distribution of patients across each of the six clinical areas. At separation, there was no statistically significant difference between groups in the proportion of patients discharged home (p = 0.33) (Table 1).
Table 1: Patient demographic, admission, mortality and discharge characteristics across Body Mass Index (BMI) categories. View Table 1
On the day of the point prevalence survey, there was more variety in the presenting complaints of the UW group than the EO group; however there was almost the same proportion of patients in each group presenting with some diagnosis directly relating to cancer (Figure 1). In the UW group, confusion and falls rated the highest indication for admission after cancer; in the EO group, cardiovascular indications were most evident.
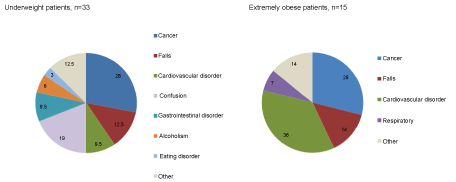 Figure 1: Indication for patient admission, n = 48. View Figure 1
Over half of UW and EO patients had a past medical history of cardiovascular co-morbidity, representing the highest proportion of any co-morbidity across both groups (Figure 2). A history of cancer was present in almost half of the UW group, but only in one fifth of the EO group. In this group, diabetes was more common. There was over twice the proportion of patients with history of gastrointestinal disorders in the UW group compared to the EO group.
 Figure 2: Patient past medical history, n = 48. View Figure 2
Distribution of Age-adjusted Charlson Comorbidity Index (ACCI) is shown in Figure 3. There was a significant difference between UW and EO patients (p = 0.01) with UW patients having higher scores (mean 6, SD 3) than EO patients (mean 4, SD 3).
There was also a higher proportions of in-hospital 28-day and 1-year mortality post-discharge in the underweight group, although these differences were also not statistically significant (p = 0.54; p = 1; p = 1 respectively) (Table 1).
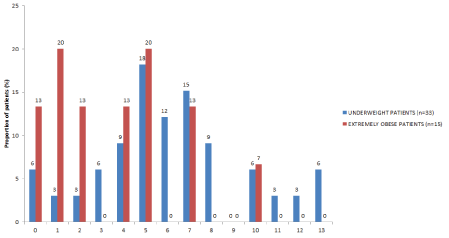 Figure 3: Distribution of Age-adjusted Charlson Comorbidity Index. View Figure 3
Length of stay and hospital re-admission of survivors within 28 days and 1 year post-discharge (Table 1).
Although larger median length of hospital stays were observed for both UW and EO groups when compared to the other BMI categories, this difference was not statistically significant (p = 0.94). More than double the proportions of patients were re-admitted to hospital within 28 days in each of the groups compared to published data for this hospital for 2013/14 [11]. Of those surviving, half of each cohort had a re-admission within 1 year, and a third had more than one re-admission. There are no published hospital data available for comparison. The indication for re-admission was the same as for the initial admission in 82% of UW patients, and 67% of EO patients.
Despite their relatively low prevalence, a recent systematic review concluded that UW and obese patients impose a significant financial burden on the delivery of health care services in the Asia-Pacific region [8]. The current paper offers additional insight into the characteristics of this cohort and differences compared to patients with more ideal BMI.
The presence of significantly more females than males at the extreme ends of the BMI spectrum was an unexpected finding, as women have been reported to have a greater likelihood to understand the importance of a healthy diet [12,13]. That both the UW and EO groups shared a common history of cardiovascular disease may in part explain gender differences. Published literature suggests higher lifetime risk for cardiovascular disease in women than in men at age 40 years [14], with increasing risk post-menopause [15]. Contrary to this, cancer was also a common history and indication for hospital admission in the current study, and global data suggests higher overall rates of cancer in males (age-standardised rate of 300/100,000 people) compared in females (age-standardised rate of 226/100,000 people) in developed countries [16].
Other indications for hospital admission and past medical history that frequently presented in this cohort have been frequently associated with extreme BMI values. For example, obesity has been closely linked to type II diabetes [17], and the notion that depression may have a u-curved association with BMI has been asserted previously [18] and is supported in the current study. Similarly, gastrointestinal disorders have been linked to both the obese [19] and underweight groups [20].
The fact that there was no significant difference seen in LOS in these extreme groups is important, as it has been reported that the management and care of these patients may require more health care expenditure [21] than patients with a more ideal BMI. Similarly, no comparative differences in discharge destination suggest any more of an extended burden of care for secondary services in this group. It may be that a larger sample may have detected differences supported elsewhere in the literature.
Data reflected a higher proportion of inpatient, 28-day and 1-year mortality in the UW cohort, although differences were not statistically significant. As the literature supports an increased relative risk for mortality in this group [22] and in light of the significant difference seen in continuous ACCI scores between groups it may be that low numbers in the present study influenced results, and also support the protective obesity paradox [23-25].
Compared to patients in the remaining BMI categories, patients categorised as UW or OE had more than double the proportion of re-admissions within 28 days of hospital discharge. Of particular interest was the high proportion of these admissions that were deemed to be directly related to the previous admission. In addition, over half of both UW and EO patients were re-admitted within 1-year, with one third being re-admitted on multiple occasions. While further exploration of these data was beyond the scope of the present study, results raise the question of whether a recurring problem could be anticipated and better managed post-initial discharge, thereby preventing costly re-admissions. Future studies investigating the effect of specific interventions to decrease the number of re-admissions may reduce the financial burden associated with the care of this cohort. Possible interventions might include specific targeted pre-discharge education relating to community programmes and services as well as routine domiciliary or outpatient follow-up post-discharge involving a multidisciplinary team. The makeup of this team might include nurses, dieticians, pharmacists and physiotherapists in order to provide ongoing dietary and exercise advice and support.
Data reported represents a relatively small number of patients from a snapshot of a single site on a single day in 2015. There are therefore limitations as to the generalizability of outcomes to other facilities, and greater numbers across multiple sites may have revealed statistical differences not seen in the present data. The quality of the BMI data, whereby all patients had their height and weight physically measured rather than estimated, is a strength of the study.
This paper is the first of its kind to provide descriptive data around the small group of potentially resource-consuming patients who fall at either end of the BMI spectrum. Whilst in-patient care may last for comparatively similar periods of time across the BMI continuum, the frequency of hospital re-admissions of these two extreme cohorts may be a source of considerable resource utilisation that has not previously been identified. It follows that there may be the potential for cost-savings if hospital re-admission rates were reduced in this group. Although the mechanism by which this could be achieved is beyond the scope of the current study, if a recurring problem could be anticipated and better managed pre-initial hospital discharge, re-admission may be prevented. It may be that re-admission with expected disease progression in some of these individuals is unavoidable.
The authors would like to thank the physiotherapy and nursing staff of Sir Charles Gairdner Hospital who participated in data collection for the study.