Previous literature reports suggest that tissue stiffness is a predictor of cancer and metastatic behavior. We have used optical coherence tomography and vibrational analysis (VOCT) to characterize normal skin, scar and a verrucous carcinoma, a squamous cell carcinoma subtype, non-invasively and non-destructively. The results suggest that epidermal thickening and increased keratin production occur in verrucous carcinoma and lead to increases in surface hills and valleys as well as subsequent increases in epidermal stiffness values. Increased stiffness of the epidermis is a result of increased keratin production while the stiffness of the dermis remains similar to that of normal skin, suggesting that dermal changes are not observed in this lesion.
It is concluded that VOCT may ultimately be a useful adjunct to dermoscopy and other clinical tools to identify and characterize lesions as small as 0.2 mm. It is hypothesized that the slow growth potential of verrucous carcinoma may be related to the lack of dermal involvement and that other more invasive skin lesions may be characterized by both epidermal and dermal involvement that would lead to changes in both epidermal and dermal stiffnesses.
Keratinocytes, Keratin, Collagen, Epidermis, Dermis, Verrucous carcinoma, Stiffness, Vibrational optical coherence tomography, Extracellular matrix
OCT: Optical Coherence Tomography; VOCT: Vibrational Optical Coherence Tomography; ECM: Extracellular Matrix; VC: Verrucous Carcinoma; SCC: Squamous Cell Carcinoma
In 2014, an estimated 5 million people were treated for skin cancer with a cost of 8.1 billion dollars [1]. The number of US citizens developing skin cancer in the future and the associated costs of treatment are expected to dramatically increase as the number of US citizens in the 55 to 85-year-old age group increases. The number of people in the US in the 55 to 85-year-old age group is expected to increase to 125 M by 2050 and about 20% of this group will have a skin cancer before the age of 70 [1]. Identification of tissue biomechanical markers, like tissue stiffness, in conjunction with enhanced imaging can be used to non-invasively screen patients for skin cancer. This would facilitate detection and early removal.
Increased tissue stiffness (also termed modulus) has been shown to be a characteristic of potential tumor metastasis [2] and is the result of the abnormal deposition of collagen fibers, the major component of extracellular matrix (ECM). This leads to alterations in the biomechanical properties of skin. The orientation and amount of collagen in skin lesions reflects the tissue metabolism and may be used to characterize tissue lesions [3].
Measured values of the stiffness of tumors and cancer cells have been reported in the literature [4-6]. For most breast and colorectal cancer cell types, the stiffness of neoplastic tumors is reported to increase compared to neighboring normal tissue [4-6], while in contrast, cancer cells, irrespective of the carcinoma, are reported to usually be softer than their normal counterparts [7,8]. The ability to measure the stiffness of cells and extracellular matrices non-invasively in vivo may be a useful parameter to correlate with the histopathology of cancerous lesions.
We have developed a technique to combine optical coherence tomography (OCT) with vibrational analysis to image and analyze the biomechanical properties of tissues non-invasively and non-destructively. The result of this analysis is a "virtual biopsy" of skin [9-15]. These measurements along with in vitro calibration data can be used to interpret mechanical measurements made in vivo [9-15]. By combining tissue biomechanical data with imaging, lesion margins and types can be characterized prior to surgical excision of suspected malignant skin lesions.
Vibrational optical coherence tomography (VOCT) is a new technique developed in the Department of Pathology at Robert Wood Johnson Medical School, Rutgers University. It uses near infra-red light and audible sound to image and measure the resonant frequency of tissues [9-13]. The resonant frequency of a tissue is directly related to the tissue stiffness as described previously [9-13].
A calibration curve of modulus values for control ECMs was constructed by comparing moduli measured using conventional tensile testing and vibrational OCT measurements in vitro as previously described [9-13]. The calibration curve indicated a roughly one-to-one relationship between tensile moduli and vibrational moduli measured on the same samples including decellularized human dermis, pig skin, and bovine cartilage [9-13].
The resonant frequency, fn, is related to the modulus, E, by equation (1)
Where m, L and A are the sample mass, length and cross-sectional area. The resonant frequency was determined after correction for the resonant frequencies exhibited by the speaker, sample holders and any interference due to line fluctuations [9-13].
OCT cross-sectional images were obtained using an OQ Labscope (Lumedica Inc., Durham, NC) and a laboratory spectral-domain optical coherence tomography device (SD-OCT) operating in the scanning mode [9-15].
Transverse sample displacement was generated by placing a speaker next to the skin or under the excised lesion to be studied by spectral-domain optical coherence tomography (SD-OCT), a non-contact, interferometric technique as discussed previously [9-15]. The SD-OCT system uses a fiber-coupled super luminescent diode light source with an 810 to 1325 nm center wavelength and 100 nm bandwidth (full-width at half maximum) as described previously [9-15].
In vivo studies on the mechanical properties of skin and healed scar tissue were conducted by hard wiring a 24 mm × 14 mm rectangular speaker (Digi-Key, Thief River Falls, MN) to a Samsung cell phone. A frequency generating app was downloaded from the Google Play Store onto the cell phone. This app was capable of driving the speaker between 10 and 20,000 Hz. The speaker was applied to the skin using surgical tape and it was used to generate a sinusoidal sound wave that vibrated the skin. During in vivo measurements, no sensation of the light or sound impinging on the skin was felt. The sound intensity was inaudible unless the speaker was placed near the subject's ear to make sure it was energized. In vitro measurements of an excised squamous cell carcinoma were made by placing the lesion on a glass slide and mounting the glass slide on a plastic support under which a speaker was placed to vibrate the tissue as discussed previously [14,15].
The resonant frequency of each sample was initially estimated by measuring the transverse displacement resulting from sinusoidal driving frequencies ranging from 50 Hz to 1000 Hz, in steps of 50 Hz. Once the region where the maximum displacement was identified, smaller steps of 10 Hz were used to more accurately identify the peak frequency and the actual resonant frequency, fn. The moduli of skin and the skin lesion were calculated from measurements of the resonant frequency and tissue thickness made using VOCT and images of the tissues. Moduli were obtained from a calibration curve that relates resonant frequency and thickness to modulus values (Figure 1).
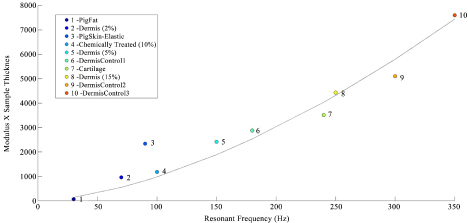 Figure 1: Calibration curve of tissue modulus times thickness versus resonant frequency for different extracellular matrices. This figure was modified from reference [14]. Note the modulus for cellular materials (fat and Staph aureus) is lower (less than 0.1 MPa) than for normal dermal collagen (2 to 3 MPa) and scar tissue (7 MPa). Calibration samples include decellularized human dermis at different values of the external strain, porcine fat, elastic tissue, and bovine cartilage [9-14]. View Figure 1
The original grayscale OCT images of skin, scar and squamous cell carcinoma were pseudo color-coded based on the pixel intensities to provide better images of the tissue components. The enhanced OCT images used darker colored (blue and purple) regions to reflect lower pixel intensities while the lighter (yellowish) regions reflected higher pixel intensity regions.
OCT images of scar tissue are different than that of normal skin; scar tissue appears have a "smoother" surface than normal skin (Figure 2). The epidermis is quite thin both in normal skin and scar tissue and the cellular layers are more visible by color coding the image based on pixel density as shown in Figure 3. The stratum corneum, spinosum and basale, and collagen of the papillary dermis are labelled A, B, and C, respectively in the enhanced OCT image and histological image (Figure 3) A plot of weighted displacement versus frequency for normal skin and scar tissue is shown in Figure 4. Note the resonant frequency of scar tissue is much higher than that of normal skin in vivo.
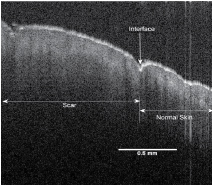 Figure 2: OCT image of normal human skin and scar. The interface between scar tisssue and normal skin is marked by a surface depression and a difference in the height of the hills and valleys seen by OCT. Normal skin has more apparent hills and valleys in the surface layer than scar tissue. The interface between normal and scar tissue is marked in the figure by the arrows. The stratum corneum in both normal skin and healed scar tissue is very thin. Additonal OCT images of normal skin and scar are shown in reference [14] illustrating the the larger number of hills and valleys that are seen in normal skin when compared to scar tissue. View Figure 2
The resonant frequency values obtained from in vivo studies were corrected for differences in tissue thickness using the calibration curve for ECMs shown in Figure 1 to calculate values of the moduli. Plots of weighted displacement for skin and scar show peaks at 90 to 100 Hz (normal skin) and 220 to 230 Hz (scar tissue), respectively and the calculated moduli are about 2.0 to 3.0 MPa (skin) and 7.0 MPa (scar) (Table 1). Note the resonant frequencies of the epidermis of skin and scar tissue are not measureable since the epidermis is too thin to generate a signal.
Table 1: Resonant frequencies and moduli values of normal skin, scar, fat and verrucous carcinoma from references [14,16] and this study. View Table 1
The OCT and enhanced color-coded images of skin and scar are shown in Figure 3 along with a histological section of cadaver skin (Figure 3) taken from Silver, et al. [14]. Note the thin epidermis (A) shown in yellow on both the normal skin and scar (Figure 3) which corresponds to the dark brownish black layer (A) in the cadaver skin (Figure 4). This layer appears to be the stratum corneum. Below the yellow layer in the enhanced OCT image of the normal skin and scar one sees a discontinuous pinkish layer of cellular material (B) that corresponds to the brown layer (B) in the histological section. This layer appears to be a composite of the stratum spinosum and stratum basale. Finally, the dark blue region (C) of the enhanced OCT image is composed largely of the collagen fibers found in the papillary dermis (C) seen in light pink in the histological section.
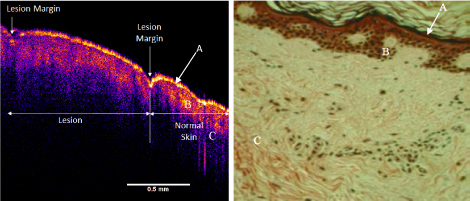 Figure 3: Enhanced OCT image of normal human skin and scar (left) and histology of cadaver skin (right). The OCT image and histological section are shown at approximately the same magnification. The stratum corneum is marked by the letter A in both the OCT image and the histological section, while the letter B marks the straum spinosum and basale and the letter C marks the collagen fibers of the papilary dermis. View Figure 3
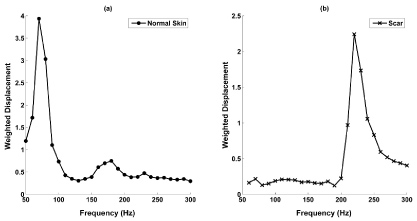 Figure 4: Weighted displacement versus frequency for human skin (left) and scar tissue (right). The resonant frequency of normal skin is much lower than that of neighboring scar tissue while the interface between normal skin and scar tissue is characterized by the resonant frequencies of both tissues (data not shown-see reference [14]). The weighted displacement of a sample was obtained by dividing the displacement observed at a frequency by the displacement measured in the absence of the sample as described previously [9,10]. View Figure 4
A gross image of an excised squamous cell carcinoma is shown in Figure 5. The width of the lesion is about 3 mm. The lesion was removed from an eyelid, placed on a glass slide and studied immediately with VOCT before it was sent for histopathology. The OCT and enhanced VOCT images of the lesion are shown in Figures 6 and Figure 7 along with the histopathology of the lesion. The yellow layer (A) in the enhanced OCT image (Figure 7) corresponds to the squamous cell layer (A) seen in the histopathology image. Note the difference in the image of the lesion seen in the enhanced OCT image compared to the histopathology. The enhanced image of the epidermis shows hill and valleys similar to normal skin and scar as opposed to the histopathology which shows surface projections. The pinkish-red region of the enhanced OCT image (B) appears to correspond to the bluish region in the histopathology section (B) and appears to be the combination of the stratum spinosum and stratum basale. The bluish regions (C) of the enhanced OCT image appear to correspond to the pinkish collagen fibers (C) that are better observed at high magnifications of the histopathology section. The enhanced OCT image suggests that collagen fibers are present in the squamous cell carcinoma papillary dermis. Histopathological analysis resulted in the classification of the lesion as a verrucous carcinoma.
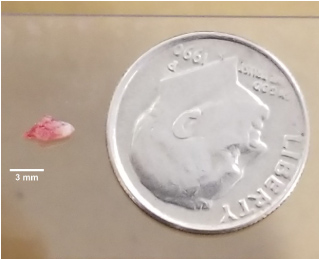 Figure 5: Gross image of verrucous carcinoma showing that the size of the lesion is about 3 mm in length and about 1.5 mm in width. View Figure 5
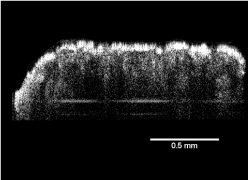 Figure 6: OCT image of verrucous carcinoma. View Figure 6
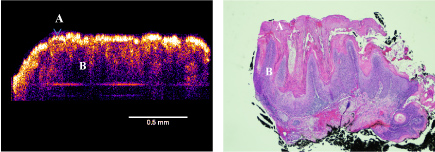 Figure 7: Enhanced image of verrucous carcinoma (left) and histopathology of verrous carcinoma (right). Note the enhanced OCT image of verrucous carcinoma shows hills and valleys similar to those seen in normal skin with increased hill and valley sizes. The lesion appears to contain a thick stratum corneum (A), and an enhanced stratum spinosum and basale (B). View Figure 7
A plot of weighted displacement versus frequency for the lesion is shown in Figure 8. Note the presence of peaks at 50 Hz and 150-170 Hz which correspond to moduli of about 0.695 MPa and 2.81 MPa. The moduli associated with these peaks are listed in Table 1 along with moduli for normal skin, scar tissue and fat. The modulus of the verrucous carcinoma for the collagen component in the ECM appears normal while that for the cellular components appeared higher than one would expect when compared to porcine fat and Staph aureus biofilm (see Table 1).
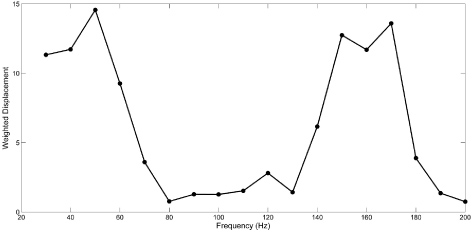 Figure 8: Weighted displacement versus frequency for verrucous carcinoma. The weighted displacement versus frequency plot for verrucous carcinoma has a large peak at about 50 Hz that appears to reflect the thickened epidermal components and a peak at 150-170 Hz that has a modulus similar to that of normal dermis (see Table 1). View Figure 8
While most dermatologists can visually identify many lesion types, lesion depth or margins can't be defined without performing a surgical excision and waiting for frozen sections. The time between surgical excision and the pathologic results may be as great as 60 minutes for a frozen section. During this time patients await verification of complete lesion excision before wound closure. The preoperative clinical assessment of the extent of a tumor in three dimensions would facilitate surgical planning and allow dermatologists to know which tumors are deep enough to require a referral to a Mohs specialist [15]. With improved preoperative imaging and measurement of tissue properties, micrographic surgery as well as surgical removal and identification of other skin lesions could be shortened, more cost-effective and less time-consuming for patients and surgeons [15].
From 1996 until 2013 Mohs surgical procedures to remove skin cancers increased 469% [1]. Basal cell and squamous cell carcinomas affect more than 1 million individuals in the US each year while diagnosis of non-melanoma skin cancer accounts for about 3.5 million new cases in the US each year [1]. The chances of getting skin cancer by 70 years of age is one in five making the population at risk about 25 M people by 2050 [1].
We have developed a non-invasive and non-destructive test, vibrational optical coherence tomography (VOCT), to image and measure the stiffness of skin lesions [9-15]. This technique can be used to measure the stiffness of any substance by vibrating the material and measuring its resonant frequency [9-15]. Since tissue stiffness has been identified as a marker for cancerous lesions and as a predictor of metastatic behavior [2], this technique after further studies may be useful in rapid identification of skin lesions. In addition, since the resonant frequency of the epidermis of normal skin and scar tissue cannot be accurately measured, due to the thinness of the normal epidermis, this technique would be useful in identifying pathological changes to both the epidermis and dermis. Any cellular proliferation of the epidermis or fibrosis of the dermis would lead to an increase the stiffness of each layer, that could be identified using infra-red light and audible sound that is the basis of VOCT.
In this paper we present data on the use of VOCT for performing a virtual biopsy on normal skin, scar and a verrucous carcinoma. Virtual biopsies of normal skin and scar have recently been reported and indicate that using this technique images of the epidermis clearly show details of groups of cells; however, the epidermis is too thin in normal skin and scar to accurately measure the stiffness [9-15]. In this study we report that enhanced OCT images of the epidermis and dermis clearly show differences in the thickness and morphology of normal skin, scar and verrucous carcinoma. While the results presented in this study suggest that the collagen component of the dermis in verrucous carcinoma has normal stiffness, the morphology of the epidermal components is markedly changed in the verrucous carcinoma. Enhanced OCT images show proliferation of squamous and basal cells in the skin as well as elevated stiffness values that appear higher than reported for cellular materials such as fat and Staph aureus biofilm [14,16].
Verrucous carcinoma is a relatively uncommon, locally aggressive lesion, characterized clinically by endo- and exophytic growth. It is a low-grade, slow-growing, well-differentiated SCC with minimal metastatic potential. The epithelium shows characteristic external and internal projective growth, with a granular layer showing marked elevation in keratin production with enlarged keratinocytes [17]. Reviewing the histopathology of the lesion used in this study (Figure 7) suggests that keratin producing cells form projections at the surface of the lesion; however, these projections may be a manifestation of fixation resulting from shrinkage of the tissue by as much as 30% [18]. The enhanced OCT image shows that the surface of the lesion exhibits hills and valleys much like that seen in normal skin except the height of the hills is much more pronounced in the carcinoma. The increased stiffness of the epidermis is a consequence of the excessive keratin production that thickens and stiffens the surface layer. The increased stiffness of the epidermal components of verrucous carcinoma suggests that increased keratin production leading to an increased stiffness may be a marker for this lesion and can be measured using VOCT. Reviewing the enhanced OCT image of the verrucous carcinoma (Figure 7) suggests that lesions as small as 0.2 mm may be seen using VOCT before they can be seen by dermoscopy. The normal collagen stiffness seen in verrucous carcinoma suggests that the slow growth rate of this lesion reflects that lack of involvement of the dermal extracellular matrix.
The relationship between collagen orientation and the mechanical properties of ECMs have been well established in the literature [19]. Oriented collagen matrices exhibit higher moduli and lower strains to failure as compared to orientable collagen networks [3]. The "apparent" increased stiffness of scar tissue is a result of the limited ability of scar tissue to stretch when an external load is applied [19]. Thus, tissue stiffness is a measure of the collagen orientation in skin and skin lesions.
VOCT is a useful imaging technique that allows the clinician to visualize and physically characterize the stiffness of lesions. Since tissue stiffness has been associated with cancerous growth of cells as well as metastatic potential, VOCT is useful in analysis of lesion composition. Cellular contributions to the properties of the lesion occur at resonant frequencies at or below about 60 HZ while collagen contributes to the resonant frequencies above 90 Hz depending on the tissue thickness. In verrucous carcinoma the epidermis is thickened and shows excess keratin production. This keratin production appears to stiffen the epidermis as well as contributes to enlarged hills and valleys that characterize the surface of the lesion based on enhanced OCT images. The slow growth of this lesion may reflect the lack of involvement of the collagen and ECM in the dermis since the stiffness of the dermis does not change in this case of verrucous carcinoma.
These results suggest that verrucous carcinoma and other skin lesions less than 0.2 mm in diameter may be identified and characterized using VOCT before they are able to be seen by dermoscopy. Further studies are underway to compare images and stiffness measurements made on verrucous carcinoma and other skin lesions.
One or more of the authors may receive financial remuneration in the future from the sale of the device used in this research work.