H2O2 is supposed to be part of the laboratory test panel for assessment of oxidative stress. This molecule contributes to oxidative stress by reacting with Fe2+ ions to produce hydroxyl radicals. Anticoagulants, including citrate and EDTA chelate Fe2+, possibly have implications in oxidative stress studies especially when H2O2 is measured.
This brief commentary is on the measurability of H2O2 in citrated and EDTA blood samples.
Laboratory evaluation was performed using blood samples of 30 sheep collected in EDTA and citrate tubes. Samples were centrifuged, and plasma separated. H2O2 was determined using the Biotech H2O2 560 assay protocol on plasma. The ratio of EDTA to iron was also estimated to help interpret levels of H2O2 in EDTA blood.
There was measurable H2O2 reaction in citrate samples, but not in the EDTA blood. Based on brand sterile hematology tubes containing 1.8 mg EDTA per mL blood; approximately 4:1 ratio of EDTA to iron is estimated. Presuming this calculated ratio is a reflection of the true iron levels in the sheep's blood, the test results support the suggestion that ratio of EDTA to iron is greater than 1:1.
Evidence is hereby presented to advance that EDTA anticoagulant is unsuitable for laboratory testing of H2O2 in plasma. Further studies may be needed to ascertain the effects of different anticoagulants on H2O2 in whole blood and haemolysate to see how these can be compared to plasma. This is relevant to establish a standard protocol for integration of H2O2 test for assessment of full oxidative stress panel in clinical practice.
Anticoagulants, Blood samples, Diagnostic lab, Hydrogen peroxide, Oxidative stress
H2O2 contributes to oxidative stress by reacting with Fe2+ ions via the Fenton reaction to produce hydroxyl radicals [1,2]. Blood contains iron either as free component of haemoglobin (Fe2+) or the Fe3+ bound to transferrin. This underlies speculation that the levels of Fe2+, by virtue of their reacting with H2O2, are targets of oxidants and are determinants of oxidative stress. Classical example is the methaemoglobinaemia [3], which is a significant clinical condition caused by oxidative stress reaction [4,5].
Citrate and EDTA are coagulants that chelate cations such as Fe2+; and could possibly affect total oxidant including H2O2 measurements. In an investigation of the rates of reactions of H2O2 with different iron complexes including EDTA-Fe2+ and citrate-Fe2+, it was found that in the absence of NO, oxidation of EDTA-Fe2+ complex by H2O2 to form Fe3+ was nearly twice as fast as the reaction of H2O2 with the citrate-Fe2+ complex. Studies have shown that in the presence of 0.48 µM NO, the reaction rate of H2O2 can be reduced to a near complete stop with the EDTA-Fe2+ complex while oxidation of the citrate-Fe2+ complex may also drastically slow, but not to the same extent as the EDTA-Fe2+ complex [6]. Therefore, it is possible that the minimum level of H2O2 detectable in citrated blood may be undetectable in the EDTA blood; and this has implications in oxidative stress studies, especially when H2O2 is to be the measured clinical parameter. Since both EDTA and citrate chelate iron that otherwise potentially react with H2O2 to cause oxidative stress [1,2], it is pertinent to establish the suitability of anticoagulants for the laboratory blood tubes where H2O2 is measured. Though, it is pertinent to note that EDTA may have paradoxical stimulatory and inhibitory effects on the Fenton reaction.
It is pertinent to since it has been observed that in the presence of Fe2+ and H2O2, thiochrome was oxidized, while the addition of excess EDTA resulted in inhibition of oxidation, possibly due to the chelation of iron with EDTA [7-11]. Akagawa and Suyama reported similar results, where oxidation via the Fenton reaction, in this case, of H2O2 and Cu2+ had inhibition through action of EDTA. EDTA is involved in oxidative reactions e.g. deamination and this is perhaps due to the depression of hydroxyl radical formation and competition between e.g. the protein and EDTA for reaction of hydroxyl radical [1].
Conversely, EDTA along with other Fenton oxidants such as Fe2+ and H2O2 are believed to stimulate oxidation in vivo [2]. Inhibition or stimulation of oxidation via the Fenton reaction perhaps depends on the ratio of EDTA to iron. A ratio of EDTA to iron that is higher than 1:1 inhibits oxidation, while lower ratios stimulate it [11]. Studies by Baron, et al. [2] support this, as the 1:1 of EDTA/iron ratio in their study resulted in stimulation of protein oxidation. Furthermore, they found that EDTA in the presence of small oxidizable molecules decreased the level of protein oxidation, while in the absence of these molecules, EDTA increased oxidation. This reflects the suggestion that EDTA acts as a competitor with proteins for reaction of hydroxyl radical [1]. The numerous nature and quantities of oxidizable molecules in biological samples would therefore have implications on oxidative stress measurements.
The objective of this basic science commentary is to advance the influence of anticoagulants EDTA and citrate on H2O2 levels in blood. This is with a view to contribute to the discourse on establishing protocol for full oxidative stress evaluation in clinical practice.
The study was approved by postgraduate research office of the Faculty of Engineering, Health, Science and the Environment of Charles Darwin University as Undergraduate Training and Research Opportunity Program (UTROP). The ethical concerns were verified by Animal Welfare Officer from the Office of Research and Innovation of the University.
As reported at Australian Institute of Medical Scientists conference [12]. Sheep blood was collected at the Berrima Veterinary Laboratory (Northern Territory) by their standard protocol. Blood samples were collected from 30 sheep; each sheep blood was collected in EDTA and in a citrate anticoagulant. These were transported back to the laboratory in an esky cooler and immediately centrifuged at 2500 g for 5 minutes and plasma separated and kept.
The measurement of H2O2 was determined using the Bioxytech H2O2 560 from Oxis ResearchTM, which were purchased through Sapphire Biosciences Australia. Assay protocol on plasma was based on a simple principle of colorimetric reaction readable on spectrophotometer. Blood samples were collected over a two week period and tested within 24 hours of collection. The cells and plasma were kept at 4 ℃ until required for testing on the same day of sample collection.
The effects of citrate and EDTA anticoagulants on H2O2 levels in blood were investigated. It was hypothesized that EDTA is not suitable anticoagulant for blood sample meant to measure H2O2 since EDTA inhibits H2O2-Fe2+ Fenton reaction.
First, the thirty sheep blood samples were collected into EDTA and citrate tubes. H2O2 was determined by Biotech assay method. Second, EDTA/iron ratio was estimated to aid explains measurement of H2O2 in EDTA-anticoagulated blood by using sheep reference ranges for haemoglobin and serum iron. Taking into consideration the actions of EDTA on oxidation specifically the 1/1 ratio of EDTA to iron [2,10], we determined our own ratio to aid explain measurement of H2O2 in EDTA anticoagulated blood. Since iron level was not measured, the ratio used was approximate and based on the following. Sheep reference ranges for haemoglobin and serum iron are 8-16 g/dL and 166-222 ug/dL, respectively [13].
➢ As an estimate, the study used the means of these ranges, 12 g/dL (0.12 g/mL) for haemoglobin and 194 µg/dL (1.94 µg/mL) for serum iron, to consider the total iron levels in sheep blood.
➢ Though the measurement of H2O2 was in plasma, the effects of EDTA would have been occurring as soon as the whole blood was collected and mixed with the EDTA lining the tube, thus haemoglobin iron levels was included in the ratio.
➢ Assuming that one gram of haemoglobin contains 3.47 mg of iron [14], in 1 mL of blood there is 0.4164 mg iron per mL blood. Serum iron accounts for 1.94 µg (0.00194 mg) of iron in whole blood, however the oxidative action of the Fenton reaction is due to Fe2+ rather than its oxidized form, Fe3+, so this this value was not included.
It was observed that H2O2 reaction color change occurred in the citrate specimen, but not in the EDTA specimen. Figure 1 shows that while blue coloration indicated H2O2 reaction in the citrate samples; all drains from cuvettes of the EDTA specimens appeared yellow signifying lack of reaction in EDTA specimens. Based on the observation of the first week (Figure 1), the second week's batch was performed with intent to confirm reactions while visual comparisons were also done. Figure 2 shows dilution of standard solution - that there is gradient reduction in intensity of blue coloration i.e. bluish indication of H2O2 reaction reduced as the dilution of standard increased towards 1/512 (Figure 2). When equal 1:4 dilutions of the anticoagulated plasma samples were compared to a 1:4 standard dilution, Figure 3 shows blue colour reaction in
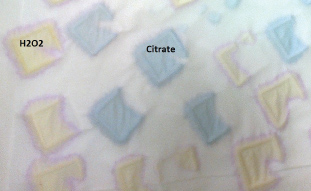 Figure 1: H2O2 reaction colors from drains of cuvettes of citrate and EDTA samples. View Figure 1
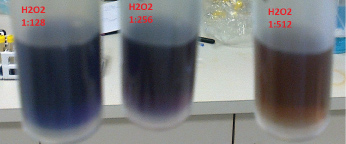 Figure 2: Gradient H2O2 reaction colors standard dilutions. View Figure 2
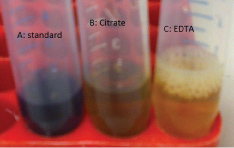 Figure 3: Differential H2O2 reaction colors of citrate vs. EDTA. View Figure 3
➢ Standard solution: Very strong - requiring further dilution for colorimetric reading
➢ Citrate sample: Visible - could be read by the colorimeter
➢ EDTA: Non-existent and undetectable by colorimeter at recommended OD.
Brand sterile hematology tubes contain 1.8 mg EDTA per mL blood, which contains approximately 0.5 mg of iron in men [14] and a little less in sheep [13]. Thus, we have a ratio of EDTA to iron 1.8/0.42 simplified to 4.3/1. Even if we include our serum iron to our total iron, this ratio still comes to 4.3/1. Presuming this calculated ratio is a reflection of the true iron levels in our sheep blood, our results therefore support the suggestion that ratio of EDTA to iron higher than 1/1.
The results revealed that no apparent measurable H2O2 in the EDTA blood sample. This possibly implicates a role of EDTA in H2O2 inhibition. Based on the consideration of the paradoxical actions of EDTA, we decided to determine our own ratio hopefully to aid in explaining our inability to measure H2O2 in EDTA-anticoagulated blood. The EDTA BD Vactutainer® brand sterile hematology tubes contain 1.8 mg EDTA per mL blood. Thus, we have a ratio of EDTA to iron 1.8/0.42 simplified to 4.3/1. Even if we include our serum iron to our total iron, this ratio still comes to approximately 4/1. Presuming this calculated ratio is a reflection of the true iron levels in our sheep blood; our results support the suggestion that when ratio of EDTA to iron is higher than 1/1, causes inhibition of oxidation. Thus, with the assumption that inhibition of oxidation by EDTA is via inhibition of the H2O2-Fe2+ Fenton reaction, this could explain why H2O2 was not detectable in EDTA-anticoagulated sheep blood.
The results revealed that no apparent measurable H2O2 in the EDTA blood sample. This possibly implicates a role of EDTA in H2O2 inhibition. Based on the consideration of the paradoxical actions of EDTA, we decided to determine our own ratio hopefully to aid in explaining our inability to measure H2O2 in EDTA-anticoagulated blood. The EDTA BD Vactutainer® brand sterile hematology tubes contain 1.8 mg EDTA per mL blood. Thus, we have a ratio of EDTA to iron 1.8/0.42 simplified to 4.3/1. Even if we include our serum iron to our total iron, this ratio still comes to approximately 4/1. Presuming this calculated ratio is a reflection of the true iron levels in our sheep blood; our results support the suggestion that when ratio of EDTA to iron is higher than 1/1, causes inhibition of oxidation. Thus, with the assumption that inhibition of oxidation by EDTA is via inhibition of the H2O2-Fe2+ Fenton reaction, this could explain why H2O2 was not detectable in EDTA-anticoagulated sheep blood.
The results revealed that no apparent measurable H2O2 in the EDTA blood sample. This possibly implicates a role of EDTA in H2O2 inhibition. Based on the consideration of the paradoxical actions of EDTA, we decided to determine our own ratio hopefully to aid in explaining our inability to measure H2O2 in EDTA-anticoagulated blood. The EDTA BD Vactutainer® brand sterile hematology tubes contain 1.8 mg EDTA per mL blood. Thus, we have a ratio of EDTA to iron 1.8/0.42 simplified to 4.3/1. Even if we include our serum iron to our total iron, this ratio still comes to approximately 4/1. Presuming this calculated ratio is a reflection of the true iron levels in our sheep blood; our results support the suggestion that when ratio of EDTA to iron is higher than 1/1, causes inhibition of oxidation. Thus, with the assumption that inhibition of oxidation by EDTA is via inhibition of the H2O2-Fe2+ Fenton reaction, this could explain why H2O2 was not detectable in EDTA-anticoagulated sheep blood.
This paper advances that EDTA anticoagulant is unsuitable for testing H2O2 in plasma since level of H2O2 is dependent on EDTA/iron ratio. Further studies are needed on the effects of different anticoagulants on oxidative stress indices measurements and such studies should include the effects on time after blood collection on indices such as H2O2. These studies need to investigate whole blood as well as haemolysate to see how observations compare plasma.
This commentary is based on the conference presentation done in 2013 http://aims.m.asnevents.com.au/schedule/session/1740/abstract/6159. The original work was conceptualized by Uba Nwose and Phillip Bwititi. The former was funded by Charles Darwin University to train Melissa under the aegis of Undergraduate Training and Research Opportunities Program (UTROP).