Background: Uncontrolled BP is a major health problem both in developed and developing countries. Life style, behavioral or genetic factors are some of the risk factors for uncontrolled BP. There are many researches have done on the risk factors for hypertension. However, there is no research done on the association between blood pressure, anthropometric indices and blood group among hypertensive patients in health centers in Addis Ababa, Ethiopia. The aim of this study was therefore, to assess the association between blood pressure, anthropometric indices and blood group among hypertensive patients.
Materials and methods: A facility-based quantitative cross-sectional study was carried out among 235 hypertensive patients in health centers in Addis Ababa, Ethiopia. Structured questionnaires, anthropometric measurements and laboratory analysis were used to collect the data. The data were analyzed by using SPSS version 25 software. The binary and multiple logistic regression analysis were used.
Result: In more than half, 142 (60.4%) of the hypertensive patients, the blood pressure was not controlled. “O” blood type was found to be the most common blood group accounting for 100 (42.6%), followed by “A” 66(28%), “B” 58(24.7%) and “AB” (4.7%). Physical inactivity (AOR = 2.47, 95% CI (1.10, 5.52), P = 0.027), salt intake (AOR = 2.22, 95% CI (1.03, 4.8), P = 0.043), BMI (AOR = 7.79, 95% CI (3.54, 17.13), P = 0.000), high waist circumference (AOR = 3.18, 95% CI (1.19, 8.47), P = 0.021), High Hip (AOR = 5.1, 95% CI (1.2, 21.25), P = 0.025), and “O” blood group (AOR = 2.46, 95% CI (1.0, 5.62), P = 0.026) were significantly associated with uncontrolled blood pressure.
Conclusion: More than half of the hypertensive patients' BP was not controlled. Significant associations were found between BP and salt intake, physical inactivity, BMI, WC, HC and blood group. HC and WC indices should be used routinely as a monitoring method of uncontrolled blood pressure in addition to BMI.
HTN, Anthropometric indices, Blood group, Uncontrolled BP, Health centers
Hypertension is a major public health problem due to its high prevalence and complication all around the globe [1]. It is a leading cardiovascular disease with several, interconnected etiologies. Since the early signs of the illness manifest after significant blood pressure elevation, hypertension cannot be only characterized by a higher blood pressure threshold. The progression of HTN lead to cardiovascular and vascular abnormalities, harming the blood vessels, heart, kidneys, brain, and other organs will eventually cause morbidity and death [2].
Other cardiovascular risk factors that are metabolically related to dyslipidemia, glucose intolerance, diabetes, abdominal obesity, and hyperinsulinemia frequently coexist with hypertension. Additionally, physical inactivity, smoking, and a family history of early cardiovascular disease events are also regarded as risk factors. Hypertension only happens by itself, without any other risk factors, in about 20% of the cases. Two or more additional risk factors are known to be present in at least half of those with hypertension. Therefore the importance of hypertension as a risk factor for human health is increased by the inclusion of other cardiovascular risk factors [3].
Worldwide, there are about a billion people with uncontrolled hypertension. Less than one-third of participants in African studies reach their treatment objectives [4]. Even with effective medical therapy, more than half of hypertension patients in underdeveloped nations, like Ethiopia, had blood pressures above the 140/90 mmHg threshold in most healthcare settings [5,6]. Uncontrolled HTN leads to stroke, heart failure, dementia, coronary heart disease, peripheral vascular disease, renal impairment, retinal hemorrhage, and blindness, placing a significant financial and service load on healthcare systems [7]. The prevalence of uncontrolled hypertension among patients receiving therapy in Ethiopia was found to range from 11.4% at Gondar University Hospital to 59.9% at Tikur Anbessa Hospital and 69.9% at Zewditu Memorial Hospital [4]. Data on prevalence of uncontrolled blood pressure is limited in health centers where most of Ethiopian populations receive medical care [8]. Health personnel's like physicians and laboratory investigations equipment's are limited in health centers.
Obesity which is diagnosed by BMI is the main risk factors associated to the development and progression of arterial hypertension [9]. According to data compiled from multiple research, compared to other types of obesity, central obesity is a larger risk factor for CVDs [10]. This discovery prompted researchers to evaluate patient risk profiles for CVDs using a variety of anthropometric parameters [11]. However, most of the time health professionals use anthropometric indices especially BMI as the only screening method, but in this study one objective was to investigate blood pressure association with all anthropometric indices parameters.
Uncontrolled hypertension is mostly caused by non-adherence to anti-hypertensive therapy and dietary approaches to treat it, high salt intake, alcohol consumption, smoking, physical inactivity, and overweight/obesity [4]. Uncontrolled blood pressure is caused by genetic, dietary, lifestyle, or behavioral factors. The ABO blood group system was developed by the Austrian doctor Karl Landsteiner, who categorized the blood types based on the presence of A and B antigens on the surface of red blood cells [5]. Genetic factor like the ABO antigens might indirectly affect the arterial blood pressure [12].
Many researches were conducted on the relation between ABO blood group and different disease [13]. Knowing the differences in risk and disease severity between different populations could help clinicians to identify individuals that need more close monitoring and include blood group information in prediction models [14]. However there is no much information concerning the relation between blood pressure, blood group and anthropometric indices at health centers in Addis Ababa Ethiopia. This between blood pressure, anthropometric indices and blood groups among hypertensive patients.
The study was conducted in Nifas silk sub-city health centers located in Addis Ababa, Ethiopia. Nefas silk sub city is a district of Addis Ababa located in the Southwestern of the city. The total population of the sub-city is 405,380, of which 53% are females and 47% are males. There are 11 governmental health centers and 27 private clinics [15]. Three health centers include woreda 2, 3 and 5 were the study area.
A health center based cross-sectional study design was applied to this study. It was conducted from September to December 2021.
Source population: All adult hypertensive patients who were on follow upat the selected health center were the source population.
Study population: All hypertensive patients who had follow-up at the health center during the data collection period and met the eligibility criteria.
Inclusion criteria: Hypertensive patients with at least 6 month duration of follow up and who were attending the health center at the time of data collection and willing to participate in the study were included.
Exclusion criteria: Patients with other comorbid illness, secondary HTN, acute or chronic illnesses, recent history of Covid-19 infection and pregnant women were excluded from this study.
The sample size was determined by using single population formula for estimating a single population proportion. The following assumptions were made while calculating the sample size. 95% confidence level and a margin of error (0.05) were used. Using a study done on the blood pressure control practice and determinants among ambulatory hypertensive patients in primary health care facilities, the percentage of obesity in hypertensive patients was 38% and prevalence of uncontrolled BP was 69% so p value which gave the largest sample size was taken [8].
By using this formula:
When we use proportion of patients with obesity (38%), sample size becomes 362 and when we use proportion of patients with uncontrolled BP (69%), sample size becomes 329. So, we used p value which gave the largest sample size that was proportion of hypertensive patient with obesity. Then, adding 10% non-respondent rate 362 × 0.1 = 36.2 ≈ 36 so 362 + 36 = 398. Since our population on the selected health center was less than 10000 so we use population correction formula: N was total hypertensive patients in the selected health centers calculated from the average of the last two recent month's hypertensive patients flow.
N = 317 + 133 + 125 = 575
Therefore, the final sample size n final = n/ [1 + {(n − 1)/N}] = 398/ [1 + {(398 − 1)/575}] = 235.4 ≈ 235
A systematic random sampling technique was used to select the patients who fulfilled the inclusion criteria during the study period. K or sample interval calculated as follows:
K = N/n = 575/235 = 2.44 ≈ 2
Where N was Total sample size (the number of hypertensive patients in woreda 2, 3 and 5) and n was final sample size. Therefore every 2 interval, the study population was selected after the first value was selected by lottery method.
Dependent variables: Blood pressure.
Independent variables: Anthropometric indices, blood group, socio-demographic characteristics, behavioral factors and family history of HTN.
The data were collected by the principal investigator and trained nurses using a structured questionnaire, anthropometric measurements, and laboratory tests.
Questionnaire: Questionnaire was used to collect demographic data, risk factors for uncontrolled BP, family history of HTN and behavioral characteristics of the study participants such as cigarette smoking, alcohol drinking, coffee drinking, salt addition and medication adherence based on Morsky medication adherence scale (mma4) were collected. Patient's medical chart was reviewed to retrieve medical information concerning co morbid illness and drug information.
Anthropometric measurement: Physical measurements such as weight, height, WC, BMI, BF%, HC, WHR, WHtR, and BF% were taken using standardized methods and adjusted equipment after the questionnaire was completed.
Blood pressure measurement: Patients were seated in a chair with their backs supported and their arms bared and supported at heart level. Patient's refrained from smoking or ingesting caffeine during 30 minutes preceding the measurement. The measurement was taken after 5 minutes of rest.
Laboratory testes: Laboratory tests were done after the questionnaire and physical examination. For blood typing, three drop of blood was taken from the finger tips and mixed with pre-made antisera containing certain antibodies (anti-A, anti-B, or anti-D) and lead to their agglutination.
Data collectors were nurses and professional laboratory technologists under the close supervision of the investigator. All the laboratory procedures were handled by professional laboratory technologists and all the tests were standardized and automated. The structured checklists were tested on 5% of the sample. Problems highlighted during the pre-test were corrected before the start of the data collection. The principal investigator evaluated the completeness and consistency of recording on the checklist sheets at the end of each working day and took corrective measures.
Descriptive data analyses were presented in tables and/or graphs with means, proportions, and frequency distributions. Binary and multivariable logistic regressions were used to check for the association between the outcome variable and the independent variables. Variables with a p value < 0.25 in the binary logistic regression were the candidate to enter multivariate logistic regression analysis. In the multivariable logistic regression analysis, predictors were considered to indicate statistical significance at a p-value < 0.05.
Data collection was preceded after Ethical clearance was obtained from the Department of Research Ethics Review Committee (DRERC) of Addis Ababa University College of Health Sciences, School of medicine, Department of Physiology, and Addis Ababa City Administration Health Bureau (AACAHB). Then official letter of support and ethical clearance with reference number (A/A/3250/227) was submitted to Nefas silk sub-city health bureau then the sub-city gave an official support letter to each selected health center. The participants were informed about the objectives and benefits of the research before we began data collection. Written consent was obtained from each participant. Patient privacy and confidentiality has been maintained.
➢ Waist circumference ≥ 94 cm, High WC for Male, WC ≥ 80 cm, High WC for Female.
➢ Hip circumference ≥ 105 cm, High HC for Male, HC ≥ 108 cm, High HC for Female.
➢ Waist to hip ratio ≥ 0.9, High WHR for Male, WHR ≥ 0.85, High WHR for Female.
➢ Waist to height ratio (WHtR) for both sexes: if ≥ 0.5, High WHtR for both sexes.
➢ Body fat percentage ≥ 25%, High BF% for Male, BF % ≥ 35%, High BF% for Female.
➢ Adherence to medication: High adherence (score 0), Medium (score 1-2) and Low adherence (score 3-4).
➢ Controlled BP: Less than 140/90 mmHg blood pressures for age less than 60 years and 150/90 mmHg for age greater than or equal to 60 years.
235 respondents were included in the study with a 100% response rate. Among them, 126 (53.6%) participants were females. The mean age of the study participants was 58.5 years ± 12.9 SD. Study participants with age ≥ 60 were 48.9% and < 60 were 51.1%. 192 (81.7%) of the study participants were Orthodox in religion. 125 (53.2%) of study participants were married and 65 (27.7%) did not attend formal education (Table 1).
Table 1: Socio-demographic characteristics of the study participants. View Table 1
The result of the study revealed that 179 (76.2%) of the study participants didn't drink coffee. 191 (81.3%) and 209 (88.9%) of the study participants never drink alcohol and did not smoke cigarettes respectively, while 158 (67.2%) of the study participants didn't perform physical exercise. On the other hand, 175 (74.5%) of the study participants had family history of hypertension (Table 2).
Table 2: Behavioral characteristics of the study participants. View Table 2
All of the respondents took antihypertensive medication and out of these, 93 (39.6%) of the patients had controlled BP and the remaining 142 (60.4%) had uncontrolled BP. The mean systolic BP of the hypertensive patients attending the health center was 142.3 mmHg and 144.7 mmHg for male and female respectively; whereas the mean diastolic BP of the participants was 88.2 mmHg and 88.8 mmHg for the male and female, respectively.
Among study participants, 43% were overweight and 21.3% were obese. 33.6% of the respondents have normal BMI and 2.1% were underweight. Only 26.4% of the hypertensive patients had normal waist circumference, while 73.6% had abnormal waist circumference (Table 3).
Table 3: Percentage distribution of anthropometric parameters. View Table 3
In this study, the majority of the hypertensive patients were blood group O (42.6%) followed by group A (28.1%), B (23.8%), and AB (5.5%). 81.3% of the respondents were Rh-positive hypertensive patients. Based on the presence of A or B antigen, O blood group hypertensive patient's account only 22% of controlled BP whereas Non O blood group had 71% of controlled BP (Figure 1).
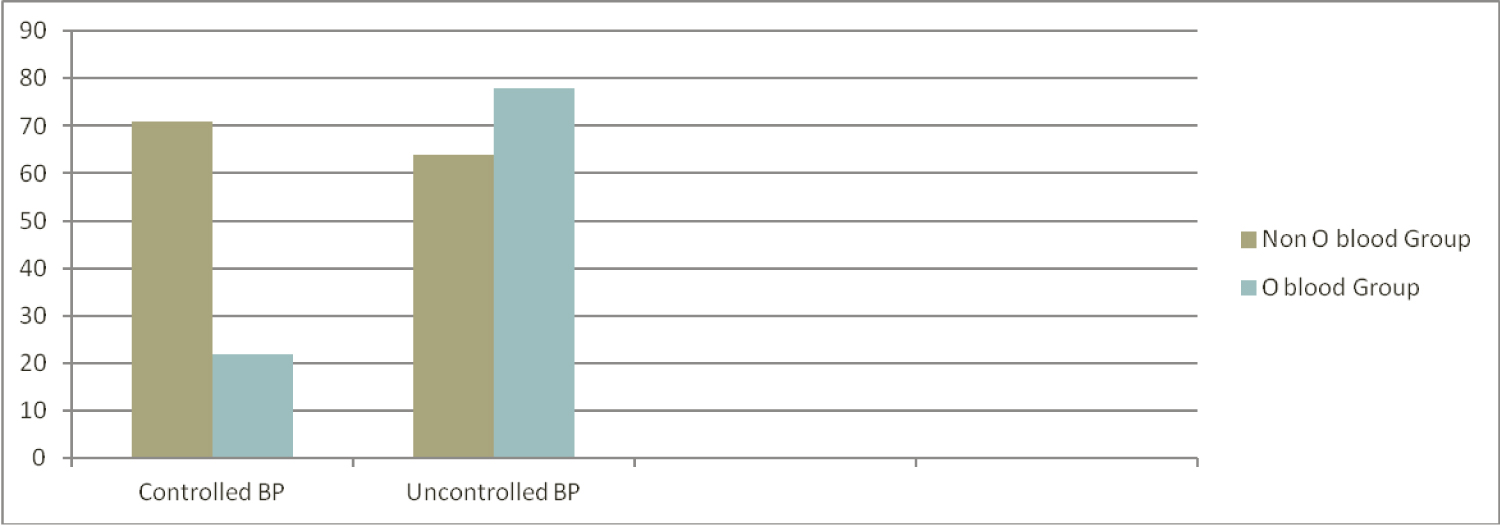 Figure 1: Blood group O and Non-O type within controlled and uncontrolled BP. View Figure 1
Age, smoking, alcohol intake, family history of HTN, physical inactivity, addition of salt on diet, blood group and all the anthropometric parameters except WHtR were significantly associated with uncontrolled blood pressure in binary logistic regression analysis. Multiple variable logistic regression analysis identified salt intake (AOR = 2.22 with 95% CI of (1.03, 4.8), P = 0.043), physical in activity (AOR = 2.47 with 95% CI of (1.10, 5.52), P = 0.027), high BMI (AOR = 7.79 with 95% CI of (3.54, 17.14), P = 0.000), high waist circumference (AOR = 3.18 with 95% CI (1.19, 8.47), P = 0.021), high Hip circumference (AOR = 5.1 with 95% CI of (1.2, 21.25), P = 0.025), and O blood group (AOR = 2.46 with 95% CI of (1.07, 5.62), P = 0.026) were positively associated variables with uncontrolled blood pressure (Table 4).
Table 4: Binary and multiple variable logistic regression analysis results. View Table 4
Anthropometric measurements which were significantly associated with uncontrolled blood pressure state of hypertensive patients were analyzed with a chi-square test to determine their association with the blood type of the patient. Using a chi-square test, BMI measurements of obesity, waist circumference measurements of visceral adiposity and Hip circumference were tested for their association with blood group. An associations were observed with a p-value of 0.000, 0.000, and 0.012 for HC, BMI, and WC respectively (Table 5).
Table 5: Chi-square test between blood group and anthropometric indices. View Table 5
In this study, the mean age of the study participants was 58.5 years (58.5 ± 12.9). A nearly similar finding is also observed in a study done in Addis Ababa primary health care facilities 58.9 ± 13.04 years [8], Nekemit referral hospital 59.4 ± 10.4 years [7], a study done on six hospitals in Ethiopia 57 ± 14 years [16], Zewditu memorial hospital55.2 ± 12.3 years [17], and two study in Jimma university 54.8 ± 12.6 years, 56.5 ± 11.96 years [5,6]. This Indicate most of the time hypertension occurs in old-age group. This may simple be related to the deteriorating body structures that results in hardening of large arteries producing high vascular resistance and increased systolic blood pressure [18].
This study showed prevalence of uncontrolled blood pressure to be 60.4% indicating that most of the hypertensive patients' blood pressures are not being controlled. This might be due to poor management of HTN both in the health care system and the patient themself. This prevalence is nearly similar to a previous study done in public hospitals in Addis Ababa and Tigray Ethiopia 63% [16], Jimma 57.8% [6], Iran 61.1% [19] and South Africa 56.8% [20]. Contrary to this, the prevalence was lower to what was reported in a study conducted at Zewditu memorial hospital 73.8% [17], Jigjiga 66% [21], Addis Ababa primary health care facilities 69% [8], Cameron 69.44% [22], Zimbabwe 67.2%, and Kenya 66.6% [23]. The possible reason for this difference might be patients with other associated comorbid illness. In opposite to this, a study done in Gondar 49.6% [23] and Jimma 49.7% [5] had lower prevalence of uncontrolled blood pressure. The possible reasons for this difference might be due to the study designs that in Gondar study BP control status were measured using the average of last 6 month BP recording so it might be prone for bias. The other reason for this difference is more than half, 60.5%, of the study subjects in Jimma study were adherent to their antihypertensive medication result in less prevalence of uncontrolled BP than the current study.
In this study, high BMI (AOR = 7.79 with 95% CI of (3.54, 17.14), P = 0.000), high hip circumference (AOR = 5.1 with 95% CI of (1.2, 21.25), P = 0.025), high waist circumference (AOR = 3.18 with 95% CI (1.19, 8.47), P = 0.021), salt intake (AOR = 2.22 with 95% CI of (1.03, 4.8), P = 0.043), physical in activity (AOR = 2.47 with 95% CI of (1.10, 5.52), P = 0.027), and O blood group (AOR = 2.46 with 95% CI of (1.07, 5.62), P = 0.026) were significantly associated variables with uncontrolled blood pressure (Table 4). Often measures of fat distribution used as a screening tool to assess the risk factor of HTN development, but in the present study, we aimed to observe the role of anthropometric measurements to determine the state of blood pressure whether controlled or not among hypertensive patients. This study showed high BMI, HC and high WC significantly associated with uncontrolled BP with an AOR of 7.79, 5.1, and 3.18 respectively. A similar finding observed in a study conducted in western Kenya [24] reported that the prevalence of HTN increases with an increase in BMI, WC, and WHtR. A similar finding also observed in a study on the association of anthropometric indices with elevated blood pressure in British adults [25]. Another study in Jordan reported WC and Age were independent predictors of HTN [26]. One study finding in Malaysia revealed BMI and WC had the highest sensitivity and specificity in predicting HTN [27]. In support to the present study, a study on the severity of obesity and management of HTN, hypercholesterolemia, and smoking in primary care done in England reported the control of BP and BMI category indirectly related that obese patients were less likely to have controlled BP compared to normal weight [28]. Another study done in Ayder comphrensive hospital in Tigray [4], Jimma University specialized hospital [29], Bale zone public hospital [30], South Africa [20] report Overweight patients had 4.5, 2.2, 2.3, and 2.9 risk of uncontrolled BP respectively. In disagreement with this finding, a study on-screening HTN among employees of Mizan-Tepi University [31], British adults [25], and the Korean population [32] showed WC, WHR, and WHtR had the better screening ability than BMI.
This study revealed hypertensive patients who did not perform physical activity were two times (AOR = 2.47 with 95% CI of (1.10, 5.52), P = 0.027) more prone (Table 4) to have uncontrolled blood pressure compared with those who perform physical activity. A similar finding were found in a study done in Southwest Ethiopia at Jimma University [5], Northwest Ethiopia at Gondar University [23], Ayder comphrensive specialized hospital [4], South Africa [20] and China [33]. Physical activity is hypothesized to lower blood pressure by attenuating peripheral vascular resistance, which may be brought on by structural and neurohormonal reactions that result in decreased sympathetic nerve activity and increased artery lumen widths. In addition positive changes in oxidative stress, inflammation, endothelial function, arterial compliance, body mass, renin-angiotensin system activity, parasympathetic activity, renal function, and insulin sensitivity are among the other potential mechanisms of exercise. Therefore, physically inactive hypertensive patients are more prone for uncontrolled BP [34].
The other important factor for uncontrolled blood pressure in the present study was salt intake. Hypertensive patients who add salt to their food were two times prone to develop uncontrolled blood pressure compared with no salt intake (AOR = 2.22 with 95% CI of (1.03, 4.8), P = 0.043) (Table 4). This is supported by studies conducted in Northwest [22] and Southwest Ethiopia [5]. The mechanism of salt consumption for uncontrolled blood pressure is when one consume excessive salt produce various negative effects, including micro vascular endothelial inflammation, anatomic remodeling, and functional abnormalities, which even in normotensive people cause blood pressure to rise [35].
Seventy eight percent of blood group O hypertensive patients had uncontrolled BP and they are two times prone to develop uncontrolled blood pressure than other blood group types (Table 4). Even though the study design was not similar, a study done on the association of ABO blood group in Iraqis with hypercholesterolemia, HTN, and DM states that blood group O had higher levels of total cholesterol, glucose, and diastolic/ systolic blood pressure followed by A, B, and AB [36]. In support to this study, a study done on genetically determined ABO blood group and its association with health and disease reported that non-O blood groups were associated with a lower risk of HTN compared with blood group O individuals [13]. In opposite to our study, a study on the association and distribution of HTN [37] and study done on the correlation of the ABO blood group system and HTN [38] showed blood group B was more susceptible to developing HTN. In opposite to the current study, a study on the association of ABO blood groups with blood pressure among the students of Abdul wali khan university Mardan reported that blood group A had higher blood pressure compared to other blood groups [39]. The proposed reasons for this disparity may be due to study design and study populations.
Our study reveals an association between obesity, abdominal adiposity and hip circumference with blood group among hypertensive patients (Table 5). Especially with obesity, there were some studies analogous to the present study which reported a significant association [40,41]. Contrary to the present study, research on the association of the ABO blood group with BMI from the Ghanaian population lacks an association [42]. Obesity results from a chronic disruption of the energy balance. Twin, adoption and family studies have shown that genetic factors play a significant role in the pathogenesis of obesity. Some of the genes involved in pathways regulating energy expenditure and food intake may play a role in the predisposition to obesity [43].
In this study, 60.4% of hypertensive patients had uncontrolled blood pressure. Uncontrolled blood pressure significantly associated with BMI, salt intake, physical in activity, high waist circumference, high hip circumference and O blood group. Blood group O was the most and AB was the least frequent blood type among hypertensive patients. Number of hypertensive patients with uncontrolled blood pressure was higher among O blood group individuals. HC and WC indices should be used routinely as a monitoring method of uncontrolled blood pressure in addition to BMI.
I want to thank Wolayta Sodo University for sponsoring me for this master's program and Addis Ababa Tikur Anbessa physiology department staff for their good services throughout my master's education. Generally, I thank all the people who participated in my research work. Lastly I want to thank my family and friends.
All authors made significant contributions to this work, whether in conception, study design, data collection, analysis and interpretation, or all of these areas; were involved in drafting, revising, or critically reviewing the article; give final approval of the version to be published; and agreed to be responsible for all aspects of the work.
The authors declare no conflicts of interest in this work, and all authors are responsible for the writing of this document.