It is known that vascular endothelial growth factor (VEGF) expression is a response to hypoxia. On the other hand hypoxia may be detected by oximetry parameters including venous CO-oximetry indices or corresponding partial pressures of O2 and CO2. However significant correlation ties between VEGF levels and oximetry parameters were not found in groups of patients with ischemic stroke and transient ischemic attack. At that some effect related to the relationship between VEGF and sO2 was observed at corresponding scatter plots. Correlation between VEGF and proteins S100 levels in serum existed only in group with severe hypoxia where sO2 is less threshold close to 39-40%. So the relationship between VEGF level and saturation index sO2 exists in conjunction with additional factor that is S100 level in serum. To assess statistical significance of observed regularity it is necessary to test three null hypotheses about independence of one of involved factors on two another. The relationship may be manifestation of hypoxia effect on VEGF. To assess significance of hypoxia effect as a whole all three null hypotheses were tested with the help of developed technique based on random permutations and involving nonparametric combinations of criteria related to single oximetry parameters. The statistical significance assessments also involved multiplicity adjustment aimed to take into account multiple search of additional factors among variety of biological indices from analyzed data set. As a result of developed technique application all three considered null hypotheses were rejected at adjusted level p < 0.02 when effect of hypoxia on correlation between VEGF and complement component C4 was evaluated.
VEGF, Hypoxia, Controlled correlations, Permutation test, Nonparametric combinations, Multiple testing
Angiogenesis may be a biological response to insufficient oxygen supply resulting in hypoxia. The key mediator of angiogenesis and probably neurogenesis [1] is vascular endothelial growth factor (VEGF) which is homodimeric glycoprotein with a molecular weight of approximately 45 kDa. VEGF expression is activated as a response to stabilization and nuclear translocation of hypoxia-inducible factor-1 (HIF-1) when intracellular oxygen level is reduced [2]. Existence of HIF-1, VEGF signalling pathways is confirmed by high levels of VEGF in patients with chronic obstructive pulmonary disease (CHOPD) [3] and asthma [4] or in subjects with "plateau red face" [5]. It is known that immune system is involved in angiogenesis via secreting VEGF and other pro-angiogenic factors by macrophages, neutrophyles and other immune cells [6-8]. Oxygen saturation index sO2 and other CO-oximetry parameters in venous blood reflect balance between oxygen delivery and oxygen consumption [9]. Low sO2 correspond to tissue hypoxia [10]. However correlation coefficients between CO-oximetry parameters and VEGF levels were small and not statistically significant in groups of patients with severe neurological disorders. Corresponding data set is discussed below. Correlation coefficients between VEGF and partial pressures of O2 and CO2 were also not significant. Lack of reliable ties may be attributed among other things to complexity of existing dependence when relationship between two factors is controlled by the third one. Previous study of the data set with the help of OVP method [11,12] and visual analysis of related sparse diagrams uncover complex effect involving sO2 and levels in serum of VEGF and proteins from S100 family.
Left scatter diagram from Figure 1 corresponds to group with sO2 lower than 38.4%. This diagram conforms to existence of linear dependence of VEGF on S100 level. The only exception is one object that is marked with a red circle. At that there is no noticeable correlation between VEGF and S100 in the right diagram. This diagram corresponds to group with sO2 greater than 38.4%. It may be suggested that the correlation observed in the left diagram may be caused by severe hypoxia existing when sO2 is below 38.4%. The relationship from Figure 1 may be described by following equations:
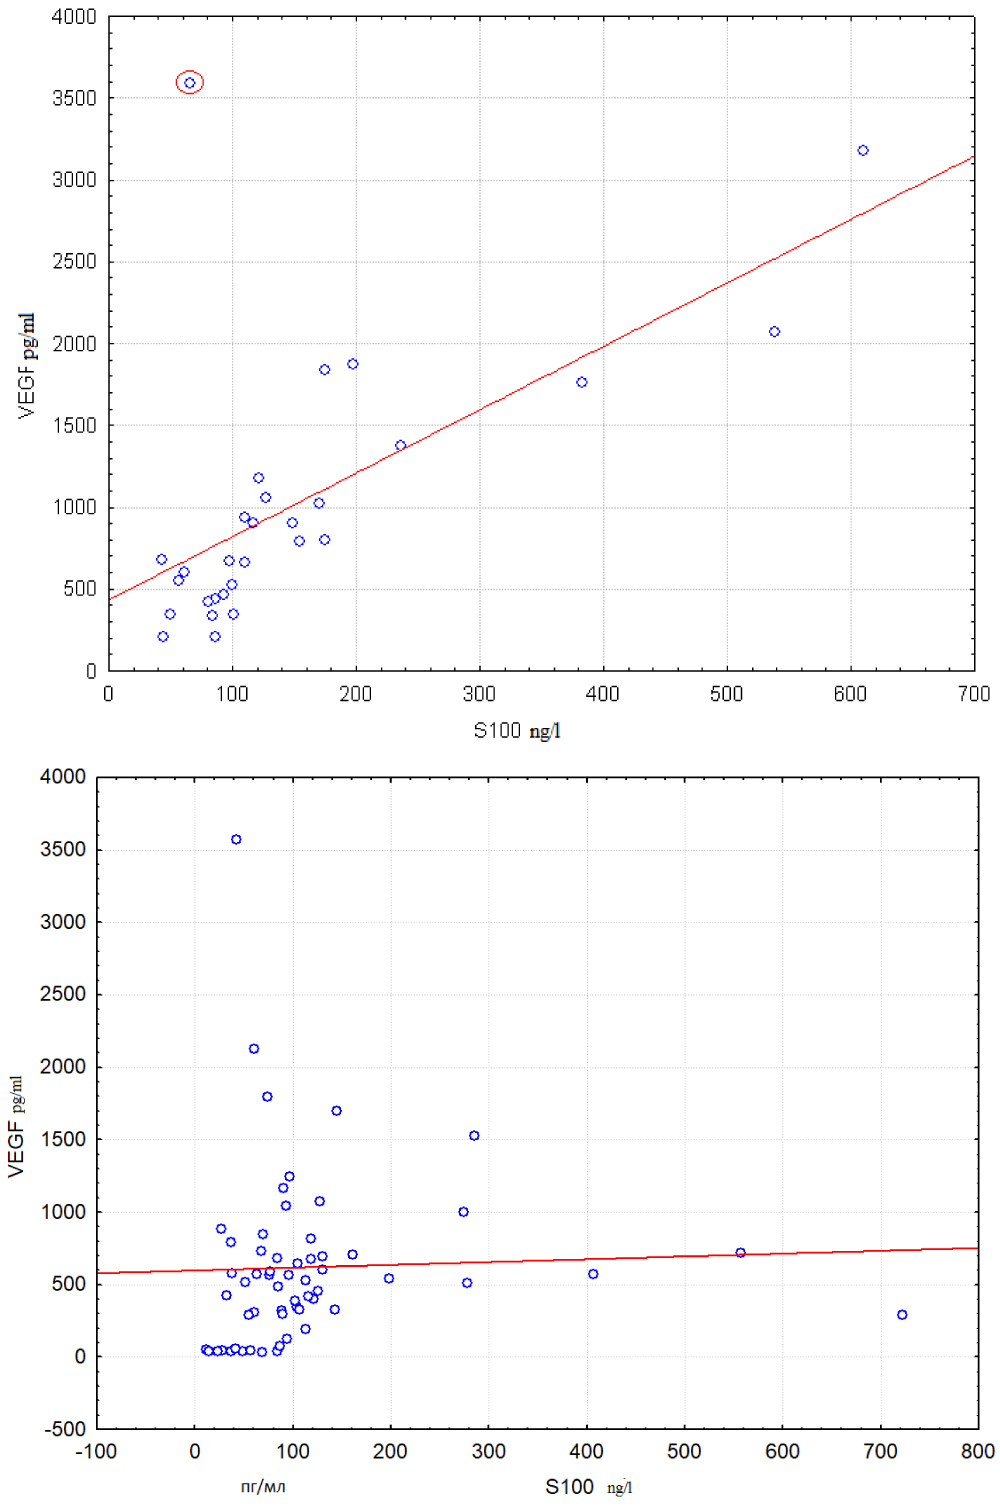 Figure 1: Correlation between S100 and VEGF levels are compared in groups with sO2 < 38.4% (left scatter plot) and sO2 > 38.4% (right scatter plot).
View Figure 1
Figure 1: Correlation between S100 and VEGF levels are compared in groups with sO2 < 38.4% (left scatter plot) and sO2 > 38.4% (right scatter plot).
View Figure 1
Model (1) evidently is equivalent to standard piece-wise regression if Xi is equal to Zk. It is supposed that the verification procedure must satisfy following demands:
• Verification procedure must include testing significance of both variables X and Z.
• Hypoxia is assessed by several oximetry parameters. It may be expected that statistical technique evaluating the effect of hypoxia on relationship between VEGF and additional factor Xi would be more powerful if it implements combination of statistical tests assessing effect each of oximetry parameters on relationship between Y and Xi.
• Effect from Figure 1 was found via testing variety of factors. So multiple testing must be taken into account when statistical significance is estimated.
Permutation test is an approach capable of meeting the listed demands due to following advantages. Permutation test may be implemented regardless whether or not underlying distributions of test statistics are known. There are no limitations on data sets sizes. Different permutation tests were proposed for assessing importance of each predictor in multiple regression models. Method based on testing significance of corresponding partial correlation coefficients may be mentioned in this regard [13]. Permutation test was used to make a choice between piece-wise regression and a simple linear regression [14]. However mentioned techniques are not suitable to evaluated significance of the effect considered in the paper. Verification is possible with the help of discussed below procedure based on testing several null hypotheses.
Effective methods calculating nonparametric combination (NPC) of several dependent permutation tests [15] may be used for assessing significance of hypoxia effect by several oximetry parameters. Also permutation tests are widely used to control multiplicity in various applied tasks including high-dimensional tasks related to DNA microarray experiments [16-19]. At that there are different ways to control FWER. Single step or stepwise procedures may be used to receive adjusted p-values from previously received raw p-values by min P correcting procedure or to calculate adjusted p-values directly from distributions of test statistics by maxT technique [20-22]. Unlike the mentioned works our paper is focused at problems associated with multiplicity control and combinations of several criteria when more complicated multifactor regularities are studied.
Effect of hypoxia on relationship between VEGF and 138 different biochemical, clinical or biophysical parameters was studied in a group of 88 patients of age from 33 to 88 with ischemic stroke and transient ischemic attack. Hypoxia level was assessed by partial pressures of O2 and CO2 and also by CO-oximetry parameters in venous blood that were measured with ABL80 FLEX CO-OX analyser. Serum levels of VEGF, S100 and complement component C4 were measured by the enzyme-linked immunosorbent assay (ELISA). CO-oximetry parameters together with partial pressures of O2 and CO2 in venous blood will be for the simplicity further referred to as oximetry parameters.
Results of standard correlation analysis are given in Table 1.
Table 1: Correlation coefficients between partial pressures of O2 and CO2 and CO-oximetry parameters in venous blood and VEGF levels. View Table 1
It can be seen from Table 1 that statistically significant linear ties between VEGF levels and hypoxia are absent.
It is quite possible that linear ties nevertheless may exist in combination with some additional factors. Such supposition is supported by the effect of oxygen saturation index (sO2) on relationship between VEGF and proteins S100 levels in serum. This effect was discovered with the help of OVP technique [11] and visual analysis of corresponding scatter plots. Left scatter plot from Figure 1 presents strong linear relationship between VEGF and S100 in group with saturation level sO2 less than 38.4. It is seen from right scatter plot that noticeable linear dependence between VEGF and S100 is absent in the group with saturation level sO2 greater than 38.4.
It may be supposed from Figure 1 that hypoxia leads to correlation between VEGF (Y ) and S100 (Xi). So S100 may be considered as additional factor. Our goal is to assess statistical significance of the assumed effect.
Complex dependencies testing: The above supposition is too complex to test using a single null hypothesis. In fact the effect contradicts the following three hypotheses:
a) -Yis independent of vector (Zk, Xi);
b) - Xi is independent of vector (Y, Zk);
c) - Zk is independent of vector (Y, Xi).
All three hypotheses must be rejected to be sure that the supposition is perfectly correct. Otherwise the observed pattern may be explained simpler. For example it may be attributed to existence of linear relationship between Y and Xi when is in fact true.
Testing single hypothesis: The discussed effect is associated with great difference between and great value of one of the two correlation coefficients. High correlation values are achieved randomly in small groups. So the two conditions above may be a convincing evidence of the effect only when sizes of both groups are great enough. Thus the mentioned conditions correspond to great values of the following functional:
Where ml is the number of patients in group l with Zk < δ and mr is the number of patients in group r with Zk > δ. The threshold δ is initially unknown. It is proposed to use the optimal threshold δ0 that is calculated as δ0 = arg max 2ρ(δ). Maximum of the functional Q2ρ(δ) may be searched by trying all boundaries between distinct values of Zk existing in full group . Great values of Q2ρ(δ0) better testify against each of 3 null hypotheses , and if δ0 is searched inside interval (δ1; δr) including only such thresholds for Zk that provide simultaneous validity of inequalities ml > mthr and mr > mthr. The narrowed search interval is used because of the high probability of great Q2ρ(δ0) values when null hypotheses are true but one of the groups is small. Probability of great correlation coefficients in small groups evidently is higher. Full compensation of this probability increase is impossible by using multiplier mlmr only.
Existence of outlying observations such as observation circled in red on the left part of Figure 1 reduces Q2ρ and so may hinder correct statistical evaluation of the studied effect. So it is better to use robust Pearson correlation coefficient.
Robust correlation coefficient: Suppose that dependence of variable U on variable V is studied on data set = {(uj, vj) | j = 1, . . . , m}. At the first step simple linear regression model U = β0 + β1V + e is calculated by . Let out be the set of all 3σ outliers or out = {(uj, vj) || uj - β0 - β1vj| > 3σe }, where σe is standard error of regression model. Robust correlation coefficient is calculated as standard Pearson correlation coefficient ρ by set \ out.
The robust version of the functional 2 can be written as
Where and are robust correlation coefficients in groups and . Optimal threshold δ0 is calculated now as . Functional is used as statistics for testing null hypotheses , and Then p-values for these null hypotheses are calculated according to the following Procedure I:
• Calculate optimal threshold δ0 on data set as The observed statistics value T0 is taken equal to
To test repeat independently steps a1 and a2 for r = 1, . . . , N.
• a1) Take a random permutation of . This is obtained by considering a random permutation ur = of objects labels (1, . . . , m).
Let
• a2) Calculate optimal threshold δ0 on training set as The statistics value Tr is taken equal to
• Then calculate estimate of p-value for the null as
To repeat independently steps a3 and a2 for r = 1, . . . , N.
• a3) Take a random permutation of as Where ur = is a random permutation of {1, . . . , m}.
• Implement step (a2).
• Then calculate estimate of p-value for the null as
To test repeat independently steps a4 and a2 for r = 1, . . . , N.
• a4) Take a random permutation of as Where ur = is a random permutation of {1, . . . , m}.
• Implement step (a2).
• Then calculate estimate of p-value for null hypothesis as
A regularity for combination of factors (Y, Xk, Zi) similar to the one in Figure 1 is supposed to be significant at level α if all three inequalities hold. It is difficult to make a theoretical conclusion about unbiasedness and consistency of the described test. However its performance can be assessed in experiments with simulated data.
Design of experiments: Experiments were designed to imitate regularity from Figure 1 only for certain groups of variables while for the remaining ones such regularities were absent. Scenario includes generating variables Y, Z1, . . . , Z7, X1, . . . , Xn. VariablesYand e1, . . . , en were independently sampled from N(0,1), variable X1, Ug and variables U2, ..., U7 are independently sampled from continuous uniform distribution U(0,1). Variables X1, . . . , Xn are calculated fromY, e1, . . . , en, Z1 and Ug. Variables Z2, . . . , Z7 are calculated from Z1 and U2, . . . , U7.
1) Variables X1, . . . , X30 for an observation j were calculated as if Z1j < 0.4 and as otherwise. In groups with Z1j < 0.4 correlation level betweenYand Xi is determined by parameter δ1. Experiments with δ1 = 0.75 and δ1 = 0.57 were conducted. Choice δ1 = 0.75 provides generating data with ρ(Y, Xi) = 0.8 and choice δ1 = 0.57 corresponds to ρ(Y, Xi) = 0.87. Parameter δ2 was taken equal to Observations with Z1j ≥ 0.4 were generated from distribution with ρ(Y, Xi) = 0.
Thus in the first experiment data was sampled from distribution with ρ(Y, Xi) = 0.8, σY = 1 and when Z1 < 0.4 and from distribution with ρ(Y, Xi) = 0, σY = 1 and when Z1 ≥ 0.4.
In the second experiment data was sampled from distribution with ρ(Y, Xi) = 0.87, σY = 1 and when Z1 < 0.4 and from distribution with ρ(Y, Xi) = 0, σY = 1 and when Z1 ≥ 0.4. So data is generated to provide existence of effect that is similar to effect from Figure 1 for each combination from set {(Y, Xi,Zk)|i = 1, . . . , 30, k = 1, . . . , 7}.
2) Variables X31, . . . , X60 for the observation j were calculated as if Ug < 0.4 and as if Ug ≥ 0.4. So observations are generated from mixture of distributions with ρ(Y, Xi) = 0.8 and ρ(Y, Xi) = 0 in the first experiment and from mixture of distributions with ρ(Y, Xi) = 0:87 and ρ(Y, Xi) = 0 in the second one. Thus data is generated to provide existence of weak mutual correlation for pairs from {(Y, Xi)|i = 31, . . . , 60} and independence of such pairs on Z1, . . . , Zk.
3) Variables X61, . . . , X90 for the observation j were calculated as SoYis independent on variables X61, . . . , X90 and Z1.
4) Variables Z2, . . . , Z7 for the observation j were calculated as Zij = Z1j if Ug ≤ 0.9 and as Zij = 1 - Z1j if Ug > 0.9. There are no regularities for combinations (Y,Xk,Zi) when 31 ≤ i ≤ 90 that are similar to regularity from Figure 1. Variables Z1, . . . , Z7 are included in scenario to imitate all 7 oximetry factors. At that for combinations (Y,X1,Zi) regularities are more distinct to compare with regularities for combinations (Y,Xk,Zi) when k > 1. Sets X1, . . . , X30; X31, . . . , X60; X61, . . . , X90 will be referred to as correspondingly.
Results of experiment: Results of the first and second experiments are presented in Table 2. Columns of the table correspond to significance levels from p < 0.0001 to p < 0.1. Upper part of table corresponds to first experiment (δ1 = 0.75) and lower part of table corresponds to second experiment (δ1 = 0.57). Cell at intersection of row corresponding to significance level α and column corresponding to subset contains number of triples (Y, Xi,Z1) with for which all three null hypotheses were rejected at least at level α. Number of triples from set for which all three null hypotheses were rejected at level α is given in the same cell in parentheses.
Table 2: Results of experiments with simulated data. View Table 2
It may be seen from Table 2 that all three null hypotheses were rejected for the majority combinations from the set In the first experiment all null hypotheses were rejected at significance level p < 0.01 for all 30 combinations from when k = 1 and for 163 combinations from 180 when k = 2, . . . ,7. On the contrary all null hypotheses were rejected only for few combinations from the sets and All null hypotheses were rejected at significance level p < 0.1 only for one combination from and for one combination from when k = 1. At that number of combinations where all three null hypotheses were rejected equals 6 inside and 3 inside for k = 2, . . . ,7. In the second experiment number of combinations where three null hypotheses were rejected at level α were higher than number of such combinations practically for all significance levels. So the results of experiments strongly indicate unbiasedness of the developed criterion.
The developed technique was applied to find regularities similar to the one shown in Figure 1 on the described above clinical data set. Three null hypotheses were tested for combinations (Y, Xi,Zk) whereYis concentration of VEGF in serum, Z1, . . . , Z7 were oximetry parameters sO2, pO2, pCO2, FCOHb, FO2Hb, FMetHb, FHHb. All 138 variables different from VEGF concentration and oxymetry parameters were tried as additional factors X1, . . . , Xn. The most significant effects were revealed if concentrations of S100 proteins or complement component C4 in serum are used as additional factor X. Table 3 present calculated p-values correspondingly for all such combinations.
Table 3: Results of the null hypotheses testing when S100 or C4 are additional factors. View Table 3
It is seen from Table 3 that all null hypotheses are rejected at significance level p < 0.001 for combination (VEGF, pO2, C4), at significance level p < 0.002 for combinations (VEGF, sO2, C4) and (VEGF, FO2Hb, C4), at significance level p < 0.05 for combinations (VEGF, FHHb, C4), (VEGF, sO2, S100), (VEGF, pCO2, S100). Regularity related to effect of hypoxia on correlation between VEGF and S100 is shown at Figure 2.
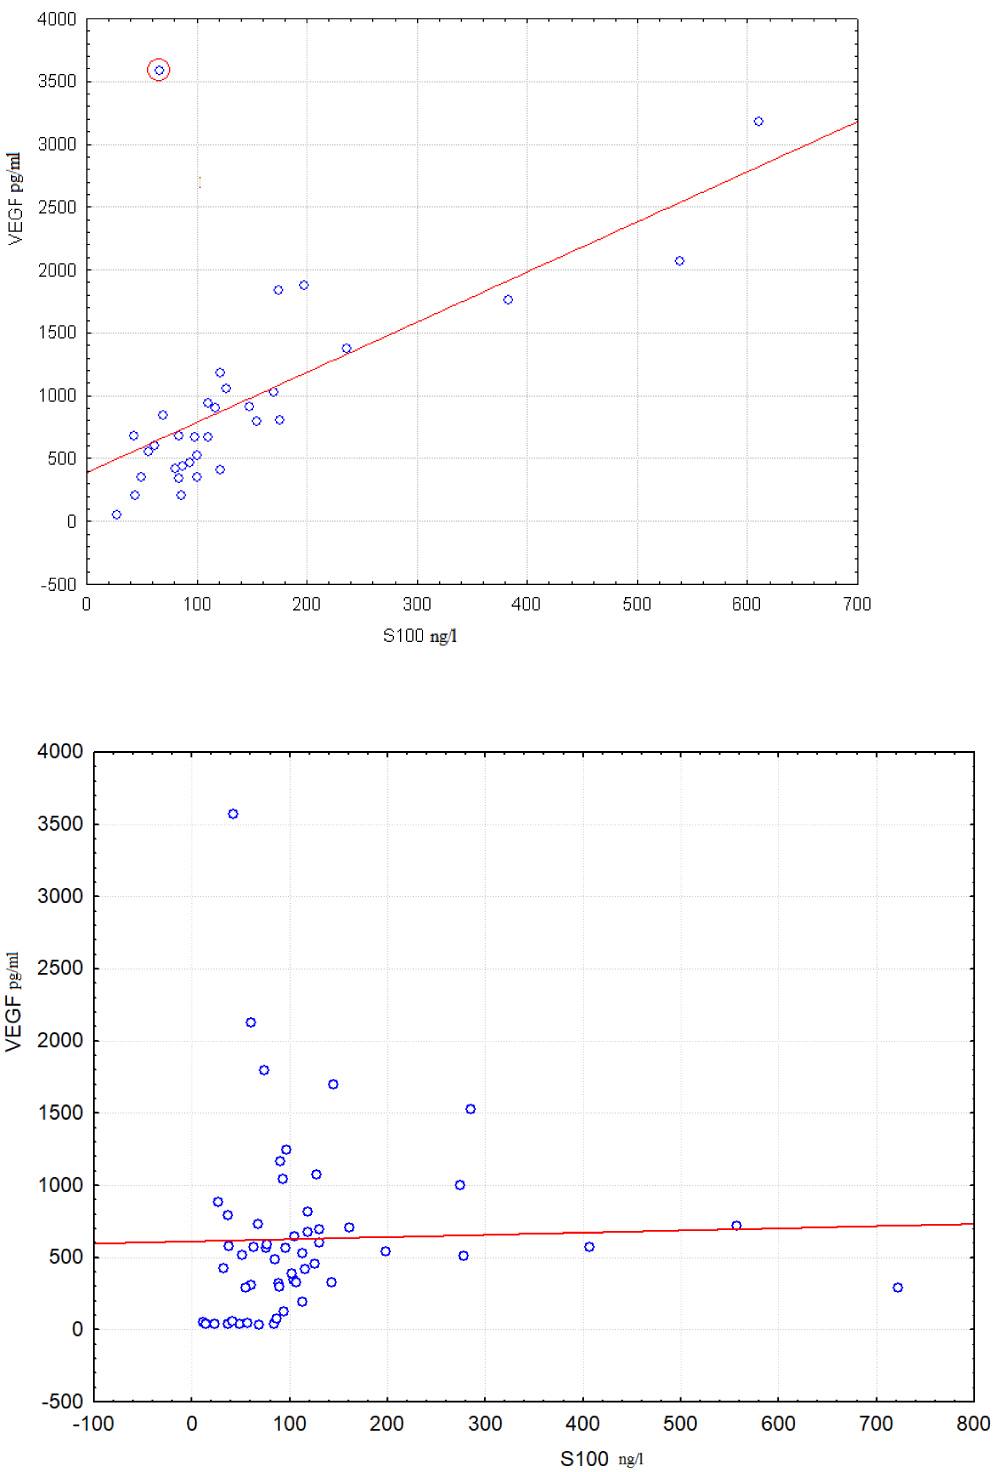 Figure 2: Correlations between S100 and VEGF levels are compared in groups with sO2 < 39.75% (left scatter plot) and sO2 > 39.75% (right scatter plot). Boundary point was calculated using Procedure I.
View Figure 2
Figure 2: Correlations between S100 and VEGF levels are compared in groups with sO2 < 39.75% (left scatter plot) and sO2 > 39.75% (right scatter plot). Boundary point was calculated using Procedure I.
View Figure 2
Pattern from Figure 2 is similar to the pattern from Figure 1. However boundary point for pattern from Figure 2 is received by procedure I. This boundary differs from boundary for the pattern from Figure 1 that was calculated by OVP method. Correlation coefficient between VEGF and S100 in group of 33 cases with sO2 < 39.75% equals 0.64. Correlation coefficient increases to 0.88 after removing an outlying object highlighted in the left scatter diagram by red circle. No relationship between VEGF and S100 exists in group of 55 cases with sO2 < 39.75% as it may be seen from right diagram. Corresponding correlation coefficient equals 0.03.
It may be seen from Figure 3 and Figure 4 that effect of hypoxia on relationship between VEGF and C4 is similar to the effect of hypoxia on relationship between VEGF and S100. Correlation coefficient between VEGF and C4 is equal 0.47 in group of 31 cases with sO2 < 39.25% which corresponds to left scatter diagram from Figure 3. Correlation coefficient increases to 0.76 after removing of outlying object which is highlighted at the left scatter diagram by red circle. No significant relationship between VEGF and C4 exists in group of 57 cases with sO2 > 39.25% as it may be seen from the right diagram. Corresponding correlation coefficient equals -0.11. Correlation coefficient increases to 0.05 after removing the highlighted at right diagram outlier.
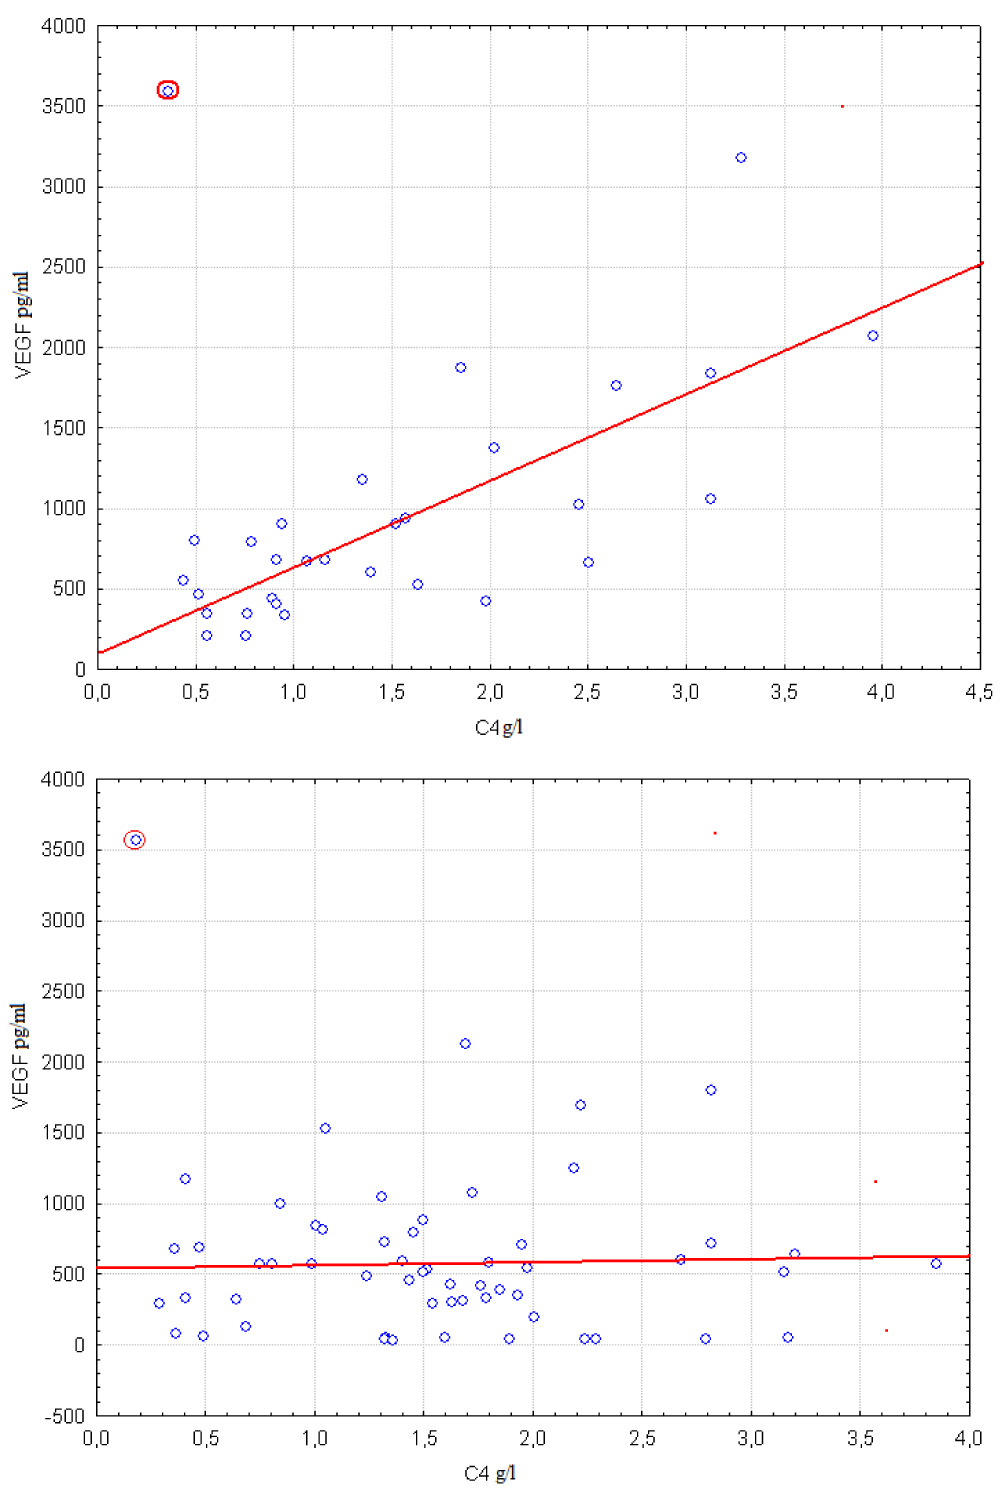 Figure 3: Correlation between VEGF and C4 levels are compared in groups with sO2 < 39.25% (left scatter plot) and sO2 > 39.25% (right scatter plot). Boundary point was calculated using Procedure I.
View Figure 3
Figure 3: Correlation between VEGF and C4 levels are compared in groups with sO2 < 39.25% (left scatter plot) and sO2 > 39.25% (right scatter plot). Boundary point was calculated using Procedure I.
View Figure 3
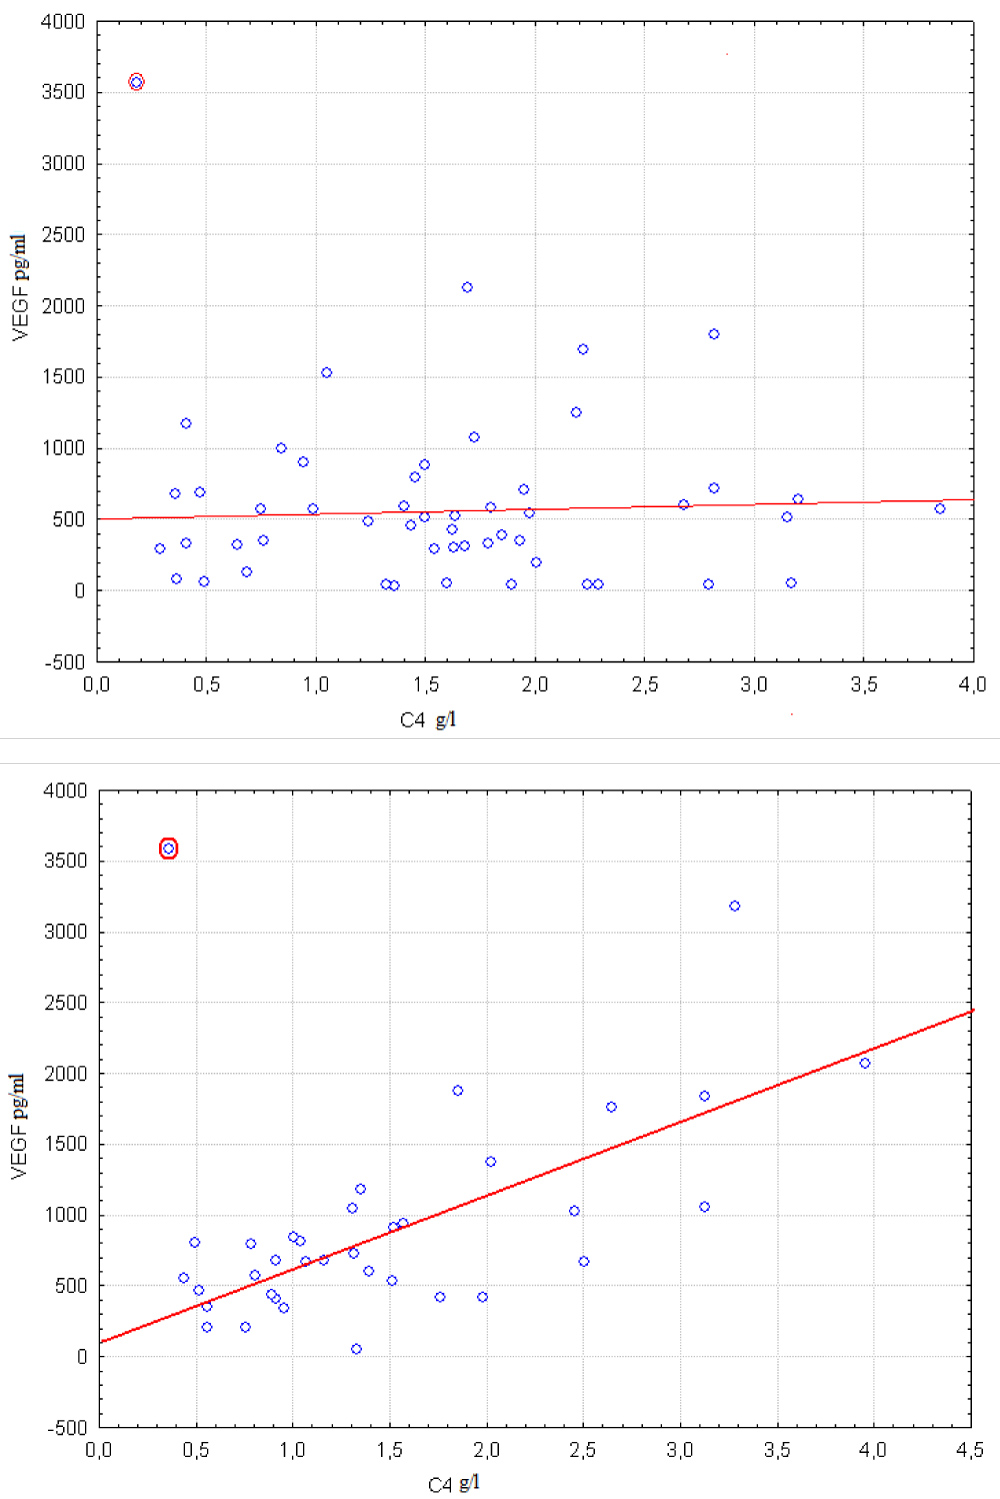 Figure 4: Correlation between VEGF and C4 levels are compared in groups with FHHB < 56.3% (left scatter plot) and FHHB > 56.3% (right scatter plot). Boundary point was calculated using Procedure I.
View Figure 4
Figure 4: Correlation between VEGF and C4 levels are compared in groups with FHHB < 56.3% (left scatter plot) and FHHB > 56.3% (right scatter plot). Boundary point was calculated using Procedure I.
View Figure 4
Low saturation index sO2 corresponds to high FHHB values. Strong correlation between VEGF and S100 exists when FHHB is greater than a certain threshold. At that correlation coefficient is close to zero when FHHb is lower than the threshold as can be seen in Figure 4. Correlation coefficient between VEGF and C4 in group of 36 cases with FHHB > 56.3% equals 0.45. Correlation coefficient increases to 0.73 after removing of outlier highlighted at right diagram. No significant relationship between VEGF and C4 exists in group of 52 cases with FHHB < 56.3% as it may be seen from left diagram. Corresponding correlation coefficient is equal -0.1. Correlation coefficient increases to 0.07 after removing of highlighted at left diagram outlier.
Our goal is testing if hypoxia has effect on VEGF production via controlling relationship between VEGF and some additional factor. Hypoxia effect is manifested via effects associated with different oximetry parameters. Existence of supposed hypoxia effect contradicts simultaneously to several of null hypotheses associated with different oximetry parameters. Hypoxia effect may be assessed by testing global null hypotheses and [15]. Last global hypotheses may be tested with the help of nonparametric combinations (NPC) methodology [15]. To test global hypothesis on data set following NPC procedure was used.
Procedure II: Repeat steps (b1), . . . , (b4) for k = 1, . . . , 7.
• b1) Calculate T0 according to step a0 from Procedure I on data set
• b2) For r = 1, . . . , N repeat step if is tested, g = 1, . . . , 3.
- Take random permutation of according to step (a1) from Procedure I and implement step a2 from Procedure I to calculate statistics Tr by
- Take random permutation of according to step (a3) from Procedure I and implement step a2 from Procedure I to calculate statistics Tr by
- Take random permutation of according to step (a4) from Procedure I and implement step a2 from Procedure I to calculate statistics Tr by
• b3) Calculate
• b4) Calculate r = 1, . . . , N
• Calculate statistics
• Calculate statistics
• Then calculate that is p-value testing hypothesis when step
Test statistics in Procedure II is calculated as a combining function of p-values related to partial tests. Several combining functions are discussed in [15]. The best performance is achieved according to our experiments when slightly modified Fisher combining function ψ is used. Let are some p-values calculated by permutation test with N random permutations. Then where if and otherwise.
Results of the Procedure II applied to the studied data set are presented in Table 4. It can be seen that the global null hypotheses and are rejected at level p < 0.0005 when additional factors are C4 and S100 concentrations. Global null hypothesis is rejected at p = 0.0001 when additional factor is C4 concentration. But is not rejected when additional factor is S100 concentration.
It was necessary to test global null hypotheses from set to reveal the supposed effect of hypoxia on relationship between concentration of VEGF and concentrations of C4 or S100. So a multiple testing procedure must be used to assess true statistical significance of revealed effects. It is sufficient to use a single-step procedure because only two global null hypotheses associated with C4 and S100 as initial factors were rejected. Methods min P and max T are effective tools of multiplicity control [22]. More universal min P procedure is preferable for discussed task because max T technique is based on unjustified supposition about approximate equality of test statistics distribution.
Adjusted p-values were calculated by the represented below Procedure III.
Repeat steps (c1), (c2) and (c3) for i = 1, . . . , n.
• c1) Use Procedure II to calculate statistics by and random permutations correspondingly. At that step is implemented when is tested, g = 1, . . . , 3.
• c2) Calculate
• c3) Calculate
• c4) Calculate
• c5) is equal to that is adjusted p-value testing global null hypothesis when is used at step (c1).
The described Procedure III provides weak FWE control. Procedure III was applied to calculate adjusted p-values for global null hypotheses and Results are presented in Table 4.
Table 4: Results of the global null hypothesis testing with NPC and multiplicity control with Procedure III. View Table 4
It is seen from Table 4 that the global null hypotheses and are rejected when concentrations of C4 and S100 are additional factors. At that is not rejected if additional factor is concentration of S100. So it is possible that pattern from the Figure 2 may be related only to existence of linear relationship between VEGF and S100 levels in serum which is not controlled by hypoxia. On the other hand set of relationships that are represented at Figure 3 and Figure 4 or are mentioned in Table 3 where concentrations of C4 is additional factor cannot be explained with the help of some simpler effect. These relationships cannot be reduced to linear correlation between VEGF and C4. Also they cannot be explained by effect of hypoxia on VEGF only or on C4 only. So supposition that relationship between VEGF and C4 levels in serum is controlled by hypoxia is in accordance with data.
Results may be shortly summarized as follows. A method was developed which is aimed to discover relationships of the following type in data: Significant linear correlation between two factorsYand Xi exists only if third factor Zk belongs to interval from one side of some threshold δ. At that from another side of δ Pearson correlation coefficient is close to zero.
It was suggested to consider such three-factor relationship as statistically significant when rejecting three null hypotheses: and Nonparametric permutation tests with statistics that is optimal value of special quality functional were used to test these hypotheses.
Performance of the method was evaluated in tasks with simulated data. Good concordance between found regularities and patterns provided by the experiment scenario is seen from Table 2.
The method was applied to test supposition that hypoxia control relationship between serum VEGF concentration and some factor from the analyzed clinical database. It was supposed that hypoxia is manifested by oximetry parameters. Three null hypotheses were rejected for set of triples (Y, Xi,Zk) whereYis VEGF concentration, Xi is some additional factor and Zk is some of oximetry parameters.
Significance of hypoxia effect on correlation between VEGF level and additional factor Xi may be assessed as combined significance of effects related to different oximetry parameters. Combined significance was evaluated with the help of NPC method testing intersection of null hypotheses related to set of triples A single-step permutations based FWE control was implemented to take into account that additional factor is searched among 138 variables.
It was shown that three combined null hypotheses were rejected at significance level p < 0.02 when concentration of complement C4 is the additional factor. Developed technique may be used in variety of biomedical tasks where it is necessary to assess effect of some factor or some group of factors on existing linear ties.
This study was supported by RFBR grant 20-01-00609.