Idiopathic pulmonary fibrosis (IPF) is a chronic and fatal interstitial lung disease with no current cure. Progression of IPF is difficult to predict as the clinical course can be highly variable and range from a rapidly deteriorating state to a relatively stable state, or may be characterized by a slow progressive decline. Therefore, the need for an accurate diagnosis and improved tools for monitoring and managing IPF is of paramount importance, all for understanding the mitochondrial structure and the function played in the IPF. Mitochondrial DNA copy number (MtDCN) has been correlated with mortality in IPF patients and is a source of potentially clinically relevant information. We investigated the effects of various expiratory variables on MtDCN via multiple linear regression models. The models and their theoretical framework are presented under a descriptive and then analytic approach to investigate the complex and impact causes of IPF. Generalized linear model (GLM) based boosting is fitted before and after imputing the missing data. The Bayesian Hierarchical logistic models with categorical response variables that were created using carefully chosen cut-off points to classify the patients. This research provides an opportunity for novel patient surveillances.
Idiopathic pulmonary fibrosis, Modelling, Prediction, Classification
Idiopathic pulmonary fibrosis (IPF) is a chronic and fatal interstitial lung disease with no current cure. The overall incidence of this disease is estimated at 6.8 to 17.4 cases per 100,000 people, with a 10-fold increased incidence in individuals over the age of 65. Progression of IPF is difficult to predict as the clinical course can be highly variable and range from a rapidly deteriorating state to a relatively stable state, or may be characterized by a slow progressive decline [1]. Until recently there was no pharmacological therapy for IPF. However, in October 2014 the first two FDA approved therapies (nintedanib and pirfenidone) were introduced into the market. These therapies have variable efficacy and may be associated with a variety of side effects. Therefore, the need for an accurate diagnosis and improved tools for monitoring and managing IPF is of paramount importance. The search for blood biomarkers that can aid in the diagnosis and monitoring of disease progression remains elusive. Mitochondrial DNA copy number (MtDCN) has been correlated with mortality in IPF patients and is a source of potentially clinically relevant information for physicians [2-6]. To date, there is little literature that explores the correlations between MtDCN and IPF factors and disease progression. We propose several models that investigate the effects of MtDCN on patients with IPF. The objective of this study is to build predictive models that correlate biomarkers derived from the peripheral blood of IPF patients, with clinical lung function data. This paper studies the differences between the values of MtDCN of normal subjects and IPF patients. We describe further factors that might impact the values of MtDCN in IPF patients.
We first investigated the effects of various expiratory variables on MtDCN via multiple linear regression models after performing variables selection. Data adjustments were made to satisfy the normality assumption of the ordinary regression model and imputation of the missing data was done using the Bayesian bootstrap method [7]. To validate the analysis, Generalized linear model (GLM) based boosting was fit before and after imputing the missing data. The results show consistency in estimating the effects of the chosen predictors. Next, to avoid the normality assumption, we fit Bayesian Hierarchical logistic models with categorical response variables that were created using carefully chosen cut-off points to classify the patients.
The remaining paper presents the models and their theoretical framework in construct and hypothesis building, under a descriptive and then analytic (epidemiology) approach to investigate the complex and impact causes of IPF.
The aims of this research is to understand how clinicians can internally compute and communicate quantitative variables-such as changes in mitochondrial DNA copy counts-and use such information to guide clinical management. The observation that mitochondrial DNA copy counts decrease with both age and disease is well validated [8-10]. However, the link between disease severity and changes in this marker have yet to be fully elucidated. By comparing this marker to clinical and demographic data in 30 IPF patients we expect to identify a small number of quantitative variables that can be expanded to a larger cohort and used to establish meaningful clinical indicators.
IPF is a highly heterogeneous disease that has a variable and unpredictable clinical course in individual patients. Clinical factors such as age, sex, lung function, and smoking history have an association with the progression and severity of disease. Yet, conceptual frameworks for thinking about such processes, and our understanding of their medical implementation, remain in their infancy. This study includes 67 participants over the age of 50 of which 31 have been clinically diagnosed with IPF. Each patient donated 10 ml of whole blood from which Peripheral blood mononuclear cells (PBMCs) were isolated.
The IPF patients who participated were referred to the Advanced Lung Disease Program at Inova Fairfax and diagnosed with Idiopathic Pulmonary Fibrosis based on the current consensus guidelines [11]. The study was approved by the Inova Fairfax Hospital Internal Review Board (IRB #06.083) with appropriate written informed consent obtained for each patient. Normal participants included presented with no clinical history of IPF and a normal chest X-ray. All normal subjects provided informed consent to participate in protocol 15-H-0017, which was approved by the NHLBI IRB.
Mitochondrial DNA copy number was calculated following a previously published protocol [5]. We collated clinical data from multiple sources obtained over the course of 1-year prior to the blood sampling. Our clinical data includes standard demographic information such as: Age, sex, familial status, smoking status, and life time smoking volume (Table 1).
Table 1: List of clinical and molecular markers meausre collected from the patient cohort. View Table 1
More attention will be given to the statistical models and their extensions. The power and flexibility to manipulate data (missing or incomplete) and accommodate the error components provide calibration to patients' classification and medical researchers in general will be provided next.
Model specification and assumption can elucidate the data. Exploratory analysis is performed and covariates selected. Generalized linear models [12] with low Akaike information criteria (AIC) will be deemed satisfactory and the covariates used in the further analyses. Markov Chain Monte Carlo methods will be used to assess variational inference and follow them up with classification and predictive accuracy.
First, we may transform the data of the latent variables in our model to the real coordinate space and ensure normality. For example, the logarithm transforms a positively constrained variable, with a standard deviation, to the real line. Then, we plan to posit a Gaussian variational distribution. This induces a non-Gaussian approximation in the original variable space. Last, we combine automatic differentiation with stochastic optimization to maximize the variational objective. We begin by defining the class of models we support. Bayesian bootstrap imputation procedure will be used as it is an efficient method to handle missing data in a multilevel setting.
We are interested in finding a predictive model of the response MtDCN, say Z. To fit linear regression model, the response has to be distributed as normal distribution. Running the Shaprio's Test of normality, with the null hypothesis as H0: Z is normally distributed, we get W = 0.88144 and small p - value < 0.05. That suggests Z is not normally distributed. Therefore, Box-Cox transformation method was considered to obtain normally distributed variables that represent MtDCN (Figure 1).
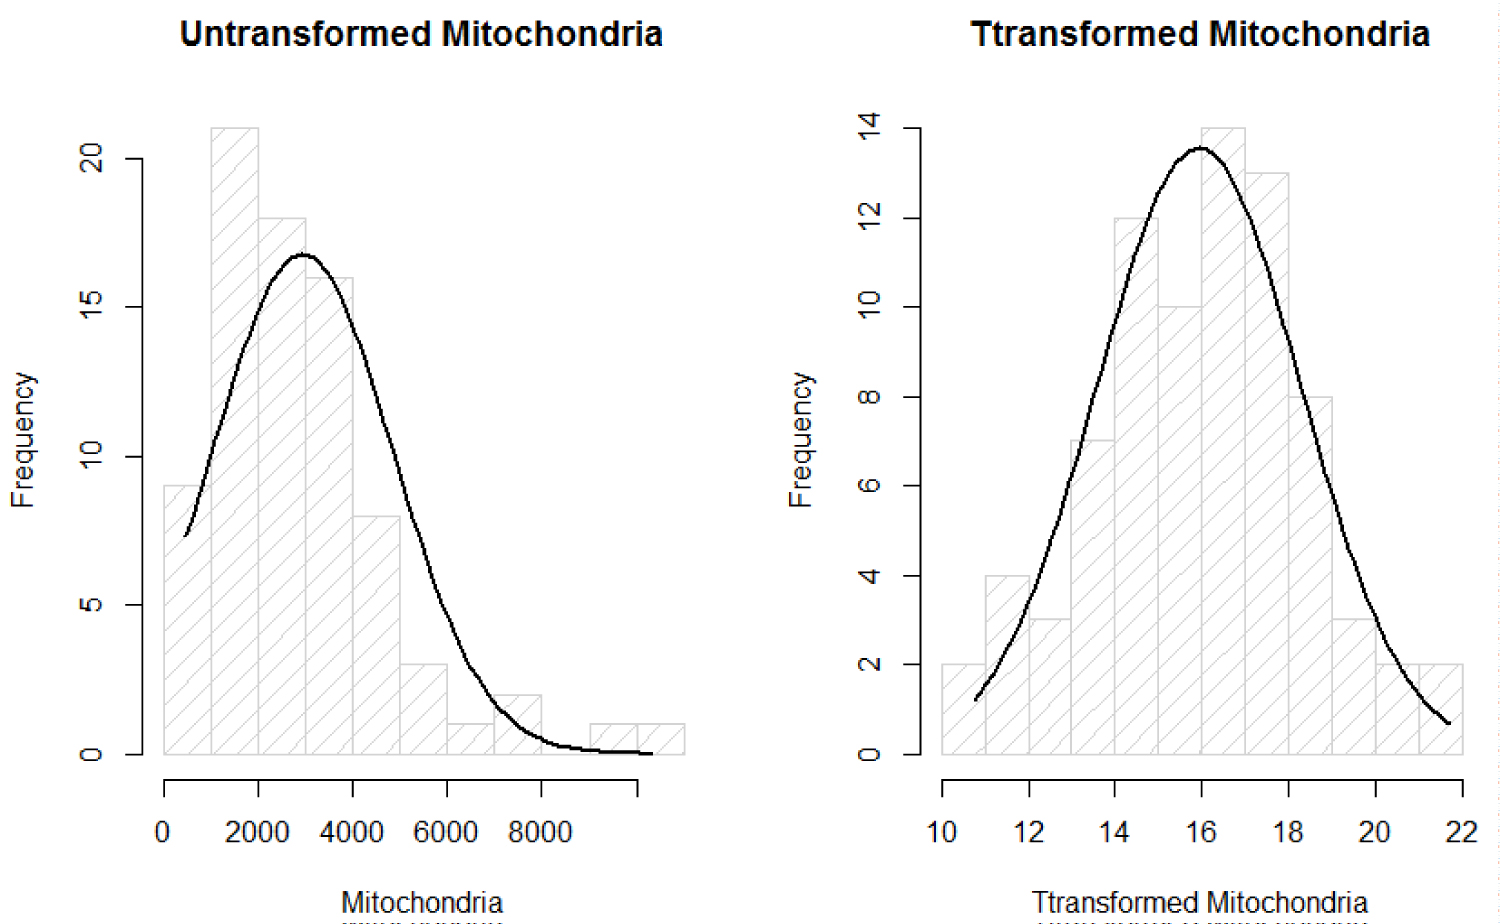 Figure 1: Normality plots of mitochondria.
View Figure 1
Figure 1: Normality plots of mitochondria.
View Figure 1
The new variables are given as:
Where λ is estimated using MLE method that is of value 0.164576. Now, that the assumption of normality of the response Z after transformation denoted as Y, has met normality, we fit linear regression and ANOVA without violated the important normality assumption of the data.
For all patients, the box plots show that there is a huge variation among the oxygen users from their smoking status. As the effect of smoking as a risk factor or indicator in IPF is under debate, for the purpose of this investigation, we assumed that former smokers have greater severity in the MtDCN markers than non-smokers (Figure 2).
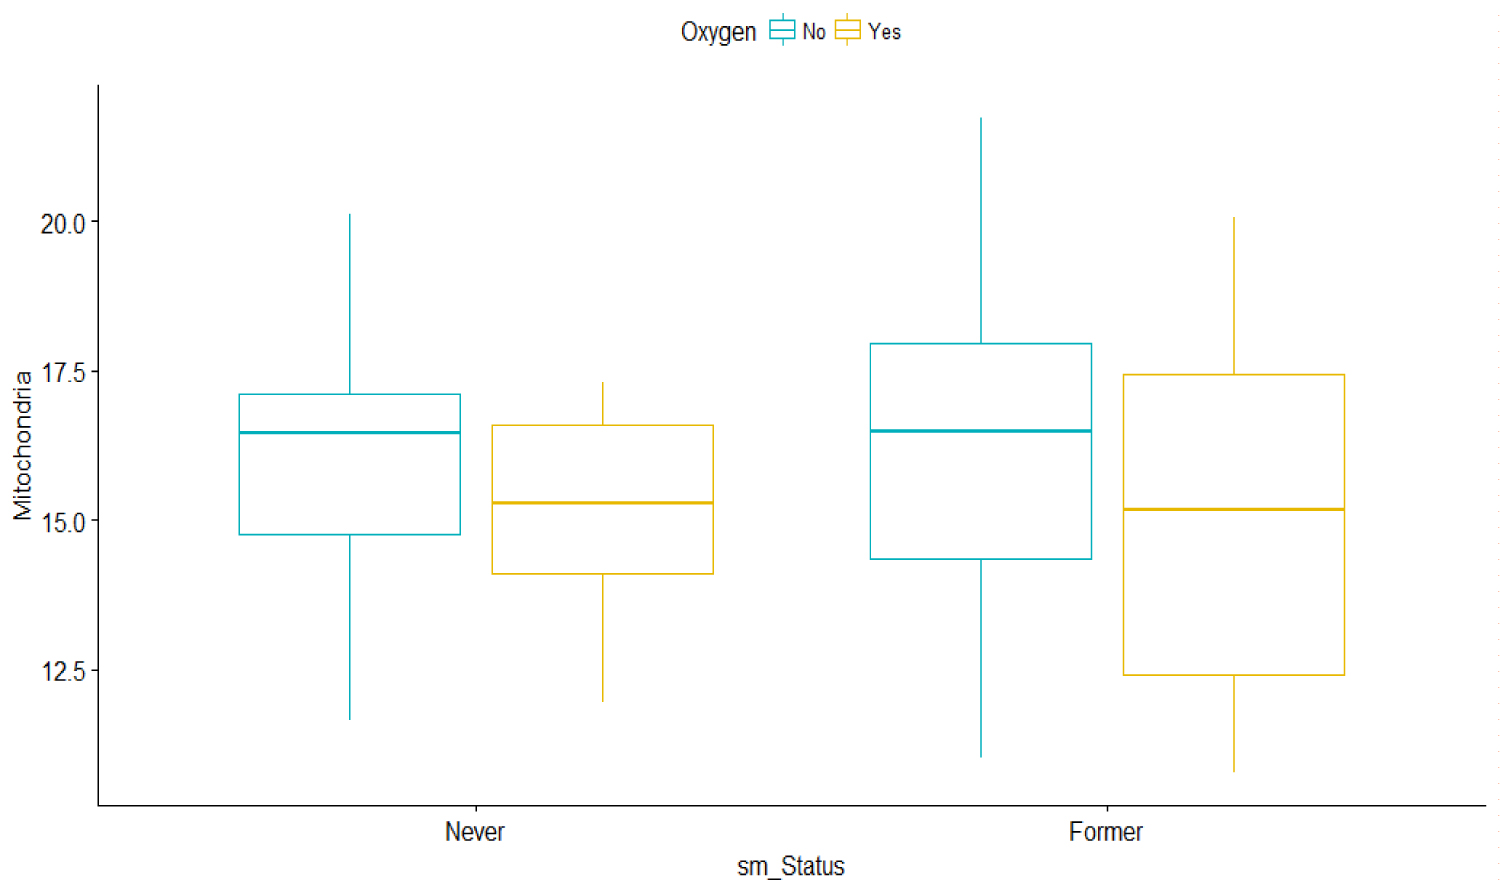 Figure 2: Bar graphs of Mitochondria vs. Smoking status and oxygen use.
View Figure 2
Figure 2: Bar graphs of Mitochondria vs. Smoking status and oxygen use.
View Figure 2
To have a better understanding of the estimates of the variances, and use the answers to guide better inferential questions, a table of analysis of variance formally called ANOVA is presented to summarize the data at first.
One-way ANOVA test (F-test) of Y (MtDCN) based on whether the subject is sick or not, we find the following:
model is: Yij = μ + τi + eij'
where μ is the overall mean of Y1,
τi is the effect of group and
eij is the error term for each observation
with i = 0 or 1 and j = 1,2,... , 36 for normal subject = 0
and j = 1,2..., 30 for IPF patient = 1.
The outputs of the ANOVA table are given in Table 2. It shows that the two groups of study participants IPF (IPF patients and normal subjects) are significantly different, with a p-value of 0.0155.
Table 2: Analysis of variance table for Mitochondria vs. IPF patient groups. View Table 2
The mean sum of square errors that accounts for the variance that is unexplained after accounting for the linear effect of the patients' group is of 5.83. The Table 2 result shows that the test distinguishes between the IPF disease and non-disease individuals and that the subject status of whether being sick or not is significant with p-value of the ANOVA equals 0.0155. This shows that there is significant difference between the two groups of IPF patients and normal subjects/participants. The means for each group turns out to be = 16.57038 and = 15.10032 are the means of MtDCN for normal and IPF patients, respectively. However, it is not clear that the biomarker variables will guide in the prediction of the disease status.
A formal straight line is then considered under the linear regression models of MtDCN against the predictors available for both normal and IPF groups. We found the following:
where Y is the transformed MtDCN, and X1 is the 6MW (m) predictor. The estimates are reported in Table 3. The results indicate that the 6MW significantly affects MtDCN.
Table 3: Regression line of Mt DNCN vs. 6MW. View Table 3
Since the two groups of participants (IPF patients and normal subjects are significantly different), we propose to compute their individual linear regression models. The outputs of the models are described in Table 4.
Table 4: Individual linear regression models of MtDNC and IFP patient groups. View Table 4
Here the dependent variable w6MW_d1 is more desirable in predicting the MtDCN for normal subjects than for IPF patients. Note that the variance for the w6MW_d1 is quite high for normal patients.
This is to point out that the reasonable accuracy from knowledge can lead to suspicious disturbance in the quest for model procedure, strategy and simplicity.
Another added variable DLCO may add better fit to the MtDCN response variable. It is tested next.
where Y is the transformed MtDCN, and X2 is the DCLO predictor.
As it turns out, the estimated variance of the model has decreased, while model significance has been maintained (Table 5).
Table 5: Estimates parameters of simple regression of Mt DCN vs. DLCO. View Table 5
As earlier, a break down by participants is also suggested, and the results are described in Table 6. Surprisingly, the results indicate that the DLCO variable does not significantly affect MtDCN within each of the grouping. Also, other variables were not significant. This shows the complexity behind modelling such data phenomena, and a simple model may not be accurately describing the patients' information. We will consider more extensive modelling techniques.
Table 6: Individual linear regression models of Mt DCN and DLCO based on IFP patient groups. View Table 6
Since we are interested in MtDCN, and since systematic difference is neither obvious nor predictive, multiple linear model approach may help address discrepancies and variable selection.
We start the analysis of Y (transformed MtDCN) being regressed on the full set of explanatory variables. Under stepwise regression method, the following variables were selected, and they are described by this model:
where X1 is the dp_12 e.g. delta FVC% at the 12th month,
X2 is dp_3 e.g. delta FVC% at is the at the 3rd month,
X3 is the sm_status
X4 is the DLC
The output is displayed in the Table 7. Note that DLCO is not significant with p-value of 0.1822. Other statistics that are used as measures of goodness of fit are usually = 6.75 and AIC = 153.7.
Table 7: Multiple linear regression of Mt DCN vs selected predictors'outputs. View Table 7
The multiple linear model seems reasonable. However, as most patients do not continue smoking after disease diagnosis, it seems reasonable to consider smoking i.e. sm_status as a weight instead of a variable itself. Looking at an ANOVA test (t-test) of Y1 based on smoking, we find the following:
model is: Yij = μ + τi + eij'
where μ is the overall mean of Y1,
where μ is the overall mean of Y1,
eij is the error term for each observation
with i = 2 or 3 and j = 1,2,..., 11 for never smoker = 2
and j = 1,2,..., 14 for former smoker = 3.
The outputs of the ANOVA test are displayed in Table 8.
Table 8: Analysis of variance table for Mitochondria vs. smoking status. View Table 8
The Table 7 result showed that the sm_status is not significant with p-value of the ANOVA equals 0.0649, and is confirmed in Table 8. This evidences that there is no significant difference between the two levels of sm_status. The means for each group turns out to be = 3.89 and = 3.98 are the means of MtDCN for sm_status = 2 and sm_status = 3, respectively.
The plots in Figure 3 show the linear relationship between the response Y1 and each one of the predictors to further understand the difference between the two smoking groups based on oxygen usage. It also shows that MtDCN is higher among oxygen users than among non-oxygen users for patients who never smoke. However, the MtDCN for oxygen users is lower for former smokers than for non-oxygen users. The problem is that a patient assigned to oxygen would be quite random, counterfactual sometimes. To determine causal effects for these patients is counterproductive, as the prediction is purely observational. Rather, we will try to capture indirect effects.
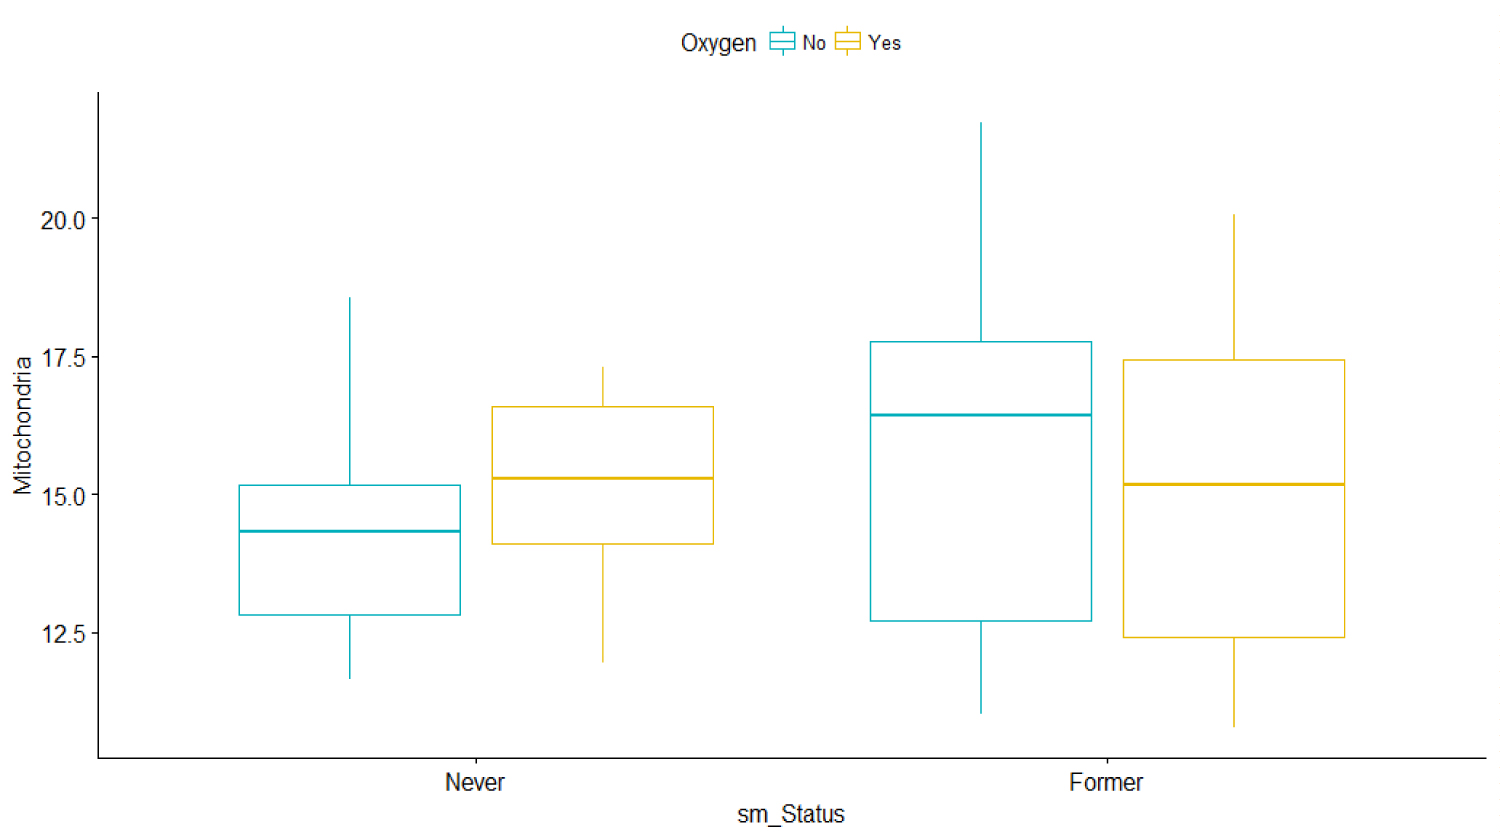 Figure 3: Bar graphs of Mitochondria vs. Smoking status and oxygen use for IPF patients only.
View Figure 3
Figure 3: Bar graphs of Mitochondria vs. Smoking status and oxygen use for IPF patients only.
View Figure 3
We then consider different predictors and try to understand their impacts. The effects of dp_12 and dp_3 on MtDCN are displayed in the next graphs, while keeping the smoking status in mind. It is observable that MtDCN values of non-smokers seem to be enclosed within the MtDCN values of former smokers when estimated with dp_3 and dp_12. This fact will be review as a doughnut or torus case in the later section, as it reveals a circular concentration. In the meantime, we explore further and add more predictors at hand. Dropping DLCO, we get the following model
where X1 is the dp_12 e.g. delta FVC% at the 12th month and
X2 dp_3 e.g. delta FVC% at is the at the 3rd month.
The output of the model is displayed in Table 9.
Table 9: Multiple linear regression of Mt DCN vs. dp_12 and dp 3' outputs. View Table 9
From plots in Figure 4, we can see that the never smoker group is surrounded by the former smoker group. In fact, when we model each group separately we get different results in term of significance.
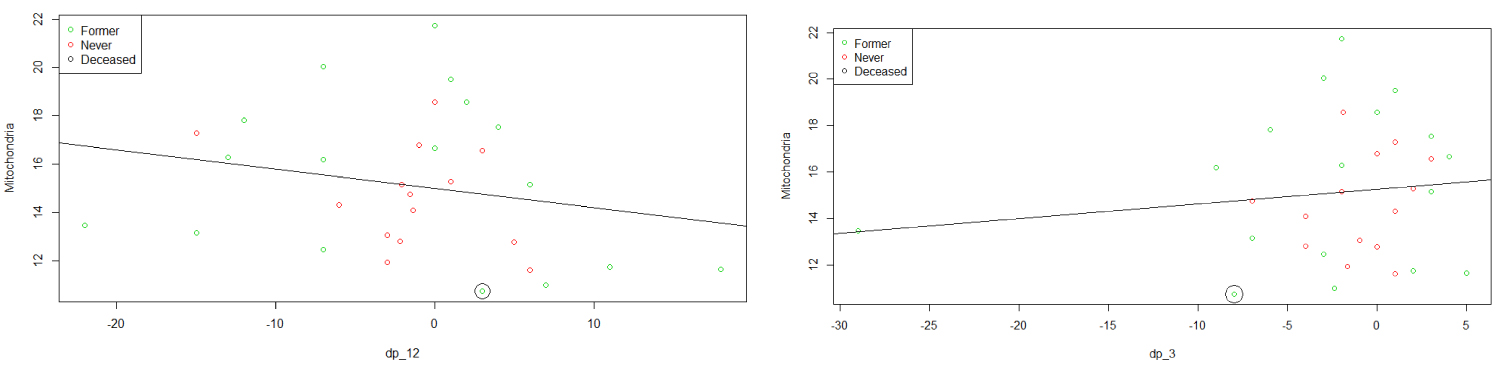 Figure 4: Plots of MtDCN vs. dp_12 and dp_3.
View Figure 4
Figure 4: Plots of MtDCN vs. dp_12 and dp_3.
View Figure 4
Similarly, we consider the variable oxygen, which takes the value 1 if a patient takes oxygen, and 0 otherwise. Although including the variable oxygen in the model does not lead to a good model, dividing the data into two groups based on the oxygen status shows that predictors dp12 and dp3 significantly affect MtDCN among those who take oxygen, which is not true with those who do not take it. The model indicates that there are other confounding factors besides oxygen and the dp_3 and dp_12.
Finally, we fit the model for each group based on antifibrotic status (Pirfenidone and Nintenadib). The results are shown in Table 10. The model shows a significant effect of dp_12 on the MtDCN for Pirfenidone. However, the model does not dissuade from adding the dp_3, and the idea that there are disturbances and variational errors within the patients, and thus further analysis should be considered.
Table 10: Individual linear regression models of Mt DCN and DLCO based on selected predictors. View Table 10
Plot in Figure 5 allows to assess how well the fitted multiple regression model describes the IPF prediction based on smoking and also based on oxygen use. Although the predictive model is capturing the MtDCN, the classification is not at all clear. Hence, we use the techniques of boosting and Bayesian models.
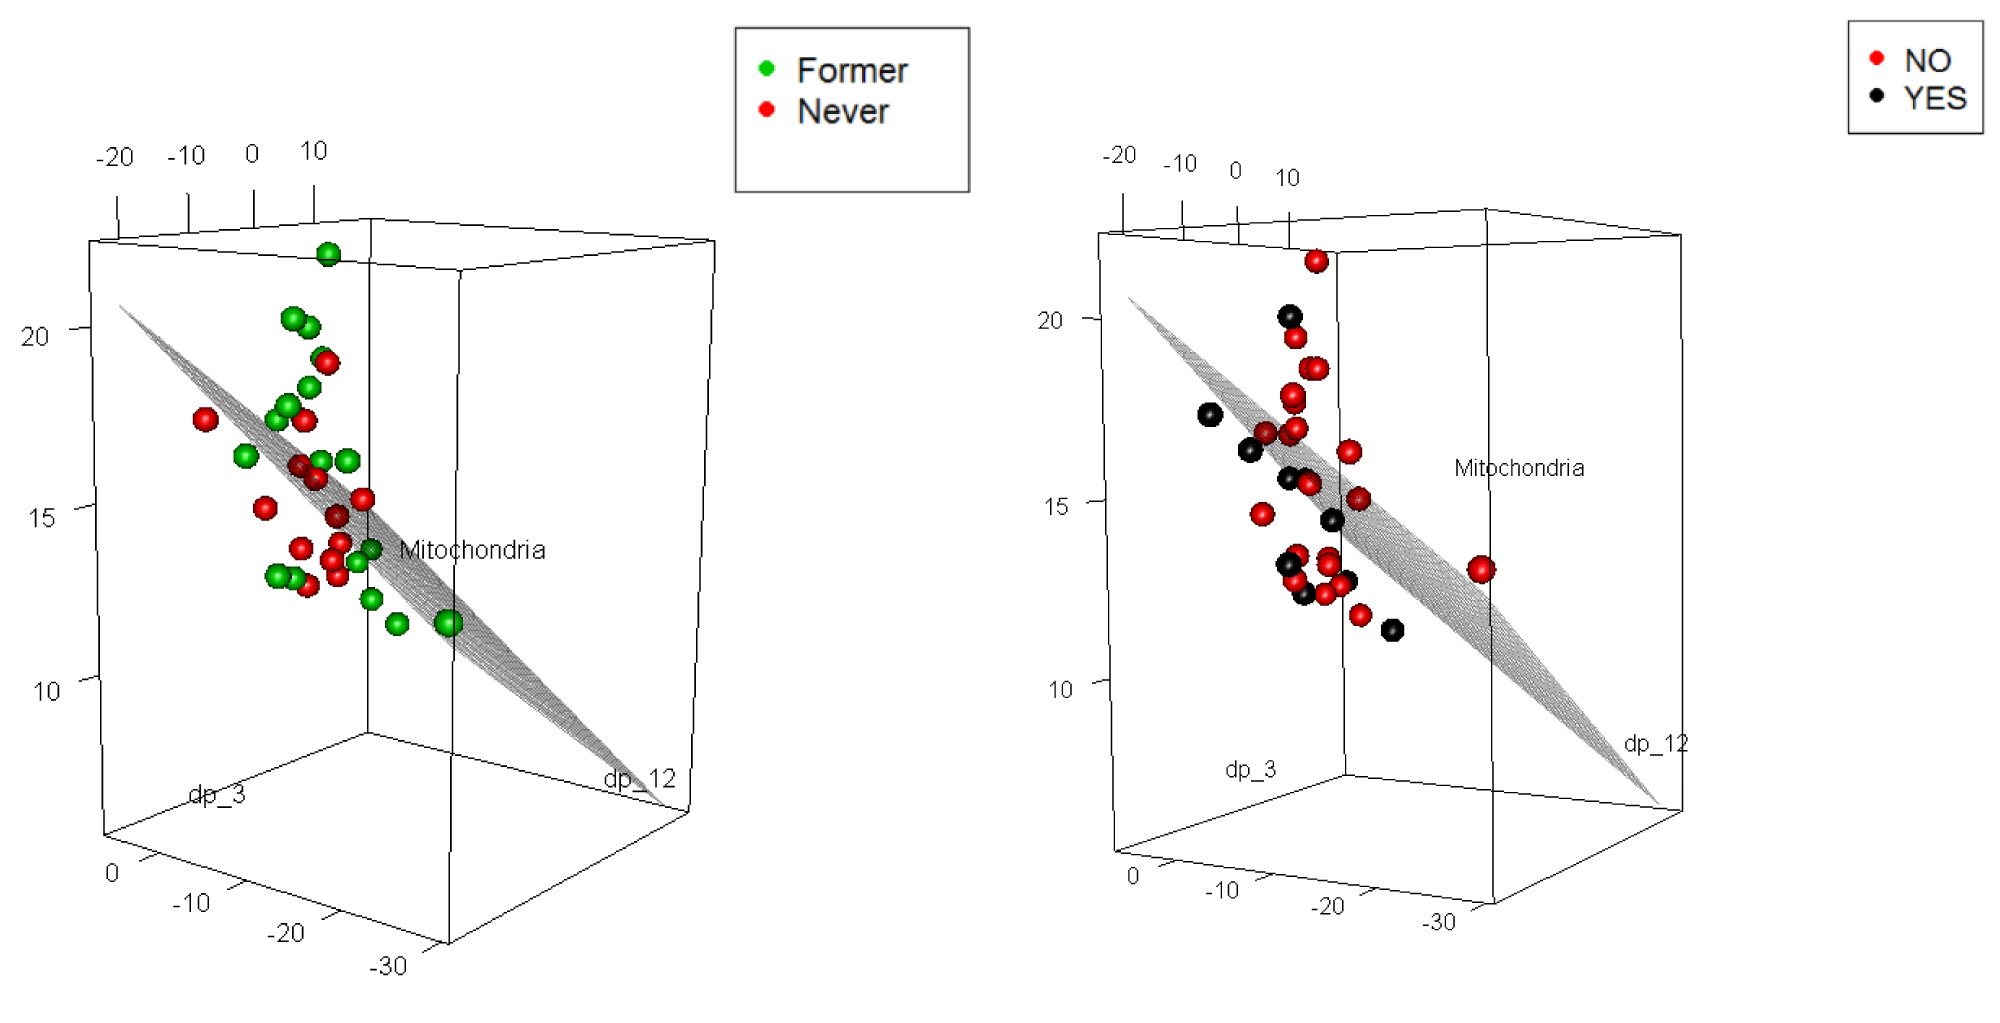 Figure 5: 3d plots of MtDCN with smoking (2 levels, but one patient was deceased) and oxygen use (2 levels).
View Figure 5
Figure 5: 3d plots of MtDCN with smoking (2 levels, but one patient was deceased) and oxygen use (2 levels).
View Figure 5
Parameter estimations comparison between standard GLM and GLM-based boosting before and after estimating the missing values using multiple imputations under Bayesian bootstrap (BB):
Consider the linear model
where Y1 is the transformed value of MtDCN,
X1 is the dp_12 e.g. delta FVC% at the 12th month and
X2 dp_3 e.g. delta FVC% at is the at the 3rd month.
Before handling the missing data, the parameter estimates are given in Table 11.
Table 11: Estimates from two models. View Table 11
After handling the missing data using multiple imputations under Bayesian bootstrap, the parameter estimates are provided in Table 12.
Table 12: Estimates from two models with imputed data. View Table 12
From the results, the estimates from the GLM based with missing data boosting algorithm are close to the estimates from the standard GLM, hence showing that our method is robust.
To obtain and challenge the formulation above and have a reduced form equation of the variables, we consider the Bayesian hierarchical regression model, from the conditional indirect effects. The GLM used is extended to include a Bayesian setting. We start by classifying the patients into groups determined by their MtDCN levels. Then, we build predictive model by asking if the patients can be classified as sick or very sick based on their dp_3 and dp_12, adding MtDCN levels, Bayesian.
Several works have proposed strategies for computations of under optimal designs [13,14], and stopping criteria in a missing data context. Examples are presented in both [15,16], Such technique will be applied to the features tracking and classification. That is, we will represent MtDCN by an indicator variable associated with DLCO that significantly affects the MtDCN values of both IFB and normal subjects.
Although we transformed the response variable (i.e. MtDCN) to satisfy the normality assumption of the linear model, the assumption is not quite satisfied (refer to the Q-Q plots). Thus, another technique in modeling the IFP of both patient and normal participants is considered to model MtDCN indirectly to avoid strong distributional assumption. Analysis on the threshold of the biomarkers is further performed on the IPF patients. The idea behind introducing an indicator, which classify the subjects into two groups, as it appears that a removal of DLCO as an effect on the MtDCN, may lead to overfitting, or confounding due to dp_12 or dp_3.
This indicator we defined here is as follow:
The idea behind introducing this indicator, which classify the subjects into two groups, comes from the following plots where we can see when we plot MtDCN against DLCO, we can easily distinguish between the two groups of subjects. It appears that a decreased level of DLCO has an effect on the MtDCN.
Now we will fit a Bayesian Hierarchical logistic model with Z as a response and MtDCN and DLCO or 6mw as predictors. The model is given by
Pr (Zi = 1) = logit-1 ( + αj), i = 1,...,80, j = 1,2
where ~
β ~ N (0, β).
For the first model, X = (1, x1 = Mitochondria, x2 = 6MW)
The model expression in such that whether or not the participant has an overexpressed level of DLCO with covariates as MtDCN and 6mw. The model expression including the random component is useful as the clinical course among patients is unpredictable and with high variability (Table 13).
Table 13: Estimates of model classification parameters based on Mt DCN and DLCO. View Table 13
Classification table of the predicted normal and IFB patients versus the true one is provided in Table 14.
Table 14: Classification outcomes. View Table 14
The classification, count and misclassification based on the Hierarchical Bayesian logistic regression analysis of the w6MW_d1 and DLCO with added random component of smoking status is shown in Table 14, and matches the results from Figure 6. It shows a high proportion of correct classification, with four subjects that are classified as patients when in fact they are supposed to be normal patients. The low level of DLCO significantly depict IPF patients, and therefore alter the lung functions.
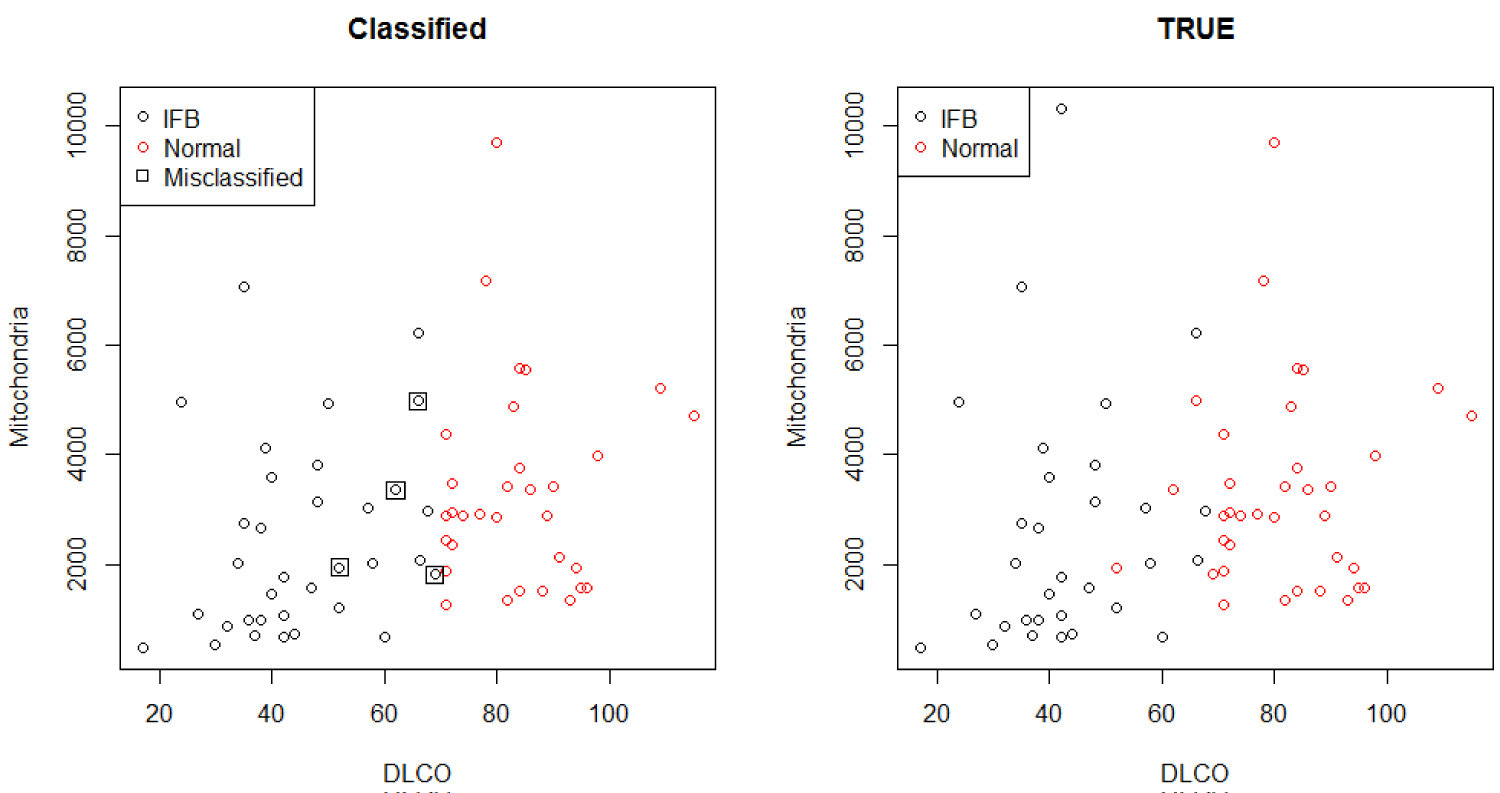 Figure 6: Classification comparison.
View Figure 6
Figure 6: Classification comparison.
View Figure 6
The statistical models describe the useful first steps in making inferences about the data. While characterization of the IPF with most associated explanatory variables is best done in a designed study, the variables selected, even if non-significant at first, were now to be included in the suitable model. Overfitting may be a concern, mainly because of the sample size, although Bayesian method here can be considered as a comparative justifiable model [17,18].
Although the methods are complementary, this research has shown that the MtDCN level is linked to the oxygen, smoking, and the Forced Vital Capacity and forced Expiratory Volume. Moreover, we have proposed a risk cohort model for patients with IPF. The model enables the practitioner to monitor the patients according to key characteristics such as the oxygen use and smoking status, and assess the evolution of the patients. We have proposed critical thresholds that may reflect disease severity/progression, and determine the clinical pathway of IPF with the diffusing Capacity of the lung for Carbone Dioxide (DLCO) and the MtDCN levels, under multiple regression and under Bayesian hierarchical models. In our predictive model that have suggested high predictive accuracy, surveillance can be raised when the patients' DLCO or MtDCN level reach a certain level. These findings show that the factors such as the six minute Walk Test (w6MW_d1), DLCO and smoking status are valuable indicators in predicting IPF progression, and without ignoring the FVC% at the 3rd and 12th months. All these predictors define a clinical subset of patients with and without IPF whose information can be used to tailor most appropriate surveillance cohort and medical treatments. We propose that any newly created medicine or treatments and their combinations should be developed while accounting for the influence of these factors. We have shown the statistical strength that can guide practitioners in the counselling and management of these patients.
Our study has some limitations as the number of patients is relatively small and our results should be validated in a larger independent population of IPF patients. Nonetheless, the development of our statistical models present a framework for how to incorporate factors that might influence the course and outcome of patients with this deadly, yet unpredictable disease.
Financial support was provided by the Virginia 4VA grant at George Mason University and Old Dominion University, the Statistics in the Biomedical Acceleration of Idiopathic Pulmonary Fibrosis Research, and the Division of Intramural Research of the National Heart, Lung, and Blood Institute. We are grateful to all the participants and staff at both Inova Fairfax Hospital and the National Heart, Lung, and Blood Institute, and the National Institute of Health.