The optimal method to correct the QT interval, an important indication of arrhythmia risk, for the impact of heart rate has been controversial. The fundamental biologic relationship of the QT interval-heart rate relationship has rarely been studied across different species.
The literature on the QT and heart rate of 32 different species was examined specifically in the whales, dolphins, Asian elephants, rhinoceros, camels, brown bears, grizzly bear, lions, tigers, sea lions, seals, donkeys, ponies, horses, cows, sheep, goats, llamas & alpacas, swine, Minipigs, deer, dogs, cats, baboons, apes, monkeys, prairie dogs, marmot, rabbit, hamsters, guinea pigs and mice.
An inverse relationship between QT interval and heart rate was apparent across species. The relationship was poorly fit by a linear formula. The Bazett approach (square root of heart rate or RR interval) or the Fridericia approach (cubed root of the heart rate or RR interval) produced slight improvements. Second, third and fourth order polynomials produced a progressive greater improvement in the goodness of the fit of the relationship. The best fit of the relationship was attained by a nonlinear two-phase relationship identifying that there is one QT-heart rate relationship at slower heart rates and one at faster heart rates.
The Bazett, Fridericia and linear formulae approaches to QT interval correction for the impact of heart are far from ideal. Nonlinear QT correction approaches are better approaches to correct the QT interval for heart rate.
QT interval, Heart rate, Animal species
The QT interval is an important index in assessing cardiac drug toxicity, electrolyte abnormalities and inherited channelopathies which can be associated with fatal arrhythmias [1-5]. A key issue in the utilization of the QT interval, is the need to appropriately adjust or correct for the impact of heart rate on the QT interval. Many formulae have been proposed to correct for the impact of heart rate on the QT interval so that the underlying QT interval can be assessed (for a review see [6]). The approach of Bazett, that the impact of heart rate can be corrected by dividing the QT interval by the square root of heart rate [7] and the approach of Fridericia that the QT interval needs to be divided by the cubed root of the heart rate (RR interval) [8], are still in use today. Mathematical equation - linear, exponential, cubic etc. have been applied to ECGs from patients and large populations in an attempt to adjust for the effect of heart rate on the QT interval [6]. Testing for the validity of approaches to adjust or correct for the impact of heart rate on the QT interval has been conducted within or between individuals and mainly in humans. There is a paucity of data that attempts to examine the fundamental nature of the QT-heart rate relationship across a large number of animal species. Cross species data would permit an exploration of the fundamental biologic relationship and should provide novel insights into heart rate-QT interval dependence. The objective of this study was to examine the QT-heart rate relationship across a variety of mammalian species in order to define the specific nature of this relationship.
A literature search was conducted using the terms electrocardiogram or electrocardiographic AND normal AND Animals. Birds or avian species were excluded. When there were few or no publications, the search was repeated by replacing animals with a pre-specified animal species. The objective was to obtain a cross section of animals and not to obtain a list of all publications on the ECGs of a given animal species. ECG monitoring done as part of an experiment or intervention protocol were excluded if there were more than two other articles in the species. Articles that were not in English or did not have English translations were not included.
Studies were excluded if data on the actual QT measurement were not presented or if it could not be readily calculated from QT interval corrected for heart rate i.e. the actual formula for calculation was not provided to permit calculation of the uncorrected QT interval; for example if QT was said to be corrected by the Bazett formula and the original paper was cited [7]. In the original paper by Bazett [7], a different constant was included for men and women so that it could not be known whether the investigator used the constant for male and female animals.
The QT-heart rate relationship was examined by several models considering linear or polynomial relationships. Log transformation and a nonlinear fit of the data were also applied. The least squares estimate of the relationship was calculated and the correlation (r2) was reported.
Data on thirty-two species of animals represents a wide spectrum of animals (Table 1). ECG data are inclusive of animals that spend most or a considerable amount of their life in water such as whales [9], dolphins [10,11], sea lions [12] and seals [13]. They include wild animals such as brown bears from either a sanctuary or caught in the wild [14,15], lions and tigers [16,17]. They include large animals such as Asian elephant [18-21] and small animals such as guinea pigs [22,23]. Some animals are not readily available for study such as rhinoceros [24] and grizzly bears [25] because of the difficulty in capturing them for study.
Table 1: It shows the types of species and whether they were anesthetized and/or the type of anaesthetic used. View Table 1
Domesticated animals have been studied in larger numbers and include cows (N = 1247) [26-28], donkeys (N = 240) [29,30], goats (N = 344) [28,31], camels (N = 146) [32,33], llamas and alpacas (N = 156) [34-36] and cats [37-39]. Various kinds of horses (N = 918) have had an ECG including Andalusian, thoroughbreds and standard horses [40,41] as well as ponies [42]. Dogs were analyzed by separating the species into beagles and other dogs [43-45] because of the very large number of beagles (N = 2,901) that had ECGs [46-49]. There were a number of different species of monkeys but because each group was of similar size they were combined [50-55]. Baboon were studied in primate colonies so relatively large numbers were available [56-58].
The sample size for each species varied widely. The ECG of the whale illustrates that in some circumstances, there are animals that are difficult to obtain. To exclude animals because only one animal was studied would eliminate one of the rare times that the species was examined with an electrocardiogram [9,24]. On the other hand, the ECG of a single polar bear was excluded because there were sufficient number of ECGs of other bears [9,14].
The QT intervals of younger and older guinea pigs conducted by Shintani, et al. were combined [22] to make it consistent with most of the studies that did not consider age in QT calculations.
The health status of some of the animals was reported. When studied in colonies or in laboratory settings, it was most likely accurate, when the animals were reported as being healthy. Most studies did not report on the health status of the animals and the animals were assumed to be healthy. The single whale, studied by Senft and Kanwisher, was a beached whale that died 7 hours after the ECG was taken so its health status at the time of the ECG could be questioned [9]. However, it may have been in an acceptable condition at the time the ECG was recorded.
The surroundings and conditions for the ECG may have impacted the heart rate. Some studies were conducted with anaesthetized animals because anesthesia was obviously necessary when dealing with animals such as wild bears, lions, and tigers. Different anaesthetics were used; making it difficult to compare or isolate the effect of anesthesia. Animals that were not anesthetized were restrained. For some animals, restraint may not have been a major inconvenience as they were likely well acquainted with the handler but other animals may have had faster heart rates when restrained.
The ECG studies on dolphins included wild dolphins that were recently captured and had a higher heart rate than the other group of dolphins that had been trained and exposed to humans for a long time [10,11]. However, other factors may have influenced the slight differences in heart rate between these animals.
It is readily apparent that there is an inverse relationship between QT interval and heart rate (Figure 1). The shortest QT intervals and fastest heart rates was seen in mice, guinea pigs and hamsters. The longest QT was found in whales, rhinoceros and elephants that had slower heart rates. A linear relationship, between QT and heart rate was significant but it did not represent a good description of the relationship with many values above and below the calculated linear fit and with an r2 value of 0.454 (Figure 2a). The Bazett approach of using the square root of the heart rate or RR interval [7] only slightly improved the fit (r2 = 0.609). Similarly the Fridericia approach of using the cube root of the RR interval or heart rate [59] slightly improved the correlation (r2 = 0.649). The nonlinearity of the relationship remained evident. The relationship was better fit with a second order polynomial (r2 = 0.689) (Figure 2b), third order polynomial (r2 = 0.783) (Figure 2c) and a 4th order polynomial (r2 = 0.832) (Figure 2d).
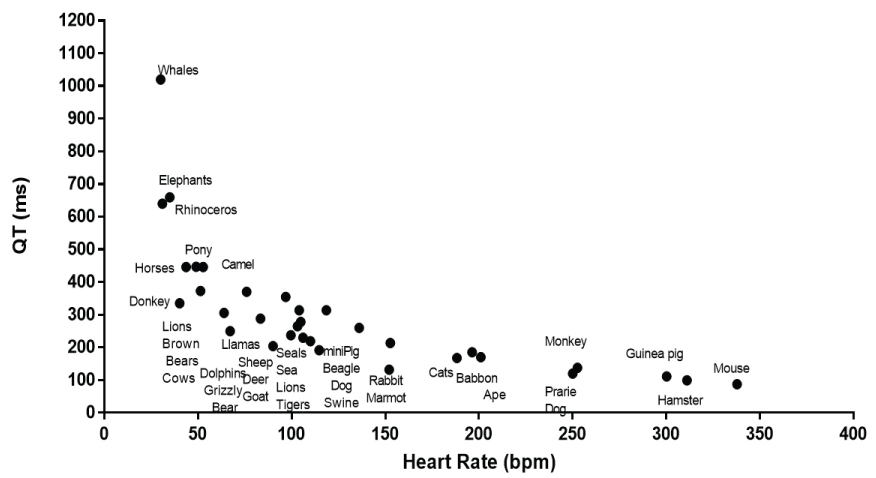 Figure 1: It shows the mean heart rate and QT interval for the species examined. The different species included are listed in close proximity to their QT and heart rate data.
View Figure 1
Figure 1: It shows the mean heart rate and QT interval for the species examined. The different species included are listed in close proximity to their QT and heart rate data.
View Figure 1
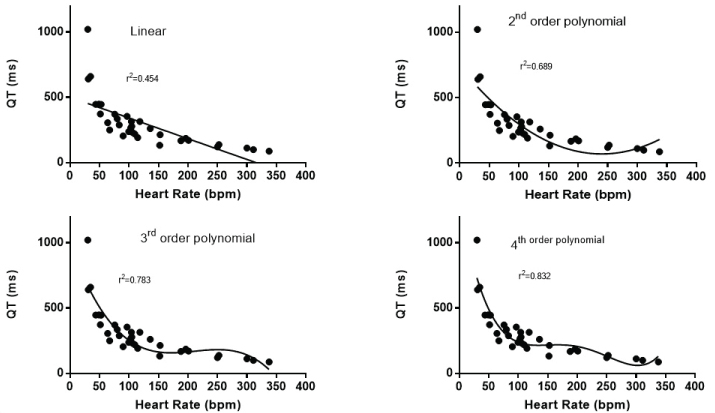 Figure 2: a) It shows the best fit of a linear relationship between heart rate and QT interval; b) It shows the best fit of a second order polynomial relationship between heart rate and QT interval; c) It shows the best fit of a third order polynomial relationship between heart rate and QT interval; d) It shows the best fit of a fourth order polynomial relationship between heart rate and QT interval.
View Figure 2
Figure 2: a) It shows the best fit of a linear relationship between heart rate and QT interval; b) It shows the best fit of a second order polynomial relationship between heart rate and QT interval; c) It shows the best fit of a third order polynomial relationship between heart rate and QT interval; d) It shows the best fit of a fourth order polynomial relationship between heart rate and QT interval.
View Figure 2
However, it is not until nonlinearity was examined did the relationship truly improve. The log transformation of both the QT interval and heart rate produced an r2 of 0.868 (Figure 3). A true nonlinear two phase (decay) equation fit the data best with an r2 = 0.909 (Figure 4). Because the Whale had the longest QT, the data were reanalyzed excluding the whale. The nonlinear goodness of fit was minimally altered with the removal of this species (r2 = 0.905).
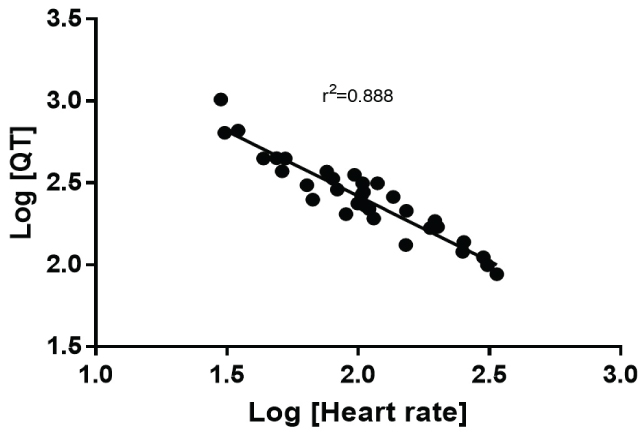 Figure 3: It shows the relationship between heart rate and QT interval after both are subject to log transformation.
View Figure 3
Figure 3: It shows the relationship between heart rate and QT interval after both are subject to log transformation.
View Figure 3
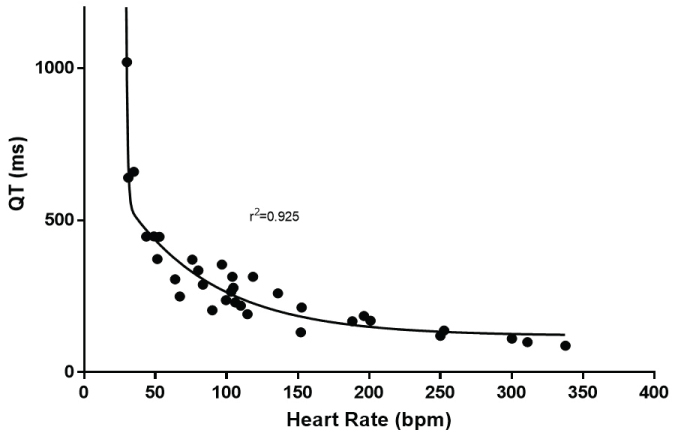 Figure 4: Shows the best fit of a nonlinear fit of the relationship between heart rate and QT interval.
View Figure 4
Figure 4: Shows the best fit of a nonlinear fit of the relationship between heart rate and QT interval.
View Figure 4
This cross species examination of heart rate-QT interval data not only validates within species conclusions, that there is an inverse relationship between heart rate and QT interval but most importantly demonstrates that the relationship is not well described by either a linear model or the Bazett or Fridericia adjustment approaches. Higher order polynomial formulae improve the fit of the QT-heart rate relationship. Nonlinear models, however, are the best approach to describe (fit) the relationship between the QT interval and heart rate.
While recognizing the relationship between QT interval and heart rate, some investigators contend that the QT interval is regulated by mechanisms separate from those that govern heart rate so that QT interval and heart rate are influenced not only by heart rate but also by other factors including sympathetic neurones that are activated differently depending on the adaptation required [60-62]. Restating this proposal is that the effects of the sympathetic nervous system are not limited only to the effect of the autonomic system on heart rate. Tests of this concept, however, have relied on changing heart rate in an individual using interventions such as exercise or pacing [60-62] that still show a linkage between QT and heart rate [63,64]. The present study permits a different kind of examination of the QT-heart rate relationship by permitting an evaluation of the intrinsic heart rate differences in different animal species. The inverse relationship of QT interval and heart rate was obvious and can be illustrate in three species. In the Asian elephant, the QT interval was 660 ms at a heart rate of 35 bpm, QT interval of 191 ms at a heart rate of 115 bpm was found in the beagle dog, while the QT interval of 111 msec at a heart rate of 300 bpm was found in the guinea pig. These data reinforce the concept that heart rate has a powerful effect on QT interval.
This study has important implications for cardiologic assessment in humans. The Bazett [7] and the Fridericia formulae [8] for heart rate correction of the QT interval are in wide spread usage in clinical medicine. This study found that both formulae were inadequate to describe the QT-heart rate relationship across species. Support for these findings can be found in other reports [65,66]. Linear models have been advanced to better describe the QT-heart rate relationship [67,68]. A linear model did not fit the cross-sectional animal data. While polynomial models were better, they were not optimal. A true nonlinear two phase (decay) equation fit the data best). These data suggest that slow heart rates need one adjustment for heart rate and faster heart rates require another adjustment. This finding supports the use of a spline function which can adjust for the slow and fast heart rates differently [66].
Voltage-gated potassium currents/channels underlie ventricular repolarization and thereby influence the QT interval. Transient outward K currents (Ito) with fast inactivation (Ito,f) have been identified in cat, dog, ferret, human, mouse and rat ventricle while those with slow inactivation (Ito,s) have been characterized in ferret, human, mouse rabbit and rat ventricle [69]. Delayed rectifier K+ currents (IK) have multiple components that have been characterized in ventricular myocytes isolated from dog, cat guinea pig, human, rabbit and mouse [69]. Amongst the prominent components of IK, IKr (IK,rapid) has been characterized in cat, dog, guinea-pig, human, mouse, rabbit and rat ventricle with IKs (IK,slow) having been characterized in dog, guinea-pig and human ventricle [69]. Differences in repolarization between mammals evolves through changes in the amount expression of the relevant ion channels [70]. Differences in the magnitude of the outward potassium current between species has been proposed to explain differences in assessing the interval between the QRS complex and T wave in mice and rats compared to guinea pigs [71]. The pore-forming subunit of the rapid component of the delayed rectifier K channel, Kv11.1 [72], has similar electrophysiological gating properties in the horse compared to human (KV11.1 channels) [73]. This channel protein is encoded by ERG (Ether-a-go-go-Related Gene) which has the gene name KCNH2 [72]. There are multiple forms of ERG [72,74]. Ventricular IKr channels heteromers, ERG-1a and -1b, are expressed in rat, canine, and human heart [74]. In summary there are considerable similarities between mammalian species in the underlying mechanisms responsible for repolarization which dictates the duration of the QT interval.
There are a number of potential limitations of this study that warrant discussion. First, there is considerable heterogeneity in the circumstances surrounding ECG measurement as mentioned previously. Some animals were anesthetized while other were not. The nature of the anesthetic varied between studies so that comparisons of anesthetized and unanesthetized animals was not possible. The need to anesthetize some animals, such as grizzly bears or tigers is obvious; otherwise the 12 lead ECG could not be taken. Unanesthetized animals were either restrained or placed in a confined environment. Totally domesticated animals required minimal restrains while others required more restraint. Second, details of the method of QT interval measurement varied widely between publications so that the quality of the measurements could not be assessed. Third, the accuracy of the QT interval measurement likely varied, as it is much easier for it to be measured at slower rather than faster heart rates and there are a number of species that have fast resting heart rates. Fourth, the electrophysiological properties of the heart may vary between species and may be a factor influencing the QT interval independent of heart rate. Cattle and other ruminant have a different distribution of the Purkinje network penetrating the ventricular walls [75,76]. Depolarization, which utilizes the Purkinje network, however, is a different process from repolarization and is independent of the Purkinje network. Fifth, there were inconsistency in the reporting of animal age or sex so that it was not possible to analyze age or sex differences in the QT interval across species utilizing the data set. Sixth, the possibility exists that the nonlinearity evident at slow heart rates might be due to the few animals with slow heart rates. This was likely not the case. Reanalysis after the whale was removed did not materially affect the underlying relationships. Furthermore, there were a large number of other animals with slow heart rates. Lastly, clinical cardiology is focused on the human condition and the extent to which animal data can be extrapolated to the human condition is always a concern. However, the wide range of animal species examined in this study contributes to the basic understanding of the heart rate-QT interval relationship.
In conclusion, this study provides a unique assembly of data across thirty-two different species to examine the QT-heart rate relationship. The data are clearly nonlinear and indicate that the linear approach or the approaches of Bazett or Fridericia are not ideal but rather a nonlinear approach is best to correct or adjust the QT interval for the effect of heart rate. The data support the new spline equation to adjust the QT interval for the impact of heart rate on QT measurement.
There was no funding for this study.
The author declares no conflicts of interest.