The author has just written a book on the evolution of the specialty of Pediatric Cardiology over the last 50 years [1]. The intent of this review is to present a summary of this book. Because of large amount of this material, the review is separated into four parts. In these first and second parts, transcatheter interventions (balloon angioplasty/valvuloplasty procedures and percutaneous occlusions) were appraised. In this paper, electrocardiography, echocardiography, and cardiac catheterization will be reviewed.
In this review, contributions of the author pertaining to electrocardiography were examined. These contributions were: A study of normal Frank and McFee vectorcardiograms in the normal adolescent [2], distinguishing right ventricular hypertrophy from postero-basal left ventricular hypertrophy [3], identifying possible cause of alternating failure of mechanical to electrical depolarization (AFORMED) phenomenon [4], examination to see if racial variations in electrocardiograms and vectorcardiograms between black and white children exist and if so, the causes of such variation [5,6], document resolution with medications of congestive cardiomyopathy due to chronic tachycardia (Figure 1) [7], changes in the electrocardiogram (ECG) after balloon pulmonary valvuloplasty (Figure 2) [8,9], utility of electrocardiogram in delineating atrial (Figure 3) and ventricular situs in patients with dextrocardia and heterotaxy syndromes [10-14], and an appraisal of arrhythmias in children [15-17].
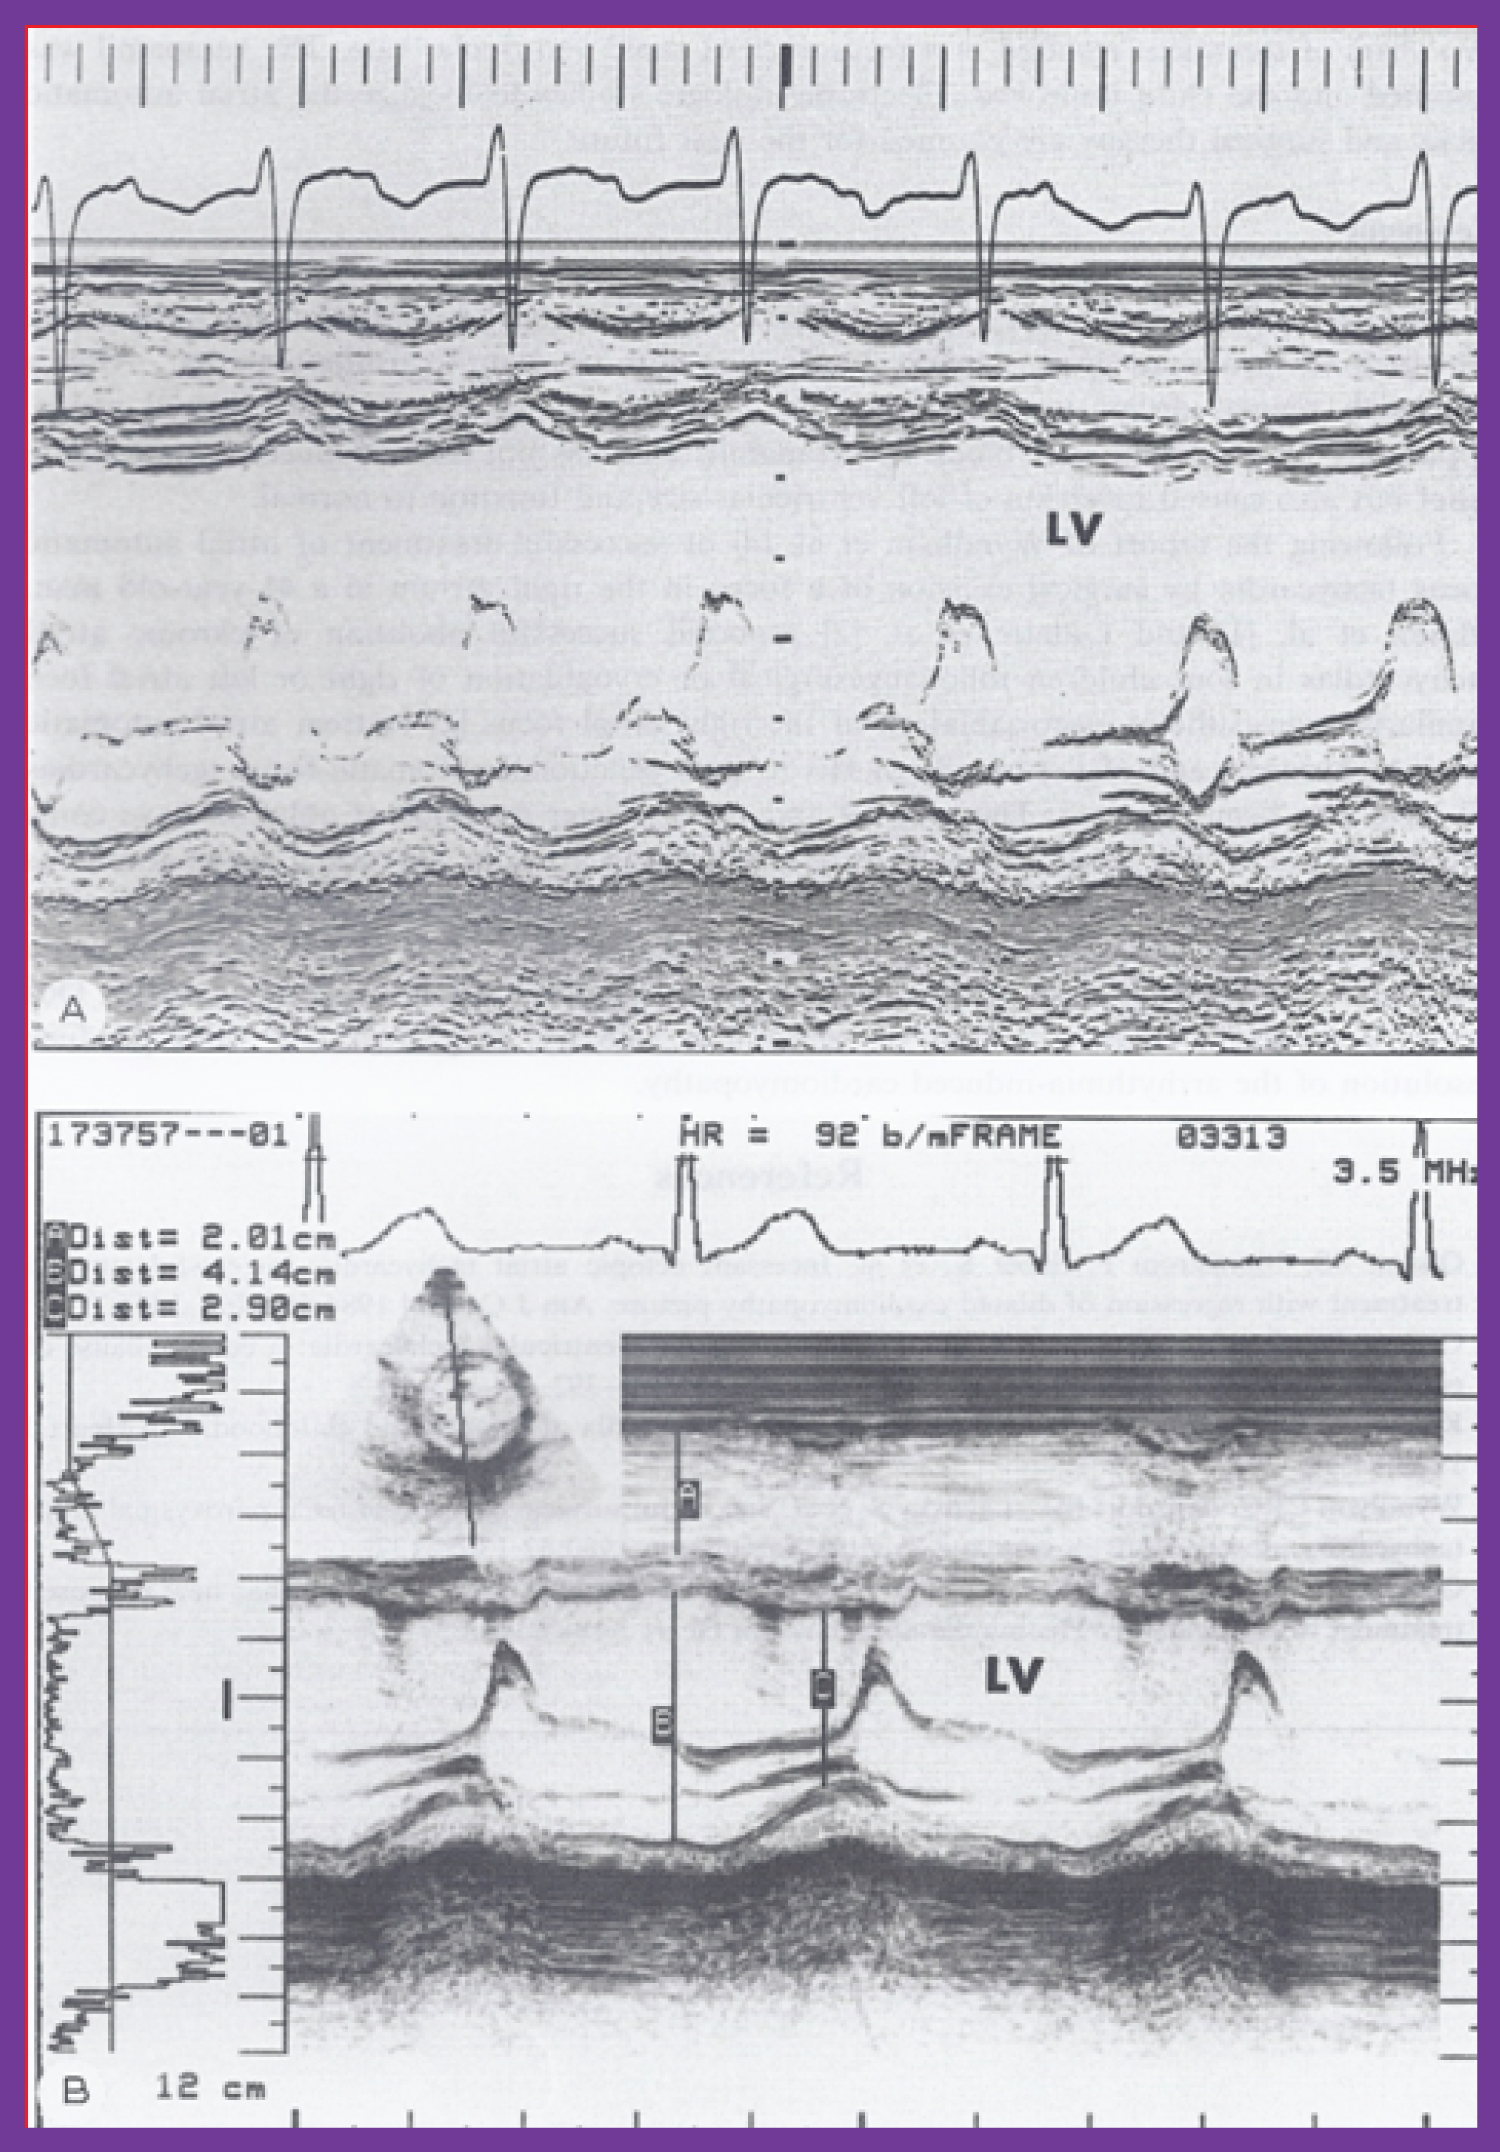 Figure 1: A) M-mode echocardiogram of a 3-year-old child who developed arrhythmia-induced cardiomyopathy; note the markedly dilated left ventricle (LV) with poor function (calculated shortening fraction was 13%). B) M-mode echocardiogram (5.5 years later) of the same patient following successful drug therapy; note the normal-sized LV with normal function (calculated shortening fraction was 29%) [7].
View Figure 1
Figure 1: A) M-mode echocardiogram of a 3-year-old child who developed arrhythmia-induced cardiomyopathy; note the markedly dilated left ventricle (LV) with poor function (calculated shortening fraction was 13%). B) M-mode echocardiogram (5.5 years later) of the same patient following successful drug therapy; note the normal-sized LV with normal function (calculated shortening fraction was 29%) [7].
View Figure 1
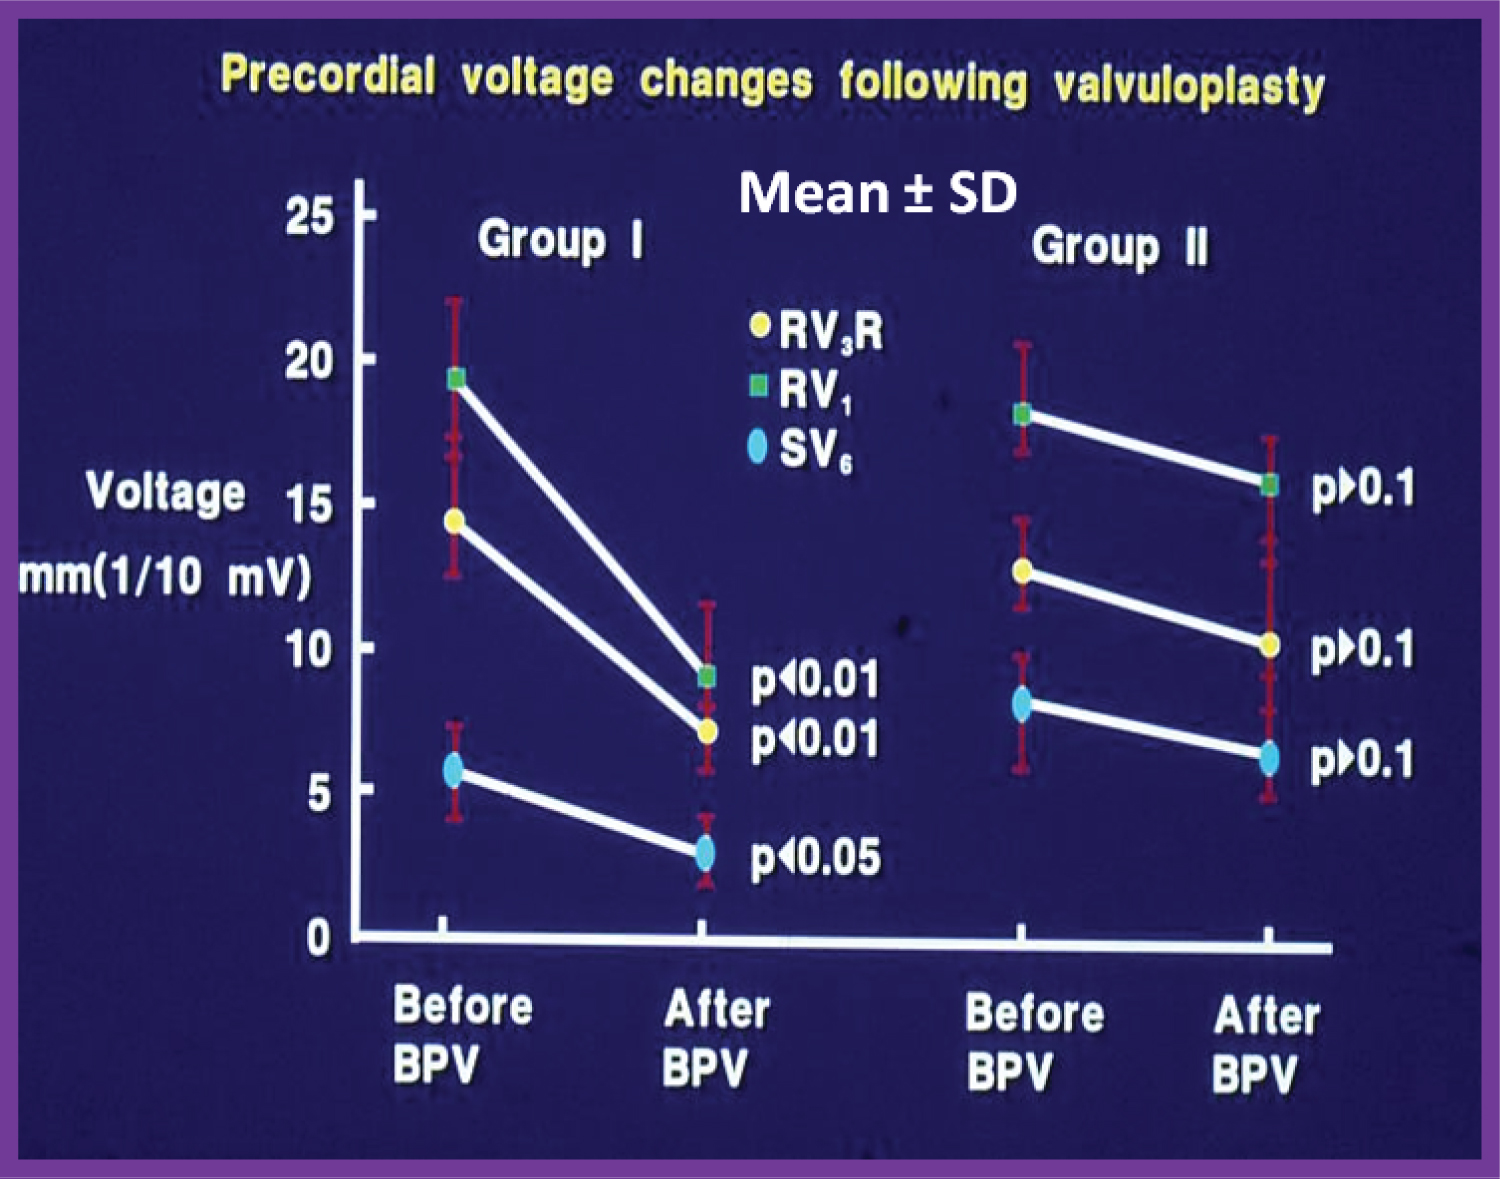 Figure 2: Precordial ECG voltages (R waves in leads V3R and V1 and S waves in V6) prior to and at follow-up after balloon pulmonary valvuloplasty (BPV) in group I (with good results) (left panel) and group II (with poor results) (right panel) are depicted. The mean and standard deviation (SD) are shown. Note the significant (p < 0.05 to 0.01) decrease in the voltages in group I while there was no significant (p > 0.1) change in group II [9].
View Figure 2
Figure 2: Precordial ECG voltages (R waves in leads V3R and V1 and S waves in V6) prior to and at follow-up after balloon pulmonary valvuloplasty (BPV) in group I (with good results) (left panel) and group II (with poor results) (right panel) are depicted. The mean and standard deviation (SD) are shown. Note the significant (p < 0.05 to 0.01) decrease in the voltages in group I while there was no significant (p > 0.1) change in group II [9].
View Figure 2
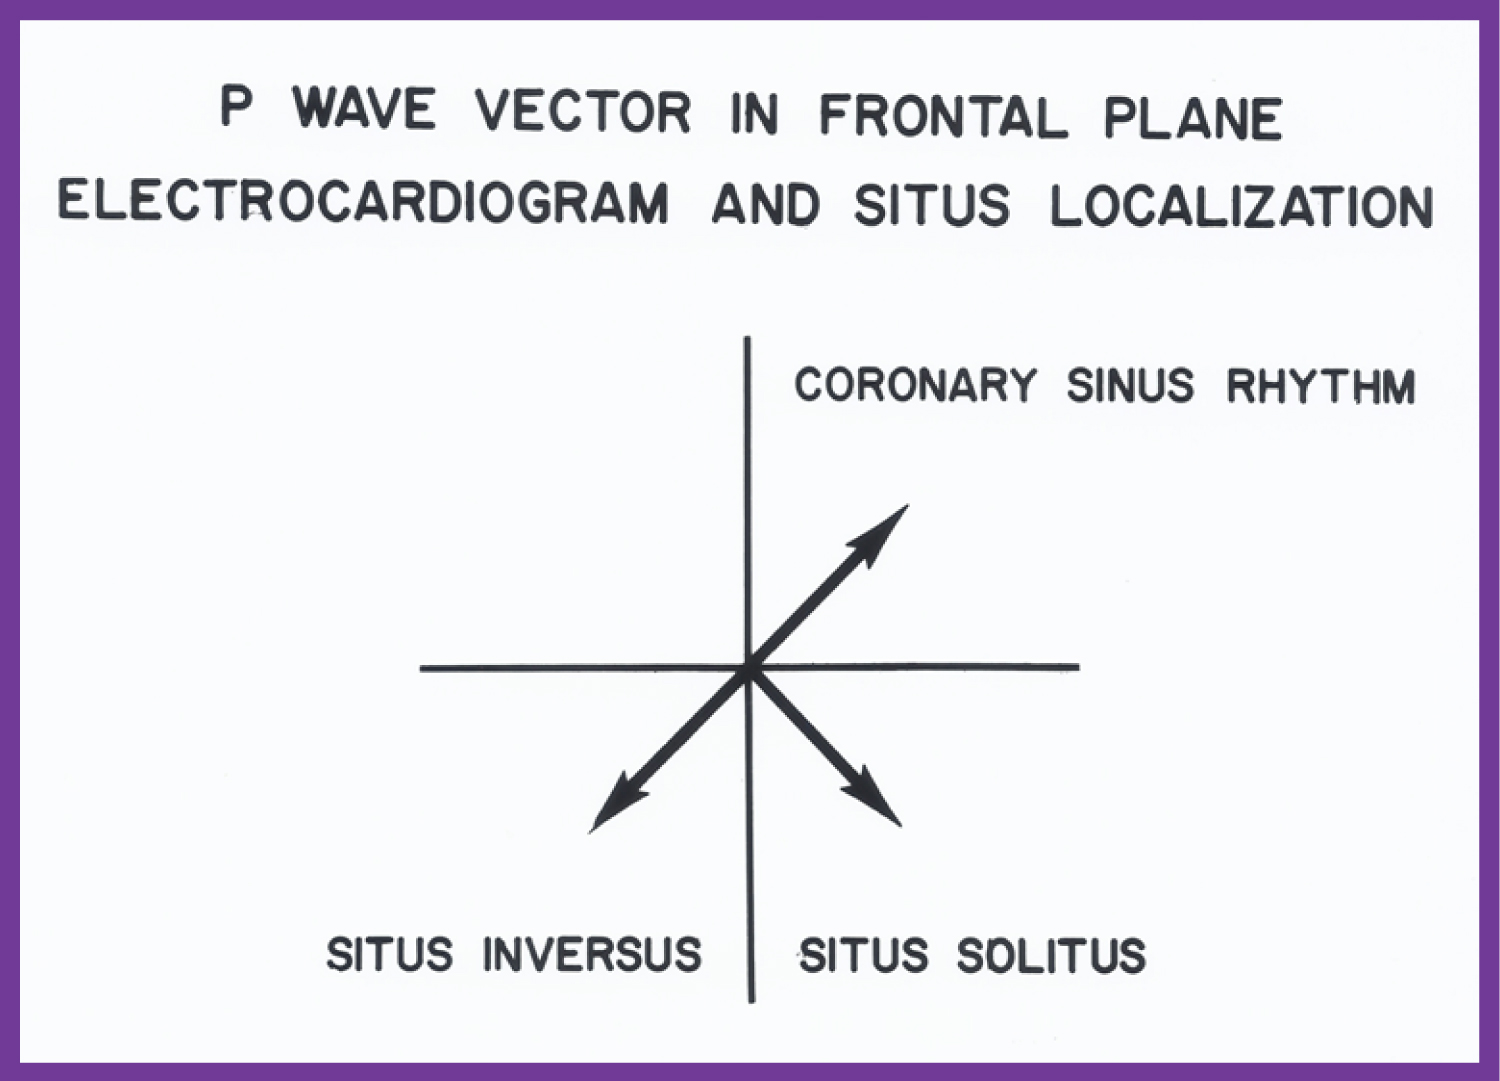 Figure 3: The location of the P vector (axis) in the frontal plane is shown for situs solitus (+45°) and situs inversus (+135°). A P vector between 0° and -90° is called coronary sinus rhythm and is not helpful in atrial situs assignment [10].
View Figure 3
Figure 3: The location of the P vector (axis) in the frontal plane is shown for situs solitus (+45°) and situs inversus (+135°). A P vector between 0° and -90° is called coronary sinus rhythm and is not helpful in atrial situs assignment [10].
View Figure 3
Documentation of diagnosis of Ebstein's anomaly of the left atrioventricular valve with congenital corrected transposition of the great arteries by intracavitary electrocardiography [18], ECG features of tricuspid atresia [19,20] and etiology of left axis deviation in patients with tricuspid atresia [19-21] were also presented.
To a large extent, the author has self-learned the echocardiography and Doppler recording techniques as well the skills of interpretation of such recordings; these endeavors helped the author to participate and perform several echocardiographic investigations. The echo studies include, usefulness of echocardiography in estimating the magnitude of left-to-right shunt in isolated ventricular septal defects (VSDs) (Figure 4) [22], usefulness of contrast echocardiography in the diagnosis of anomalous drainage of the right superior vena cava to the left atrium (Figure 5) [23,24], identification of pitfalls of m-mode echocardiography in the evaluation of the aortic root in left ventricular hypoplasia syndromes [25].
 Figure 4: Scattergram demonstrating the relationship of the left atrium to aortic root ratio (LA:Ao) with the pulmonary-to-systemic flow ratio (Qp:Qs) in patients with isolated ventricular septal defects. The central line is the regression line and the parallel lines demarcate the confidence interval. The number of patients (N), regression equation and correlation coefficient (r) are shown in the insert at the top left [22].
View Figure 4
Figure 4: Scattergram demonstrating the relationship of the left atrium to aortic root ratio (LA:Ao) with the pulmonary-to-systemic flow ratio (Qp:Qs) in patients with isolated ventricular septal defects. The central line is the regression line and the parallel lines demarcate the confidence interval. The number of patients (N), regression equation and correlation coefficient (r) are shown in the insert at the top left [22].
View Figure 4
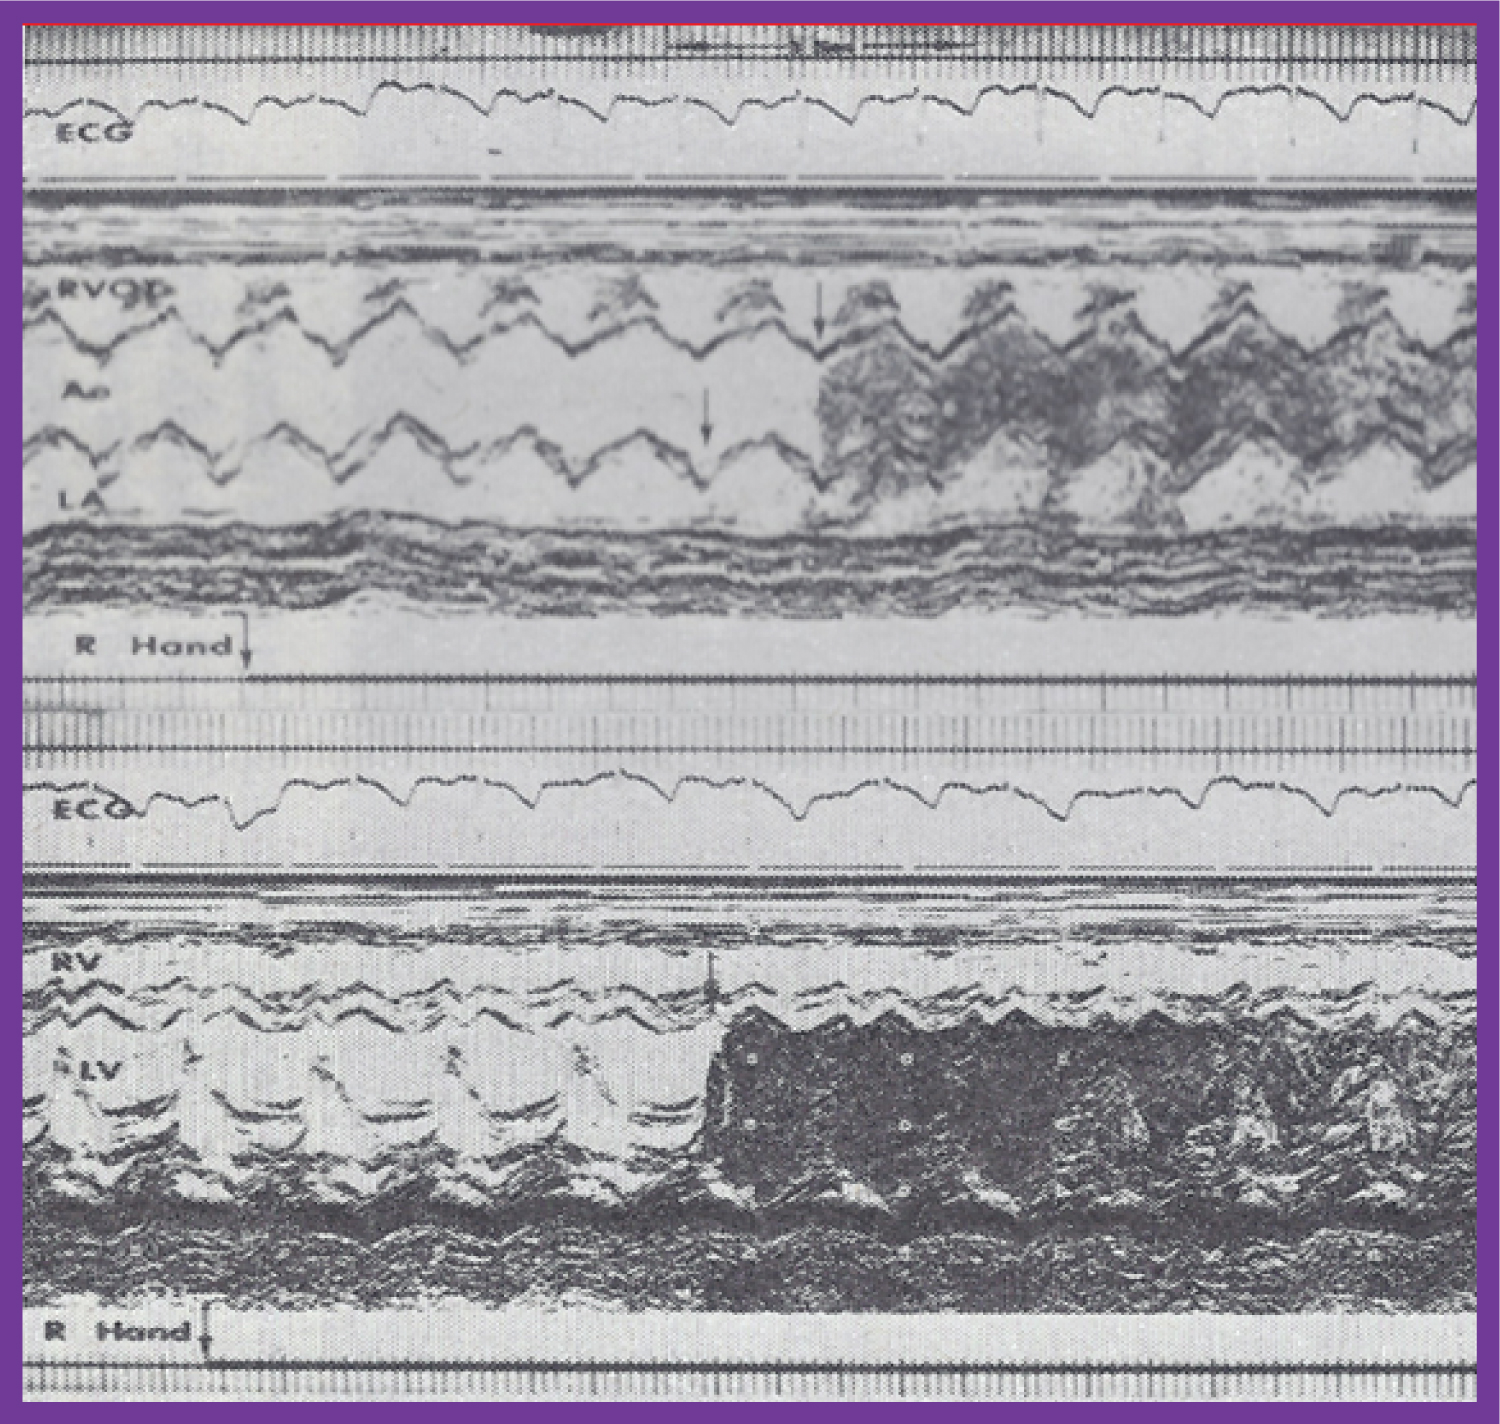 Figure 5: A) Selected M-mode recordings from the parasternal short axis view of the left atrium (LA), aorta (Ao), and right ventricular outflow tract (RVOT), made while injecting agitated saline into veins of the right (R) hand, which demonstrate the appearance of contrast echoes in the LA (arrow) first and then the Ao (arrow); B) Similar tracings of the left ventricle (LV) and right ventricle (RV) demonstrate the appearance of contrast echoes in the LV (arrow) without contrast in the RV. Similar findings were seen while injecting agitated saline into the veins of the left hand. These recordings indicate the drainage of the superior vena cava into the left atrium. The start of the agitated saline injection is marked with arrows at the bottom of each tracing. ECG: Electrocardiogram [23].
View Figure 5
Figure 5: A) Selected M-mode recordings from the parasternal short axis view of the left atrium (LA), aorta (Ao), and right ventricular outflow tract (RVOT), made while injecting agitated saline into veins of the right (R) hand, which demonstrate the appearance of contrast echoes in the LA (arrow) first and then the Ao (arrow); B) Similar tracings of the left ventricle (LV) and right ventricle (RV) demonstrate the appearance of contrast echoes in the LV (arrow) without contrast in the RV. Similar findings were seen while injecting agitated saline into the veins of the left hand. These recordings indicate the drainage of the superior vena cava into the left atrium. The start of the agitated saline injection is marked with arrows at the bottom of each tracing. ECG: Electrocardiogram [23].
View Figure 5
Other contributions are: Review of evaluation of left ventricular function by echocardiography [26,27], echocardiographic diagnosis of tricuspid atresia [28], utility of contrast echocardiography in the assessment of hypoxemia after open heart surgery [29], quantifying left ventricular muscle mass by m-mode echocardiograms in children [30], racial and sexual differences in echo measurements in children [31], heart size and function in children with sickle cell disease [32], and afterload reduction in the treatment of primary myocardial disease (Figure 6, Figure 7 and Figure 8) [33].
 Figure 6: Pre-ejection period (PEP)/left ventricular ejection time (LVET) ratio (open circles) and shortening fraction in percent (%) (closed circles) are shown from prior to the start of hydralazine therapy (0) and at 1, 3, 6, 9, 12, 18, 24, 30, 36 and 42 months following its initiation. The means and standard deviations (SD) are shown. The number of subjects at 30, 36 and 42 months is small and therefore, only the mean values are shown. Note the gradual improvement in PEP/LVET ratio and shortening fraction. A statistically significant (p < 0.05 to < 0.001) change becomes apparent from the 12-month follow-up onwards [33].
View Figure 6
Figure 6: Pre-ejection period (PEP)/left ventricular ejection time (LVET) ratio (open circles) and shortening fraction in percent (%) (closed circles) are shown from prior to the start of hydralazine therapy (0) and at 1, 3, 6, 9, 12, 18, 24, 30, 36 and 42 months following its initiation. The means and standard deviations (SD) are shown. The number of subjects at 30, 36 and 42 months is small and therefore, only the mean values are shown. Note the gradual improvement in PEP/LVET ratio and shortening fraction. A statistically significant (p < 0.05 to < 0.001) change becomes apparent from the 12-month follow-up onwards [33].
View Figure 6
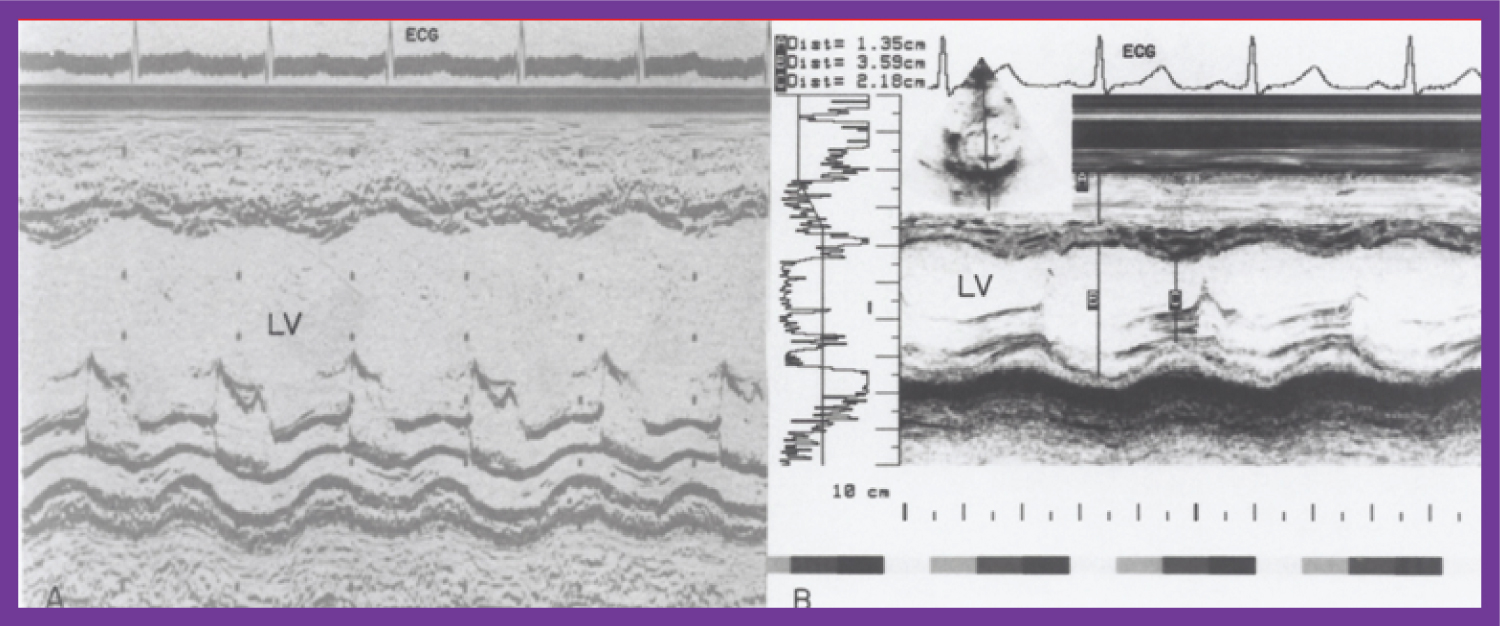 Figure 7: A) Selected M-mode recordings from the parasternal short axis view of the left ventricle (LV) made prior to and B) following hydralazine therapy. Note a significant improvement in the LV size and function [1].
View Figure 7
Figure 7: A) Selected M-mode recordings from the parasternal short axis view of the left ventricle (LV) made prior to and B) following hydralazine therapy. Note a significant improvement in the LV size and function [1].
View Figure 7
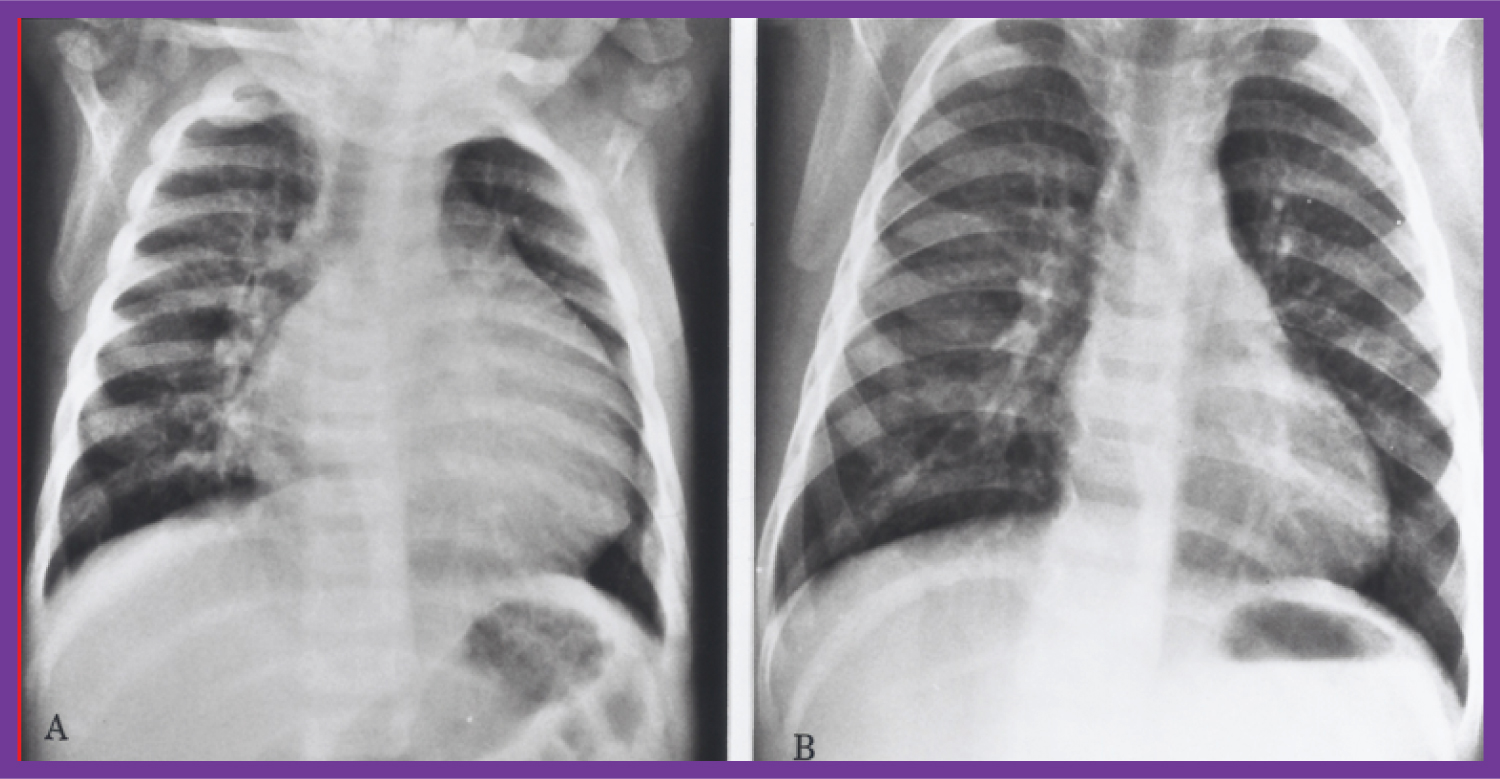 Figure 8: Chest X-rays in antero-posterior view, prior to A) and following B) Hydralazine therapy. A) Moderate cardiomegaly and pulmonary venous congestion were seen prior to therapy; B) Which improved remarkably after therapy [1].
View Figure 8
Figure 8: Chest X-rays in antero-posterior view, prior to A) and following B) Hydralazine therapy. A) Moderate cardiomegaly and pulmonary venous congestion were seen prior to therapy; B) Which improved remarkably after therapy [1].
View Figure 8
Also reviewed were usefulness of echo-Doppler studies in the assessment of the results of balloon pulmonary valvuloplasty [34], utility of Doppler studies in the estimation of pressure gradients across the pulmonary valve in pulmonary stenosis [35], appraisal of Doppler echocardiography in non-invasive diagnosis of heart disease in children [36], echo-Doppler studies in the appraisal of the results of balloon procedure for coarctation of the aorta (Figure 9) [37], importance of Doppler in the prediction of pressure gradients across aortic coarctation [38], description of foramen ovale and transatrial Doppler velocity patterns in the normal fetus (Figure 10) [39], establishing the correlation of shunt flow and angiographic size to stretched diameter of the atrial septal defect by echocardiograms [40], echocardiographic assessment of balloon-stretched diameter of secundum atrial septal defects [41], development of echocardiographic predictors of success of buttoned device closure of atrial septal defect [42], pointing out of limitations of echo in complete assessment of mixed type of total anomalous pulmonary venous connection [43], echocardiographic follow-up results of buttoned device occlusion of atrial septal defect [44], review of ultrasound studies [45-47], collaborative echo-Doppler studies [48-50], echocardiographic evaluation of the results of balloon pulmonary valvuloplasty [51], editorials on echo topics, aneurysm of the ventricular septum producing pulmonary outflow tract obstruction in the morphologic left ventricle in corrected transposition of the great arteries [52-54] and echo descriptions of CHDs.
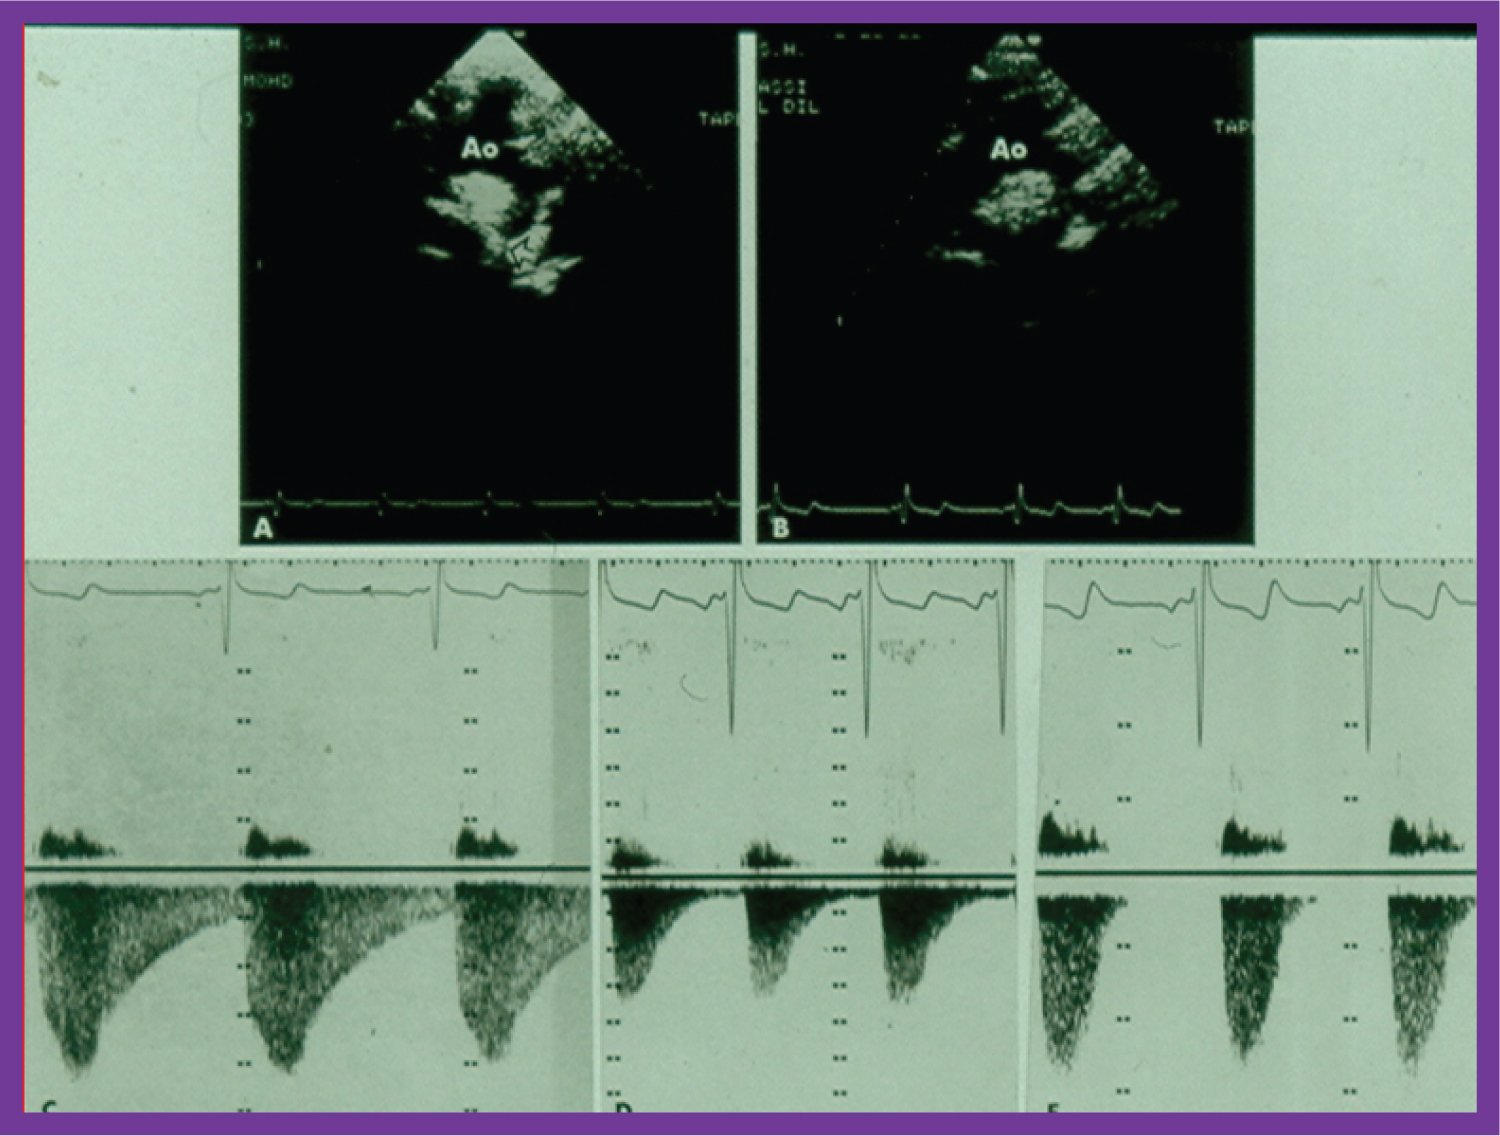 Figure 9: A) Two-dimensional (2D) echo images prior to and; B) following balloon angioplasty of aortic coarctation show improvement in B; C) Continuous wave Doppler flow velocity recordings from suprasternal notch directing the Doppler signal towards the descending aorta prior to and; D) immediately following balloon angioplasty of aortic coarctation and; E) at six months after angioplasty are shown. Note the reduction of peak Doppler flow velocity from C to D, with further fall in E. Also note that the diastolic flow is seen throughout the entire diastole (pandiastolic) prior to angioplasty (C), and is seen only is early diastole immediately after angioplasty (D). At six-month follow-up (E), there was no diastolic flow at all [37].
View Figure 9
Figure 9: A) Two-dimensional (2D) echo images prior to and; B) following balloon angioplasty of aortic coarctation show improvement in B; C) Continuous wave Doppler flow velocity recordings from suprasternal notch directing the Doppler signal towards the descending aorta prior to and; D) immediately following balloon angioplasty of aortic coarctation and; E) at six months after angioplasty are shown. Note the reduction of peak Doppler flow velocity from C to D, with further fall in E. Also note that the diastolic flow is seen throughout the entire diastole (pandiastolic) prior to angioplasty (C), and is seen only is early diastole immediately after angioplasty (D). At six-month follow-up (E), there was no diastolic flow at all [37].
View Figure 9
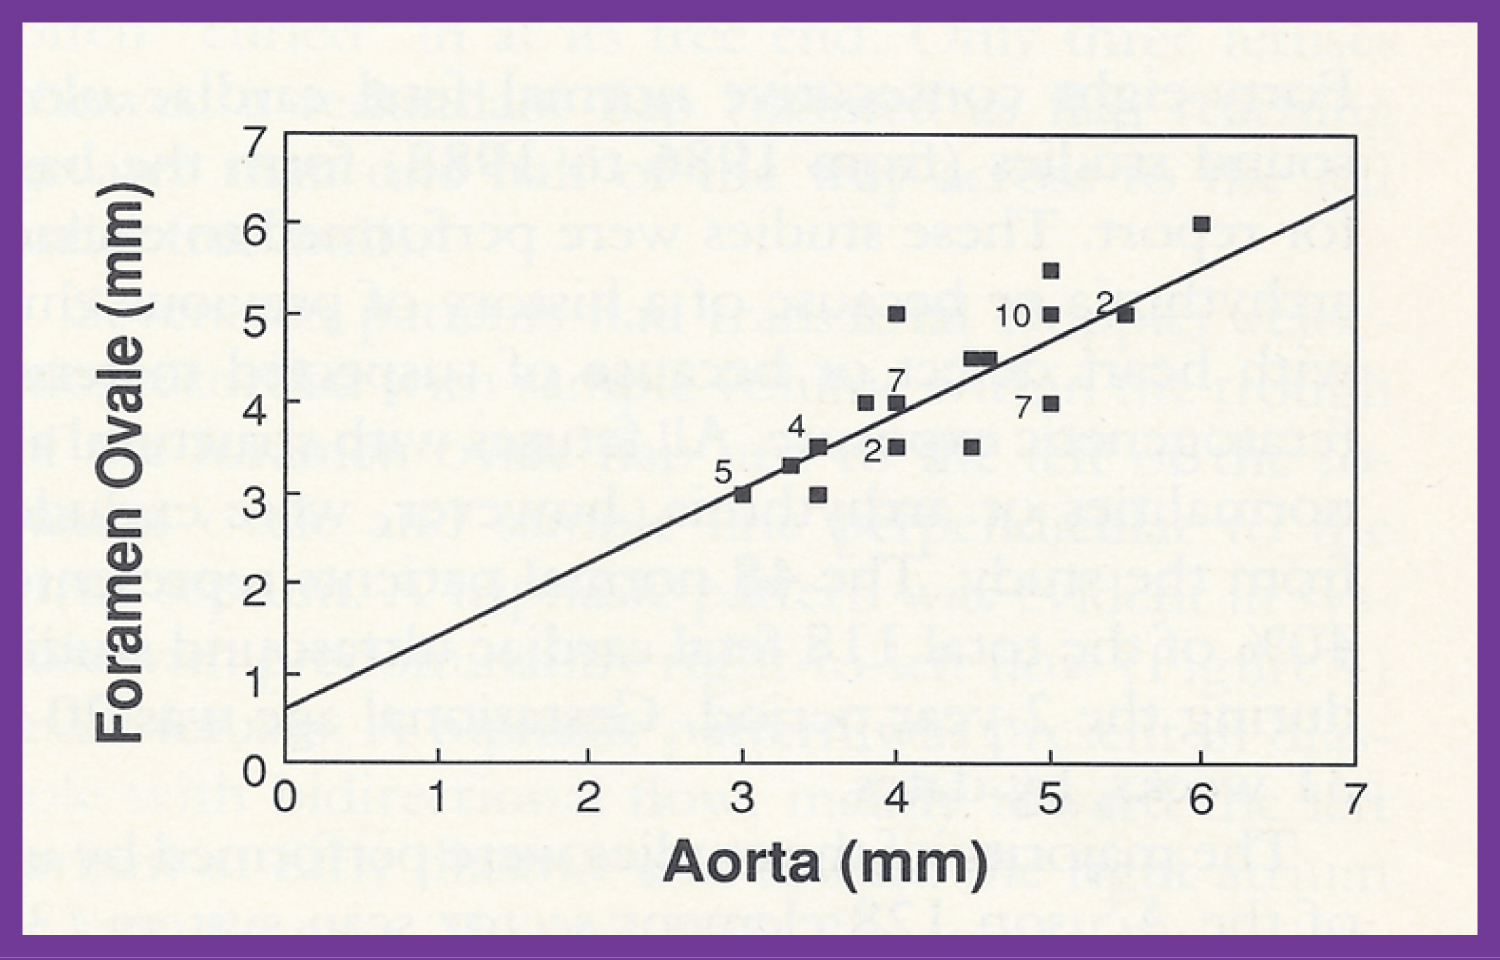 Figure 10: Plot of the diameter of the foramen ovale against the diameter of the aorta. The numbers indicate the number of subjects with that particular measurement. Note the excellent correlation with an r value of 0.84, y intercept of 0.605 and slope of 0.817 [39].
View Figure 10
Figure 10: Plot of the diameter of the foramen ovale against the diameter of the aorta. The numbers indicate the number of subjects with that particular measurement. Note the excellent correlation with an r value of 0.84, y intercept of 0.605 and slope of 0.817 [39].
View Figure 10
The contributions of the author in the procedures of cardiac catheterization and selective cine-angiography were discussed. These are: Correlating pulmonary venous wedge pressures with pulmonary arterial pressures (Figure 11 and Figure 12) during cardiac catheterization [55], advocacy of femoral venous route for cardiac catheterization in pediatric patients infants [56], report of systemic venous anomalies and partial heterotaxia in a child with normal heart [57], examining the concepts with regard to pressure and energy in cardiac chambers both in terms of pressure gradient in the absence of obstruction/stenosis [58] and lack of pressure gradient in the presence of multiple obstructions in series [59], status of cardiac catheterization in children in the mid-1970s [60], demonstration of growth of hypoplastic right ventricle by angiography following valvotomy for severe pulmonary stenosis with intact ventricular septum [61], role of intracavitary electrocardiography in the diagnose Ebstein's anomaly of the left atrioventricular valve in children with congenital corrected transposition of the great arteries [18], demonstration of utility of pulmonary vein wedge angiography in visualization of obstructed pulmonary arteries (Figure 13) [62], growth phenomenon as a mechanism for development of kinking of the right pulmonary artery following Waterston anastomosis (Figure 14) [63], and documentation of a new complication of the Waterston anastomosis, namely false aneurysm of the right pulmonary artery [64].
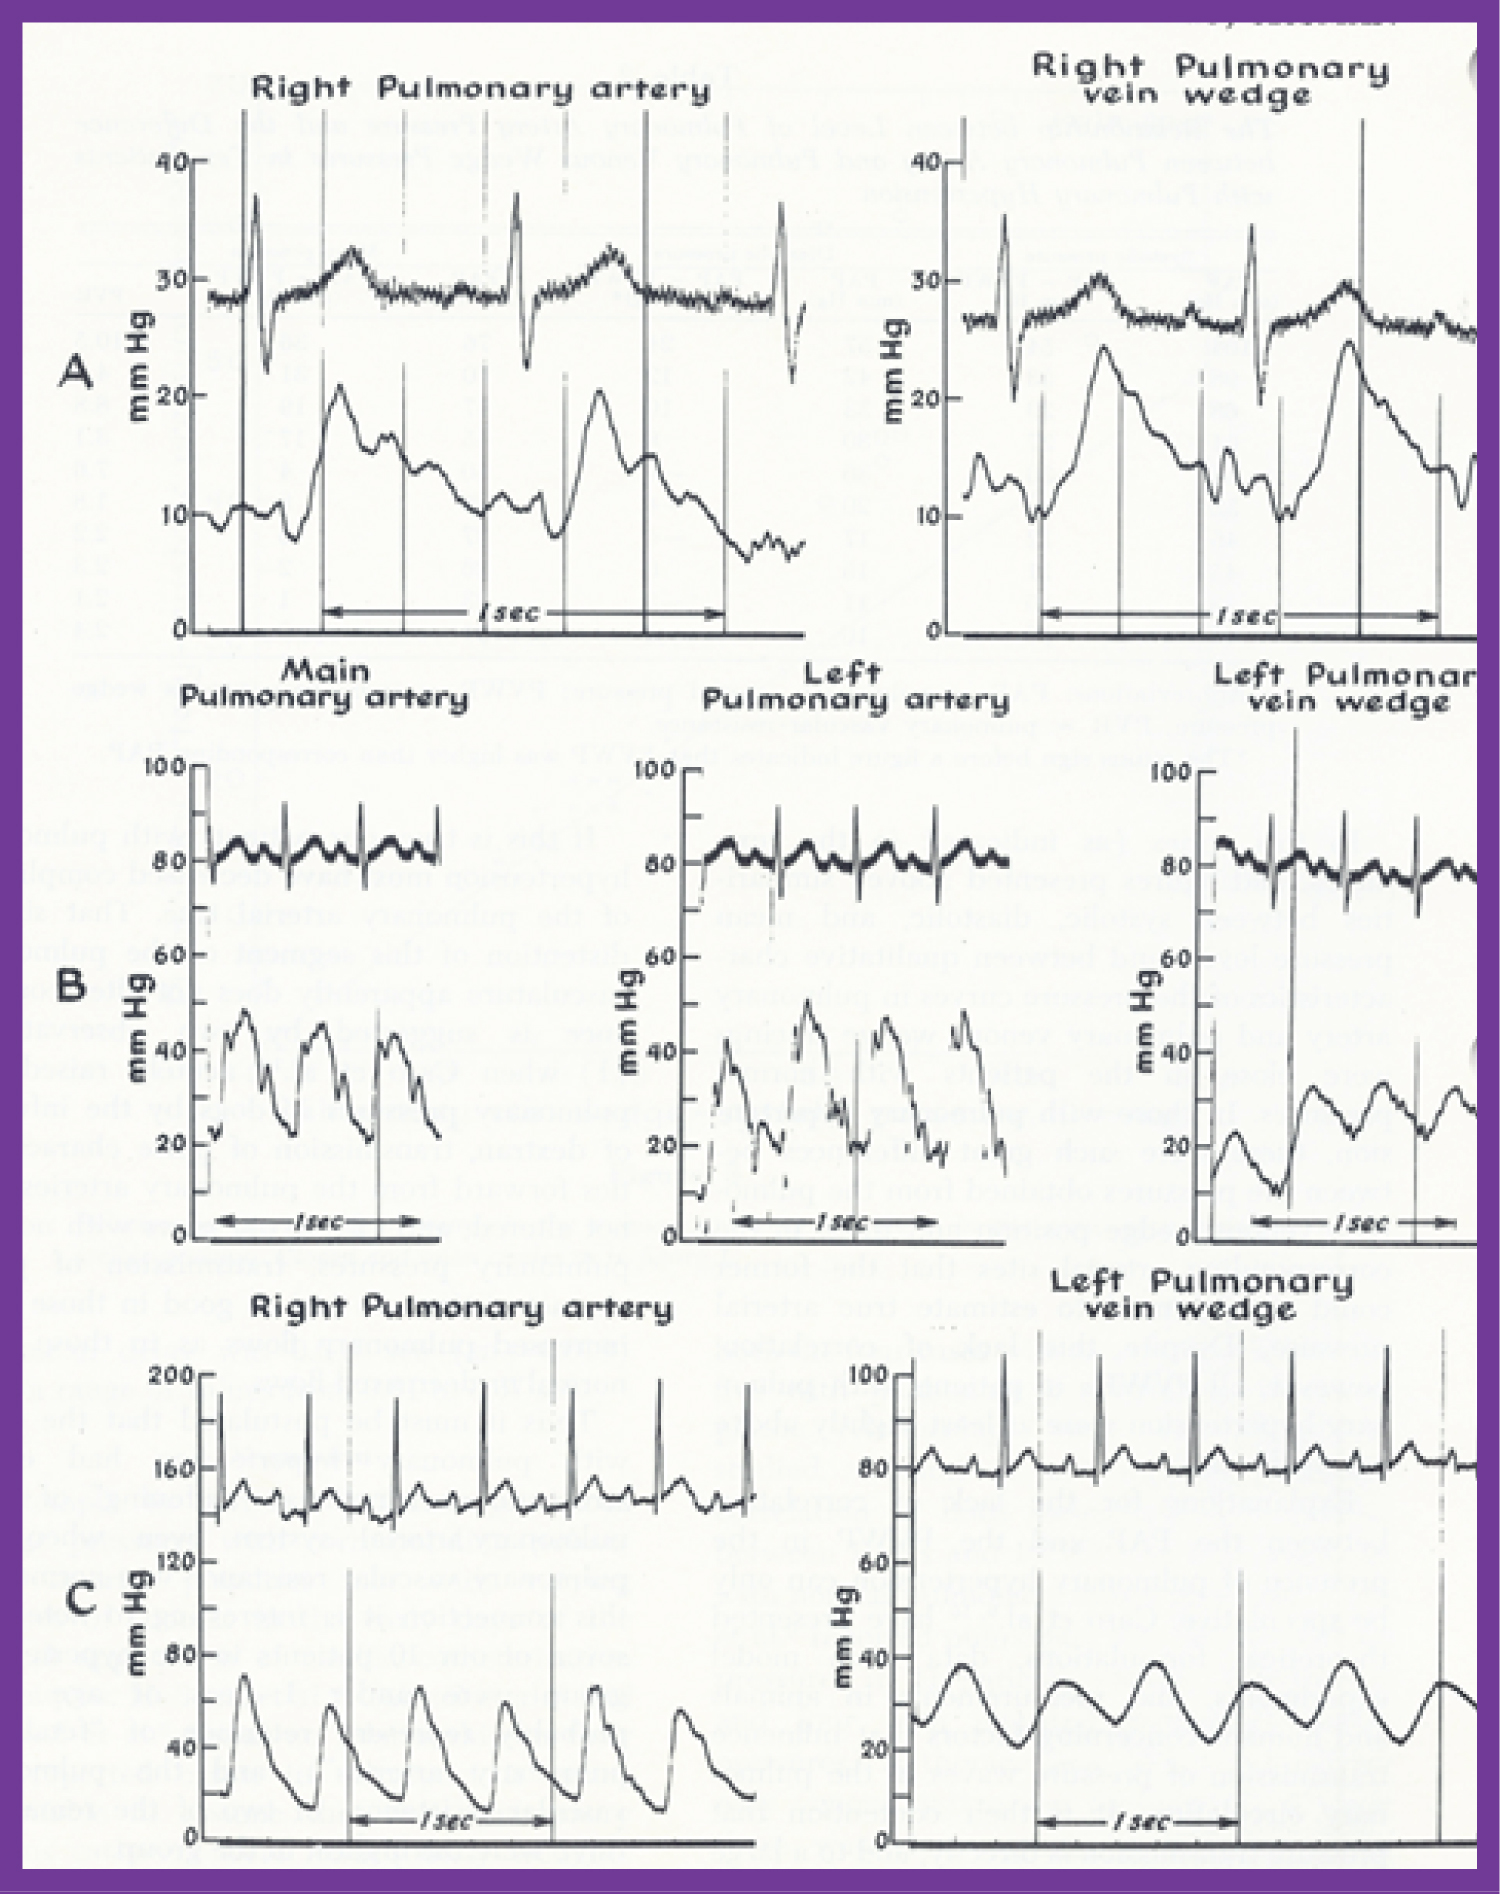 Figure 11: This figure shows examples of pulmonary venous (PV) wedge and the corresponding pulmonary arterial (PA) pressure tracings. Note the similarity of the tracings in patients with normal PA pressures (A and B). In a patient with elevated PA pressure the PV wedge pressures is mildly damped with slightly lower magnitude when compared with the PA pressure (C). The pulse pressure is also lower in the PV wedge position. Note that both the PA and PV wedge pressure tracings demonstrate pulsus alternans in a patient with congestive heart failure (C) [55].
View Figure 11
Figure 11: This figure shows examples of pulmonary venous (PV) wedge and the corresponding pulmonary arterial (PA) pressure tracings. Note the similarity of the tracings in patients with normal PA pressures (A and B). In a patient with elevated PA pressure the PV wedge pressures is mildly damped with slightly lower magnitude when compared with the PA pressure (C). The pulse pressure is also lower in the PV wedge position. Note that both the PA and PV wedge pressure tracings demonstrate pulsus alternans in a patient with congestive heart failure (C) [55].
View Figure 11
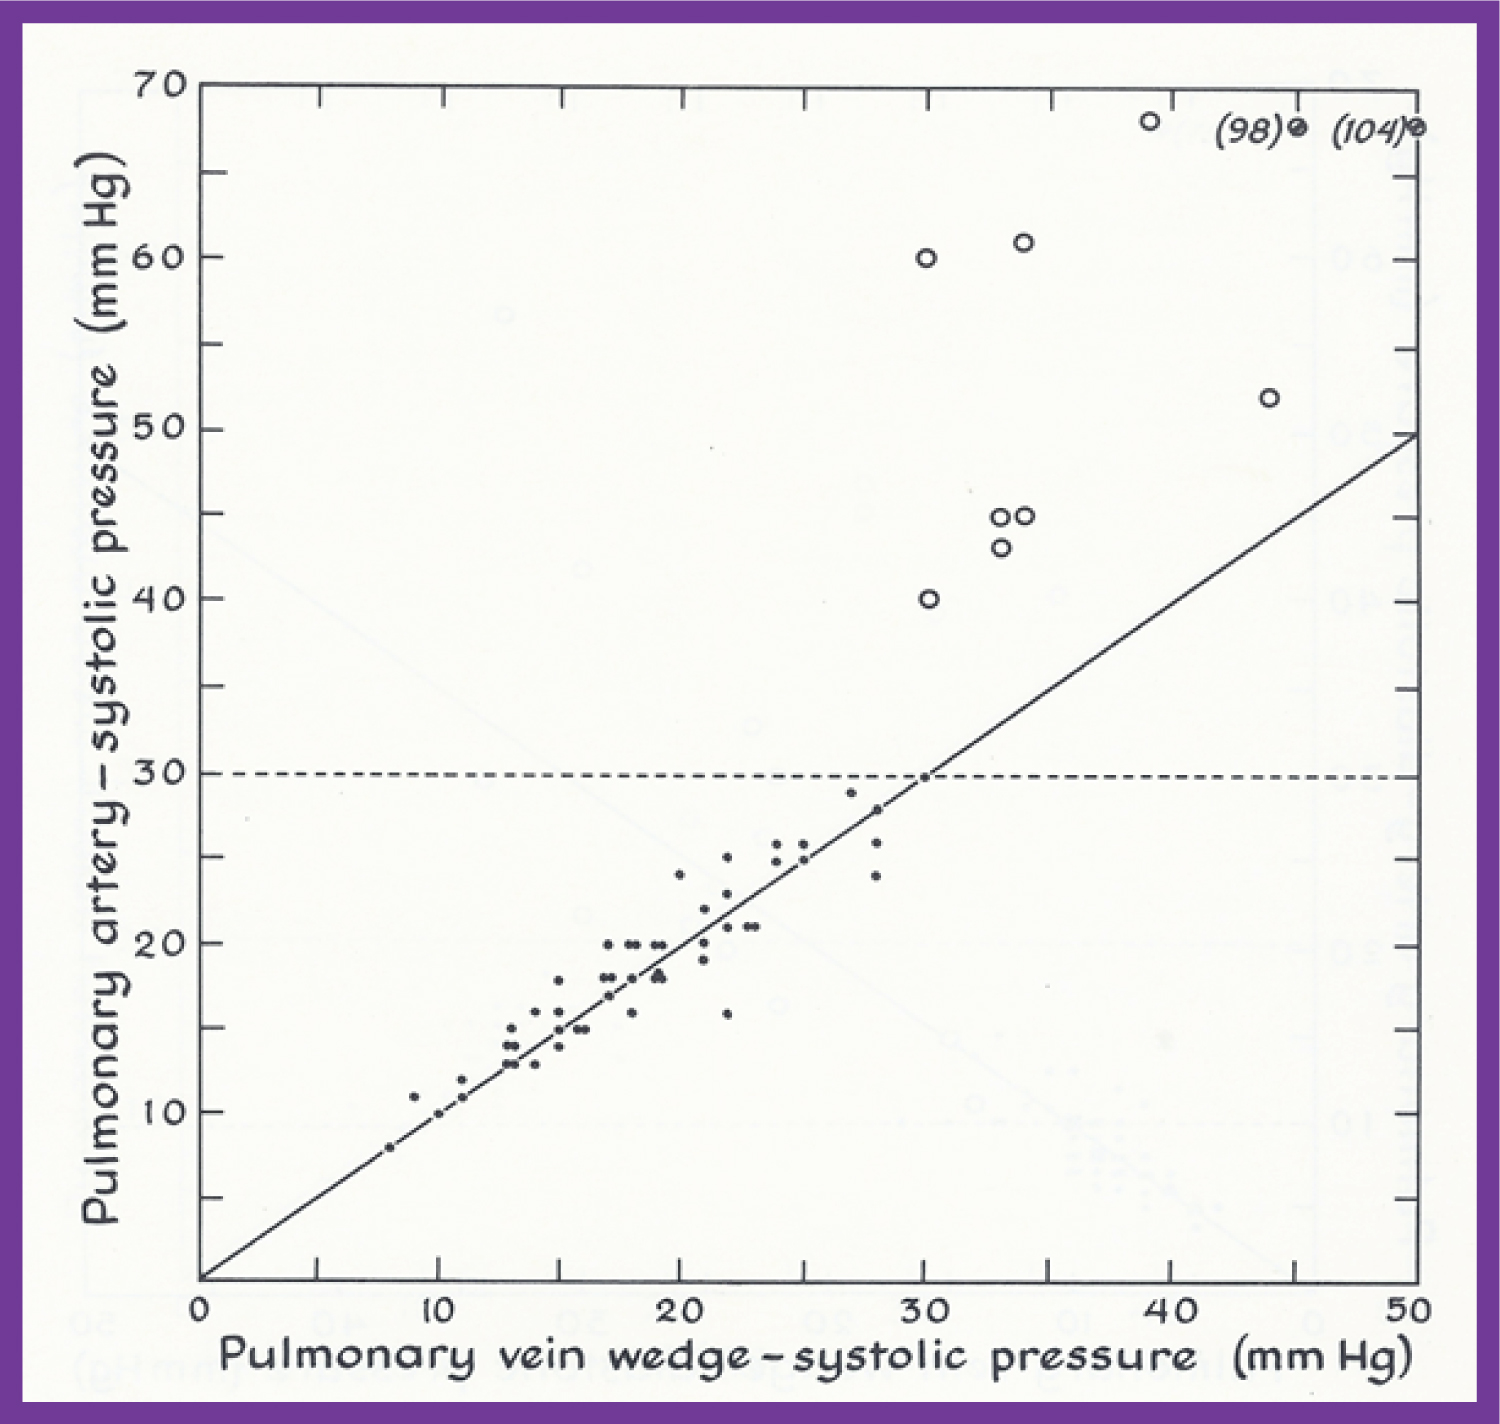 Figure 12: This figure demonstrates the relationship of the pulmonary artery (PA) with the pulmonary venous (PV) wedge systolic pressures. Patients with normal pressures (i.e., less than 30 mmHg) are shown as closed circles while those with systolic pulmonary hypertension are shown as open circles. Note the close-to-identical PA and PV wedge systolic pressures in patients with normal PA pressures, and the lack of such a relationship in patients with elevated PA pressures. The dashed line across at 30 mmHg represents the upper limits of normal PA pressure. The graphs plotting the diastolic and mean pressures show similar findings; the interested reader is referred to the original publication (Figure 2 and Figure 3) for review [55].
View Figure 12
Figure 12: This figure demonstrates the relationship of the pulmonary artery (PA) with the pulmonary venous (PV) wedge systolic pressures. Patients with normal pressures (i.e., less than 30 mmHg) are shown as closed circles while those with systolic pulmonary hypertension are shown as open circles. Note the close-to-identical PA and PV wedge systolic pressures in patients with normal PA pressures, and the lack of such a relationship in patients with elevated PA pressures. The dashed line across at 30 mmHg represents the upper limits of normal PA pressure. The graphs plotting the diastolic and mean pressures show similar findings; the interested reader is referred to the original publication (Figure 2 and Figure 3) for review [55].
View Figure 12
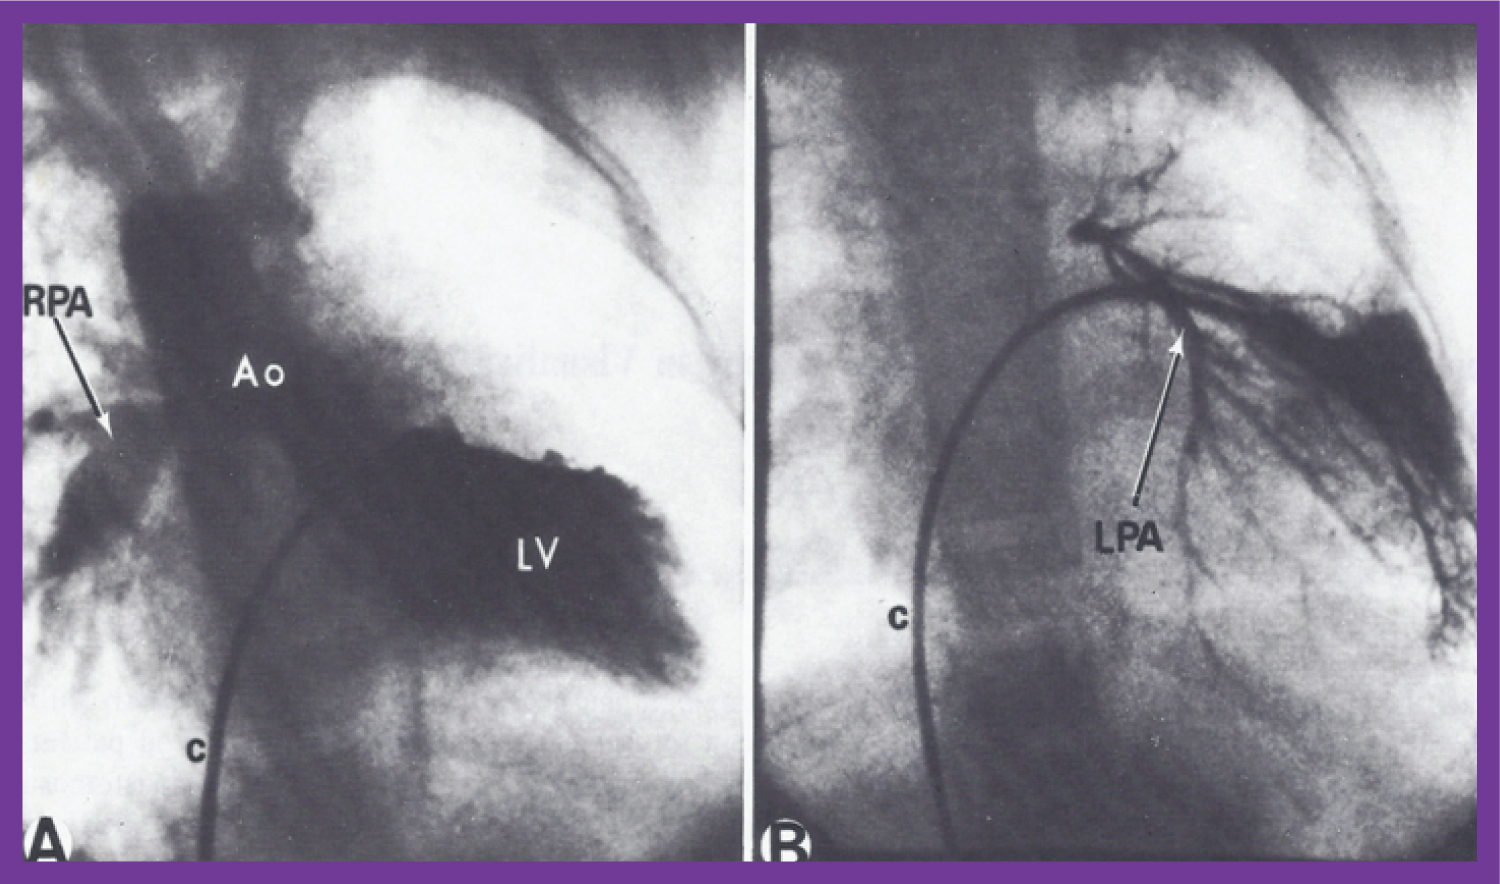 Figure 13: A) Selected frame of a left ventricular (LV) cineangiogram in postero-anterior view, demonstrating the opacification of the aorta (Ao) with a visualization of the right pulmonary artery (RPA) without the opacification of the left pulmonary artery (LPA). The catheter (c) is positioned in the LV via the patent foramen ovale and left atrium (not marked); B) Selected frame of a pulmonary venous wedge cineangiogram, clearly demonstrating the size of the LPA. The catheter is positioned in the pulmonary venous wedge position via the patent foramen ovale and left atrium (not marked) [62].
View Figure 13
Figure 13: A) Selected frame of a left ventricular (LV) cineangiogram in postero-anterior view, demonstrating the opacification of the aorta (Ao) with a visualization of the right pulmonary artery (RPA) without the opacification of the left pulmonary artery (LPA). The catheter (c) is positioned in the LV via the patent foramen ovale and left atrium (not marked); B) Selected frame of a pulmonary venous wedge cineangiogram, clearly demonstrating the size of the LPA. The catheter is positioned in the pulmonary venous wedge position via the patent foramen ovale and left atrium (not marked) [62].
View Figure 13
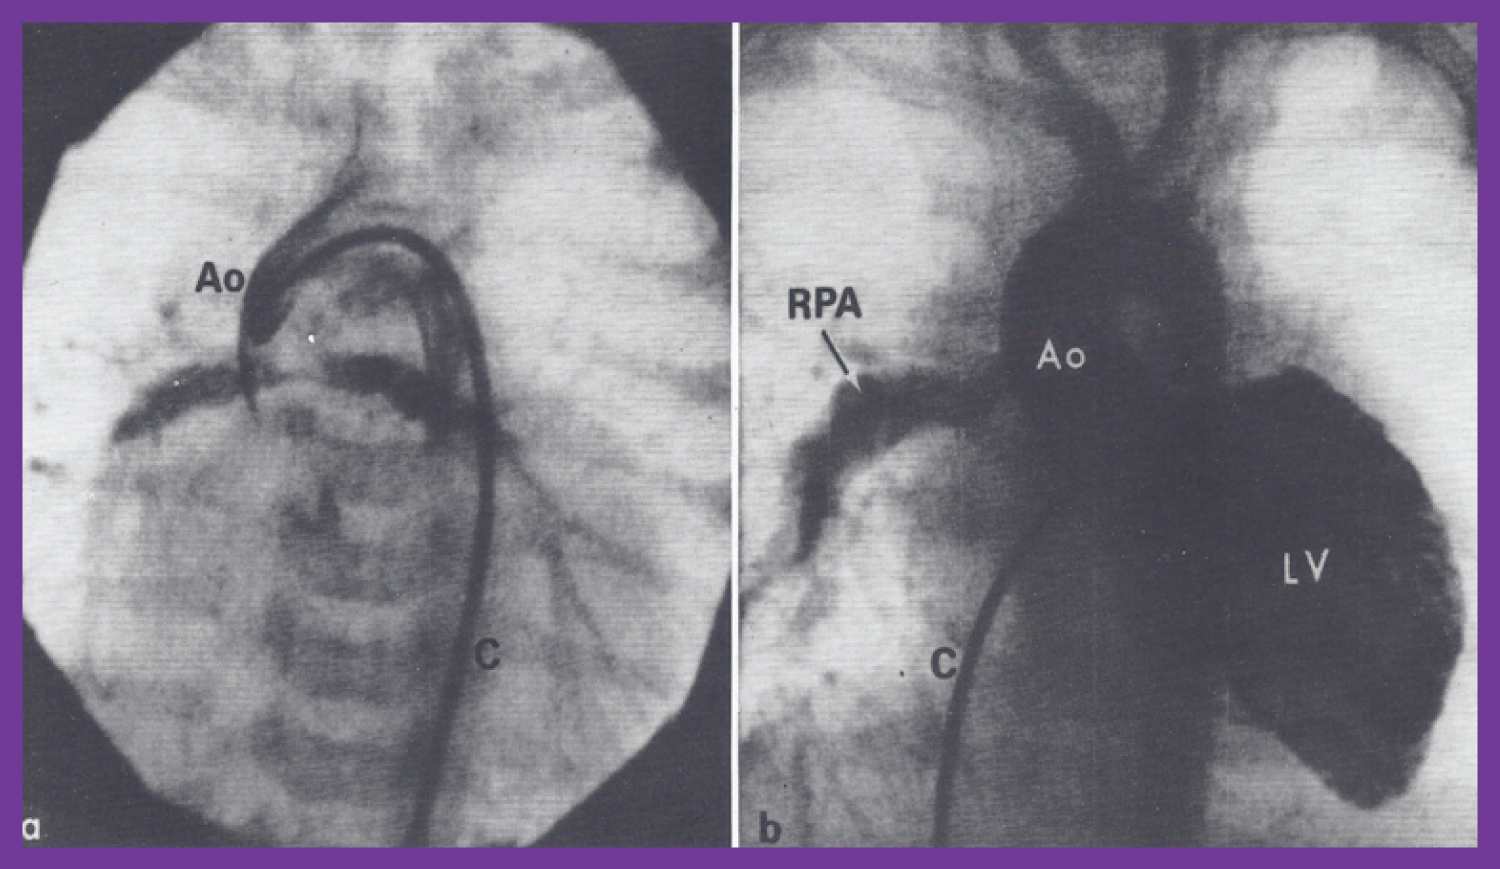 Figure 14: a) Selected frame of an aortic (Ao) root cineangiogram in postero-anterior view, three days after Waterston shunt surgery, demonstrating the prompt opacification of both branch pulmonary arteries via the Waterston shunt. The catheter (C) was positioned in the Ao via the umbilical artery; b) Selected frame of a left ventricular (LV) cineangiogram in postero-anterior view at the age of 12 months, demonstrating opacification of the aorta (Ao) with visualization of the right pulmonary artery (RPA) but without opacification of the left pulmonary artery (LPA). The catheter (c) is positioned in the LV via the patent foramen ovale and left atrium (not marked) [63].
View Figure 14
Figure 14: a) Selected frame of an aortic (Ao) root cineangiogram in postero-anterior view, three days after Waterston shunt surgery, demonstrating the prompt opacification of both branch pulmonary arteries via the Waterston shunt. The catheter (C) was positioned in the Ao via the umbilical artery; b) Selected frame of a left ventricular (LV) cineangiogram in postero-anterior view at the age of 12 months, demonstrating opacification of the aorta (Ao) with visualization of the right pulmonary artery (RPA) but without opacification of the left pulmonary artery (LPA). The catheter (c) is positioned in the LV via the patent foramen ovale and left atrium (not marked) [63].
View Figure 14
The presentation also included manifestation of non-opacification of patent ductus arteriosus in patients with large proximal shunts [65], outcome of intra-arterial injection of heparin on the complications associated with percutaneous arterial catheterization [66], depiction of a new technique of left ventricular and aortic catheterization and angiography via a patent ductus arteriosus [67,68], value of balloon occlusion aortography in demonstrating proximal structures and aorto-pulmonary collateral vessels (Figure 15) [69], and documentation of aneurysms of the membranous ventricular septum resulting in pulmonary outflow tract obstruction in congenitally corrected transposition of the great arteries both in patients with levocardia (Figure 16) [52] and those with dextrocardia [53,54].
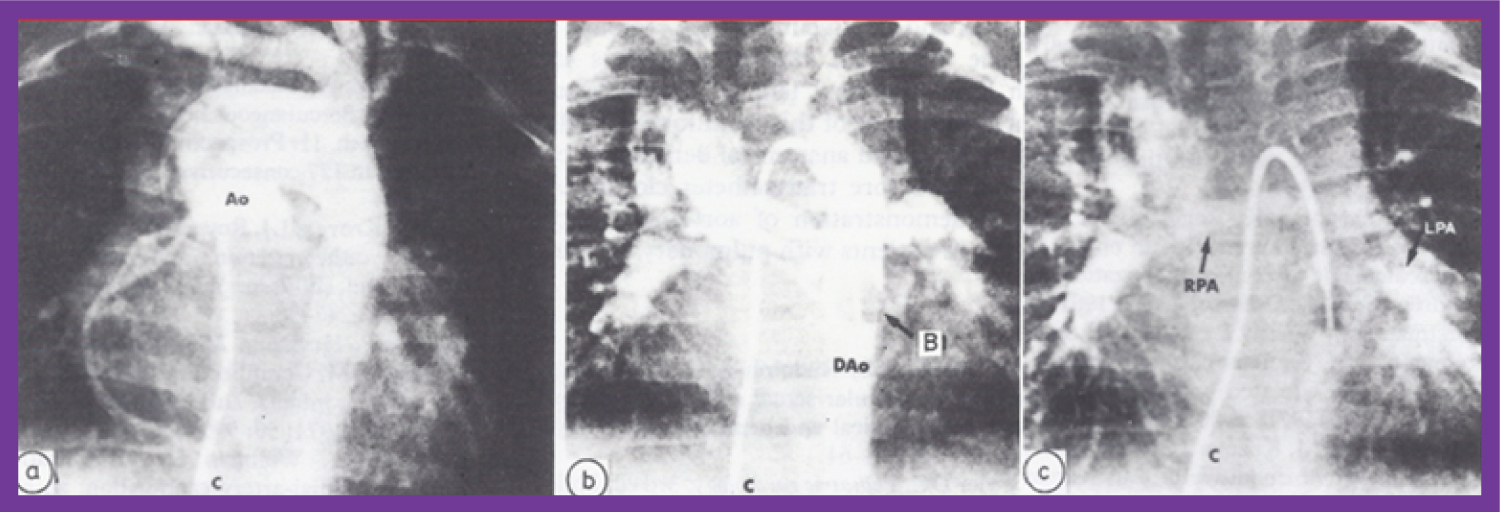 Figure 15: a) Selected frame of an aortic (Ao) root angiogram in postero-anterior view in an infant with tetralogy of Fallot with pulmonary atresia, with multiple aortopulmonary collateral arteries (MAPCAs); the right heart catheter (C) was advanced into the ascending Ao via the VSD. Note that multiple collateral vessels were seen, but there is no clear demonstration of these vessels; b) The same infant's cineangiogram, also in postero-anterior view, obtained by balloon (B) occlusion descending aortography, demonstrates several collateral vessels more clearly than can be seen in a. c) A delayed phase of b demonstrates the right (RPA) and left (LPA) pulmonary arteries. Dao: descending aorta [69].
View Figure 15
Figure 15: a) Selected frame of an aortic (Ao) root angiogram in postero-anterior view in an infant with tetralogy of Fallot with pulmonary atresia, with multiple aortopulmonary collateral arteries (MAPCAs); the right heart catheter (C) was advanced into the ascending Ao via the VSD. Note that multiple collateral vessels were seen, but there is no clear demonstration of these vessels; b) The same infant's cineangiogram, also in postero-anterior view, obtained by balloon (B) occlusion descending aortography, demonstrates several collateral vessels more clearly than can be seen in a. c) A delayed phase of b demonstrates the right (RPA) and left (LPA) pulmonary arteries. Dao: descending aorta [69].
View Figure 15
 Figure 16: a) Selected frames of a morphologic left ventricular (MLV) angiogram in postero-anterior and; b) Lateral projections, demonstrating a finely trabeculated ventricle with opacification of the pulmonary artery (PA). Note that the pulmonary valve is located posterior and inferior to and rightwards from the normal position. The open arrow points to the radiolucent aneurysm (A) in the sub-pulmonary region. The solid arrow points to a narrow jet of contrast material going from the MLV to the PA, suggesting severe sub-pulmonary obstruction [52].
View Figure 16
Figure 16: a) Selected frames of a morphologic left ventricular (MLV) angiogram in postero-anterior and; b) Lateral projections, demonstrating a finely trabeculated ventricle with opacification of the pulmonary artery (PA). Note that the pulmonary valve is located posterior and inferior to and rightwards from the normal position. The open arrow points to the radiolucent aneurysm (A) in the sub-pulmonary region. The solid arrow points to a narrow jet of contrast material going from the MLV to the PA, suggesting severe sub-pulmonary obstruction [52].
View Figure 16