Concentric or eccentric left ventricular hypertrophy (LVH) is an independent prognostic factor of major cardiovascular events in hypertension (HT). A high neutrophil to lymphocyte ratio (NLR) is correlated with high mortality and poor prognosis in cardiovascular disease. This study was performed to investigate the associations between NLR and different left ventricular (LV) geometric patterns in patients with newly diagnosed HT.
The study population consisted of 222 patients with newly diagnosed HT (mean age: 53.2 ± 10.0 years). Echocardiographic examination was performed in all patients. Four different geometric patterns were determined in hypertensive patients according to the left ventricular mass index (LVMI) and relative wall thickness (RWT).
The baseline demographic characteristics were similar in all groups. The NLR and platelet to lymphocyte ratio (PLR) were higher in the eccentric hypertrophy and concentric hypertrophy groups compared to the normal geometry and concentric remodeling groups (p < 0.05, for all). NLR was positively and significantly correlated with LVMI (r = 0.508, p < 0.001). Linear regression analysis showed that LVMI was independently correlated with NLR (β = 5.440, p < 0.001), systolic blood pressure (β = 0.284, p < 0.001), ejection fraction (β = -0.201, p < 0.001), E/A (β = -2.270, p = 0.24), and high-density lipoprotein cholesterol (β = -0.245, p < 0.001).
We demonstrated that patients with newly diagnosed HT with LVH had significantly higher NLR and PLR compared to those without LVH. In addition, NLR predicted LVH in hypertensive patients. The results of this study suggested that inflammation plays a role in the pathogenesis of LVH in hypertensive subjects.
The prevalence of hypertension (HT) is increasing across the world irrespective of income status [1]. HT persists as a major public health problem that the global prevalence of hypertension was estimated to be 1.13 billion in 2015, with a prevalence of over 150 million in central and Eastern Europe [2]. It also affects more than one third of the adult population in USA [3].
There are four different geometric patterns of left ventricle (LV) in HT. These geometric patterns include normal LV geometry (NG), concentric remodeling (CR), eccentric hypertrophy (EH) and concentric hypertrophy (CH). Left ventricular hypertrophy (LVH) is traditionally classified as concentric or eccentric, which is one of the substantial HT-mediated organ damage. It is a fundamental process of adaptation to an increased hemodynamic overload [4]. LVH is an independent prognostic factor for major cardiovascular events including sudden cardiac death, acute myocardial infarction, stroke, and congestive heart failure in hypertensive subjects [5]. For this reason, hypertensive patients with LVH have an increased risk of cardiovascular events compared to hypertensive patients without LVH [6].
It is well known that low-grade inflammation plays a significant pathophysiological role in HT and cardiovascular disease [7,8]. Several study have been demonstrated that LVH is a low-grade inflammatory state, which is predominantly managed by various inflammatory cascades [9,10]. Animal studies demonstrated that inflammatory markers in fibrotic process are the main component in ventricular remodeling [11,12].
The neutrophil to lymphocyte ratio (NLR) is mostly used as are liable biomarker of systemic inflammatory status [13]. NLR is a simple and readily available marker for chronic low-grade inflammation that can be easily obtained from differential counts of white blood cell (WBC) subtypes [14]. Based on aforementioned results, the present study aimed to investigate whether NLR are associated with LV remodeling in newly diagnosed hypertensive patients.
Between January 2018 and February 2019, consecutive subjects who admitted our outpatient clinic and having newly diagnosed essential HT were enrolled to the study. HT was defined as systolic blood pressure (SBP) ≥ 140 mmHg and/or a diastolic blood pressure (DBP) ≥ 90 mmHg (blood pressure taken from three seperate measurements in office in seated position) and SBP ≥ 130 mmHg and/or DBP ≥ 80 mmHg based on the mean 24-h circadian ambulatory blood pressure monitoring [15].
The exclusion criteria were defined as any condition that has a capability to alter cardiac structures and functions: patients with a history of anti-hypertensive drug therapy, secondary HT, history of coronary artery disease, cardiomyopathy, a body mass index (BMI) over 30 kg/m2, diabetes mellitus, renal failure, chronic inflammatory disease, gestational HT, congenital heart disease, LV systolic dysfunction (ejection fraction < 50%), atrial fibrillation, liver disease, obstructive sleep apnea, valvular heart disease, patients with active infection, and WBC count of > 12 × 103/µl or < 4 × 10³/µl.
All patients underwent a complete medical assessment, physical examination, blood analyze, electrocardiography (ECG), and transthoracic echocardiography (TTE). The institutional ethics committee approved the study protocol.
All echocardiographic examinations were performed using a Vivid 5 Pro device (General Electric, Horten, Norway) with a 2.5 MHz transducer. The measurements were performed in the left lateral decubitus position as recommended by current guideline American Society of Echocardiography [16], and three consecutive cycles were avaraged for each parameter. Standard echocardiographic analysis included two dimensional, M-mode, Doppler flow, and tissue Doppler flow measurements. Diastolic interventricular septum thickness (IVS), diastolic posterior wall thickness (PWT), left atrial (LA) diameter, left ventricle end systolic (LVESD) and end diastolic dimensions (LVEDD) were measured from parasternal long-axis view. Ejection fraction (EF) was calculated by using modified Simpson method. Mitral early diastolic velocity (E), mitral late diastolic velocity (A) were recorded from the apical transducer position of the sample volume situated between the mitral leaflet tips, and the ratio of E to A (E/A ratio) was calculated. Myocardial early diastolic velocity (Em) and myocardial late diastolic velocity (Am) wave velocities were measured with the sample volume using PWD from the mitral lateral and septal annulus.
LV mass (LVM) was calculated from M-mode echocardiograpy using the American Society of Echocardiography recommended Cube formula as following [16]:
LVM (g) = 0.8 × 1.04 [(IVS + PWT+ LVEDD)3 - LVEDD3] + 0.6
LVM was divided by body surface area to obtain the LVM index (LVMI, g/m2), which cut-off values of 115 g/m2 and 95 g/m2 for men and women respectively. Body surface area (m2) was calculated using the Du Bois formula [weight (kg)0.425 × height (cm)0.725 × 0.007184]. Relative wall thickness (RWT = 2 × PWT in end diastole/LV diastolic diameter in end diastole) was calculated. Normal RWT was defined as values ≤ 0.42 and increased RWT as > 0.42 [16]. Patients with increased LVMI and increased RWT were considered to have CH, and those with increased LVMI and normal RWT were considered to have EH. Those with normal LVMI and increased or normal RWT were considered to have concentric remodeling CR or NG, respectively.
Diastolic dysfunction was classified by mitral inflow pattern according to recent guidelines [17]. Grade I diastolic dysfunction was defined as E/A ratio of less than 0.8 along with a peak velocity of ≤ 50 cm/sec and normal left atrial pressure (LAP); grade II diastolic dysfunction was characterized by an E/A ratio > 0.8 but < 2 and increased LAP; and grade III diastolic dysfunction was defined as an E/A ratio of greater than 2 and increased LAP.
After a 12-h fasting period, bloods samples were obtained from the cephalic vein using a traumatic venipuncture and mixed with EDTA. Complete WBC counts, including neutrophil and lymphocyte counts, were measured using an automated hematology analyzer CELL-DYN Ruby (Abbott Diagnostics, Abbott Park, IL, USA) and expressed as × 1.000 cells/mm3. Hemoglobin and platelet count were also calculated. NLR was calculated by dividing the neutrophil count by the lymphocyte count, and platelet to lymphocyte ratio (PLR) was calculated as the number platelets divided by the lymphocyte count, both of which were obtained from the same blood samples. Plasma triglyceride, low-density lipoprotein, high-density lipoprotein, glucose, creatinine, uric acid and C-reactive protein (CRP) were analyzed on the Architect c8000 Chemistry System (Abbott Diagnostics, USA) using commercial kits (Abbott).
All analyses were performed using SPSS 17.0 (SPSS for Windows 17.0, Chiacago, IL). Continuous variables were presented as the mean ± standard deviation. Categorical variables were presented as frequencies and percentages. Kolmogorov Smirnov test was used to determine whether the continuous variables were distributed normally. Comparisons of categorical variables between the groups were conducted using the chi-square test. Analysis of variance (ANOVA) was used in the analysis of continuous variables. Pearson's correlation test was used for the variables with a linear correlation and Spearman's correlation test was used for those without a linear correlation. Lineer regression analysis was used to determine which variables affects LVMI. 95.0% confidence intervals (95.0% CI) were determined. A two-tailed p-value of 0.05 was considered statistically significant.
A total of 383 consecutive subjects with newly diagnosed essential HT were initially enrolled to the study. Forty-five patients were excluded owing to diabetes mellitus, 20 patients due to chronic renal insufficiency, 60 patients due to ischemic heart disease, 25 patients due to moderate or severe valvular heart disease, and 11 patients due to secondary HT. Consequently, measurements were obtained from 222 patients with newly diagnosed essential HT in this study (mean age: 53.2 ± 10.0 years, male: 112 patients). In the present study, four different LV geometric patterns were determined according to LVMI and RWT: (i) 58 patients with NG group, (ii) 60 patients with CR group, (iii) 50 patients with EH group, and (iv) 54 patients with CH group.
Comparison of baseline and echocardiographic characteristics of the groups were presented in Table 1. There was no statistically difference in terms of age, sex, smoking, and BMI among the groups (p > 0.05, for all). SBP, DBP, EF, LVEDD, LVESD, IVS, PWT, LA diameter, RWT, LV mass, E/A, and E/Em values were different among the groups (p < 0.05, for all). The measurements of SBP, DBP, LVMI and the ratio E/Em were increasing, while the ratio of E/A was decreasing from NG group to the CH group.
Table 1: Potential drug classes for therapy in PIH/placental dysfunction. View Table 1
Comparison of laboratory characteristics of the groups were demonstrated in Table 2. No significant difference was found among the groups regarding hemoglobin, WBC counts, platelet, fasting glucose, creatinine, low-density lipoprotein cholesterol, triglyceride, CRP levels. Neutrophils, lymphocytes, NLR, PLR, total cholesterol, high-density lipoprotein cholesterol, and uric acid levels were different among the groups (p < 0.05, for all). The highest NLR and PLR levels were observed in the EH and CH groups compared with other groups (p < 0.05, for all). Also, NLR and PLR levels of the NG and CR groups were similar (p < 0.05, for all). Comparison of NLR levels is shown in Figure 1.
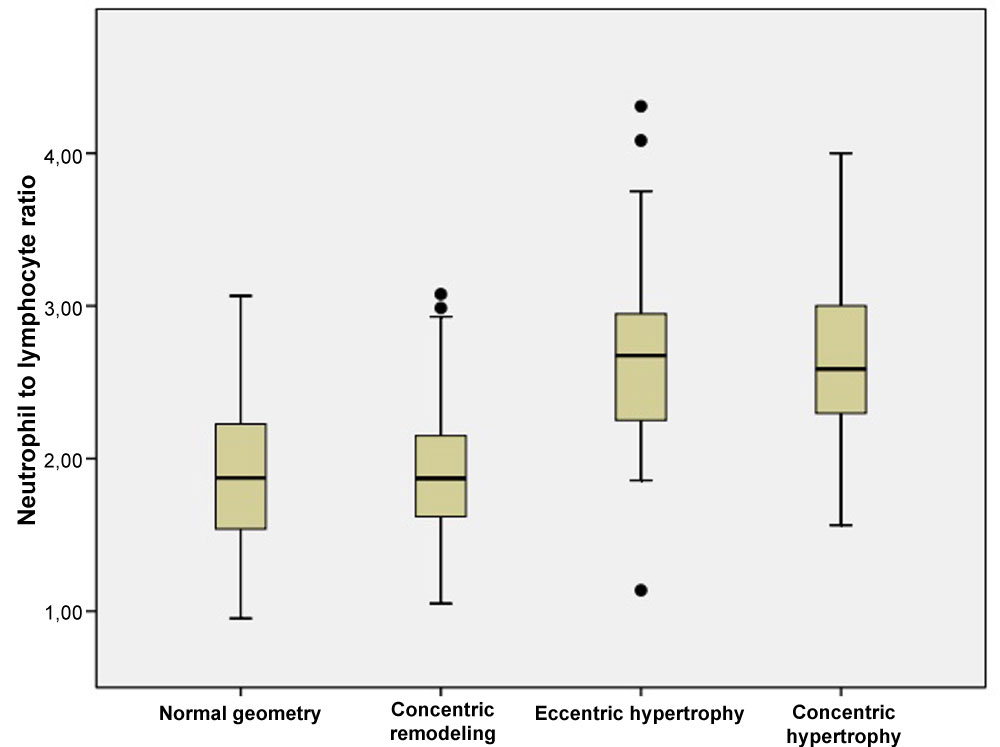 Figure 1: The relationship between neutrophil to lymphocyte ratio and different left ventricle geometry patterns. View Figure 1
Table 2: Comparison of laboratory parameters in the study groups. View Table 2
Pearson correlation analyses showed that LVMI was correlated positively and moderately with NLR (r = 0.508, p < 0.001) and weakly with PLR (r = 0.229, p = 0.001) (Figure 2). In addition, Sperman's correlation analyses demonstrated that SBP and DBP were correlated positively and weakly with NLR (r = 0.293, p < 0.001 and r = 0.227, p = 0.001, respectively) (Figure 3 and Figure 4).
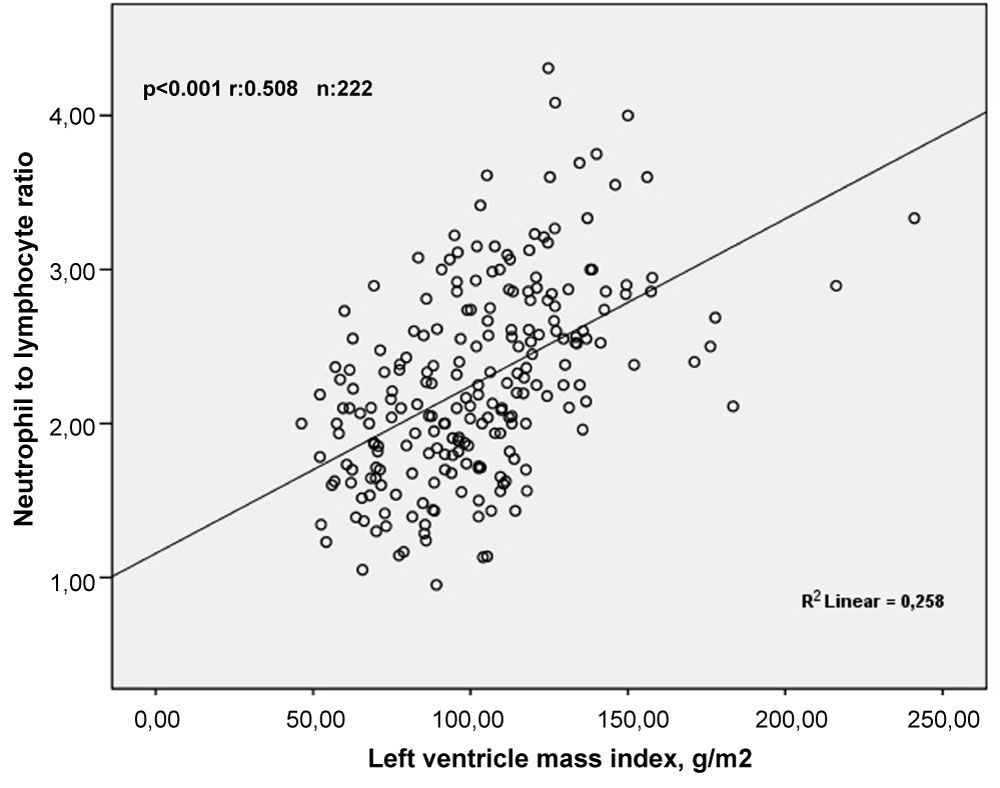 Figure 2: The relationship between neutrophil to lymphocyte ratio and left ventricle mass index. View Figure 2
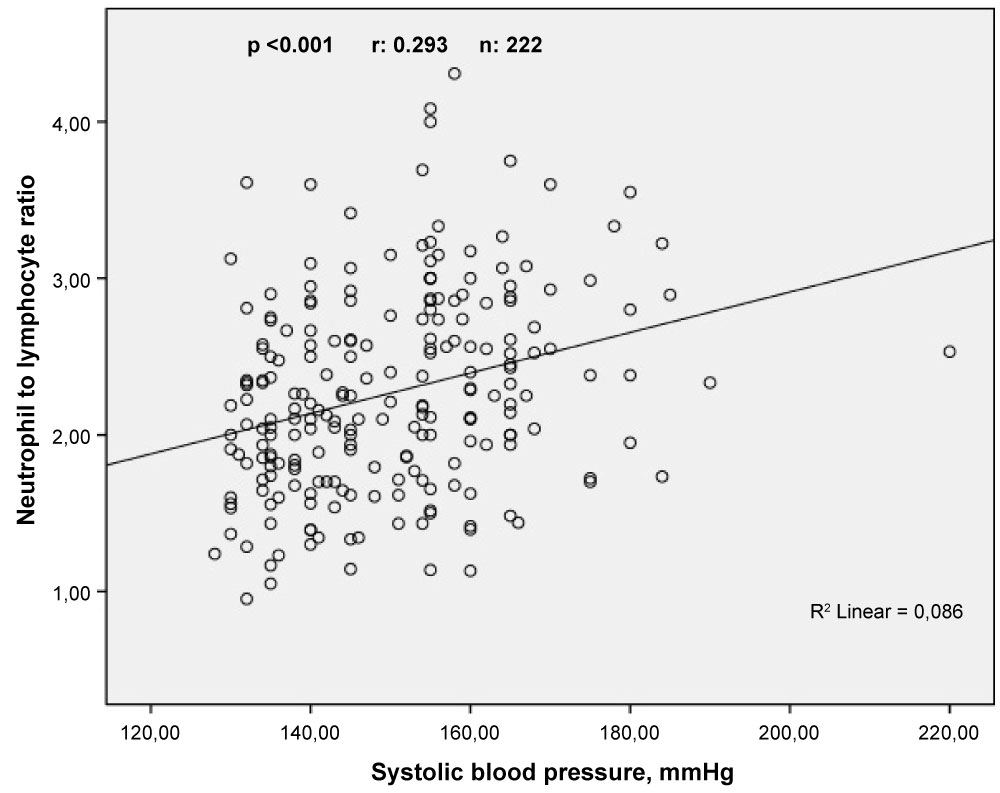 Figure 3: The relationship between neutrophil to lymphocyte ratio and systolic blood pressure. View Figure 3
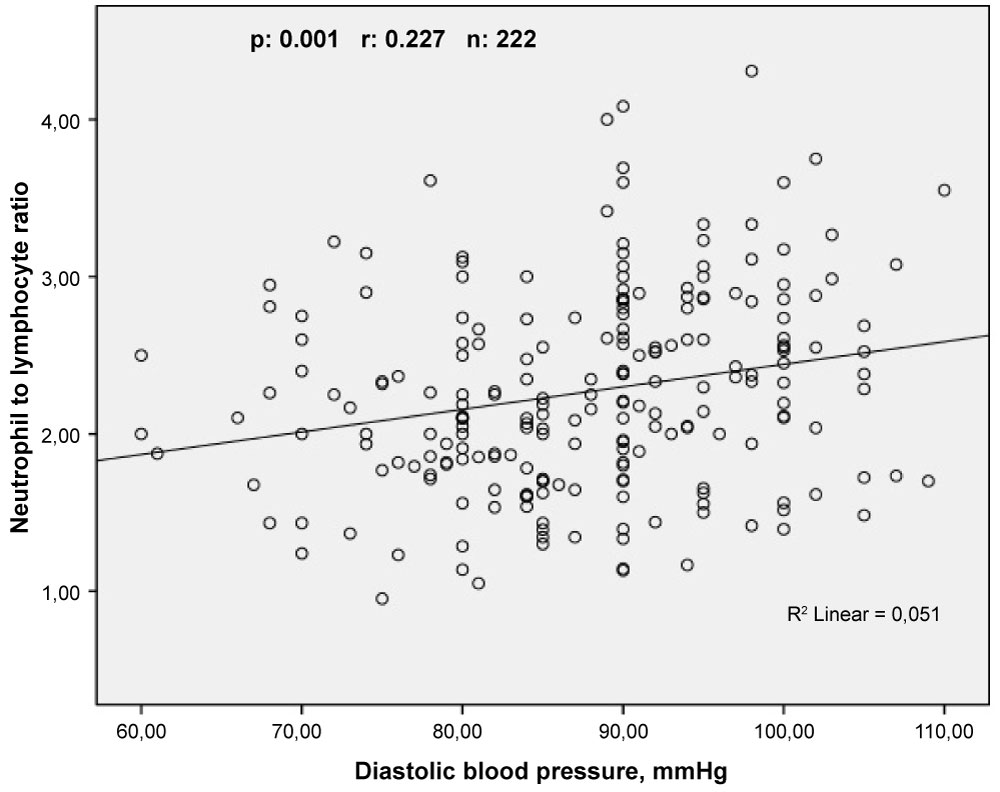 Figure 4: The relationship between neutrophil to lymphocyte ratio and diastolic blood pressure. View Figure 4
Linear regression analysis show that LVMI was independently correlated with NLR (β = 5.440, 95% CI: 9.259 - 21.715; p < 0.001), SBP (β = 0.284, 95% CI: 0.313 - 0.883; p < 0.001), EF (β = -0.201, 95% CI: -168.55 - -0.967; p < 0.001), E/A (β = -2.270, 95% CI: -168.55 - -0.967; p = 0.24), and high-density lipoprotein cholesterol (β = -0.245, 95% CI: -1.376̶-0.553; p < 0.001) (Table 3).
Table 3: Linear regression analysis for predictors of left ventricular mass index in patients newly diagnosed essential hypertension. View Table 3
This is the first study which investigated the relationship between NLR and different LV geometry patterns in newly diagnosed hypertensive patients. In the present study, the major finding is that in patients with newly diagnosed HT, the NLR and PLR that were measured on admission were both significantly higher in patients with EH and CH. There was a positive and significant correlation between NLR and LVMI, SBP, and DBP. Moreover, we found that NLR is an independent predictor of LVH in newly diagnosed hypertensive patients.
In clinical studies, LVH is generally indentified as LVMI and it develops in response to chronic pressure and volume overload, which are responsible for cardiomyocyte hypertrophy and cardiac fibrosis. In addition, non-hemodynamic factors such as age, sex, obesity, body size, insulin, and the renin-angiotensin system contribute to LVH development [18]. Also, non-hemodynamic factors, including transforming growth factor β1, tumor necrosis factor-alpha (TNF-a), and cytokines plays an important role in LV remodelling [19,20].
The physiological response of leukocytes to systemic inflammatory conditions is an increase in the number of neutrophils and a corresponding decrease in the relative lymphocyte count. WBC counts and its subtypes, such as neutrophil and lymphocyte, have an important role in modulating the inflammatory respose in the atherosclerotic process [21], heart failure [22], aortic stenosis [23], HT [24] and LVH [25]. For this reason, the NLR is used as a biomarker of subclinical inflammation. In many studies, a higher NLR is generally correlated with high mortality and poor prognosis in cardiovascular disease [21,22]. Hypertrophic geometric patterns (EH, CH) are associated with poor prognosis in hypertensive patients [26]. In the present study, we found that NLR was higher in eccentric and concentric LV geometric patterns.
Rosello Lleti, et al. was assessed the 251 hypertensive patients in a study, and demonstrated that hypertensive patients with LVH had a higher inflammatory cytokine levels than the hypertensive patients without hypertrophy [24]. In addition, the authors of this study showed that TNF-receptor was an independent predictor of LVH. Cai, et al. [27] demonstrated that pro-inflammatory factors (TNF-a and IL-6) promote left ventricular remodelling in different stage of HT. At the same time, it should be noted that the literature data in terms of pro-inflammatory cytokine is unclear. But, Leibowitz, et al. [28] demonstrated that hypertensive patients with higher LVM were inconsistent with cytokine levels when compared to those with normal LVM. A recent study demonstrated that there was no association between TNF-α levels and LVH in hypertensive patients. In the same study, the authors emphasized that the lack of an increase in TNF-α levels does not exclude the presence of an active level of this cytokine in the plasma, because of its soluble receptors, which change during HT [29]. In an experimental research, macrophage activation and accumulation in myocardium is a critical step in acute cardiac inflammatory response to high blood pressure [30].
In recent years, many studies have investigated the relationship between NLR, HT, and LVMI. Shi, et al. [20] demonstrated that a strong correlation between WBC counts (particularly neutrophil counts) and LVMI in hypertensive patients currently taking anti-hypertensive medication. Our findings are consistent with this study results, and we showed that NLR was positively correlated whit LVH in CH and EH groups. In another study [31], it has been demonstrated that NLR and monocyte levels were significantly higher in the non-dipper hypertensive patients compared with the dipper hypertensive patients. This study enrolled patients who have chronic HT and receiving appropriate antihypertensive medications, as well. A recent study indicated that higher NLR levels in hypertensive patients over 80 years of age admitted to the hospital are good predictors for all-cause mortality 90 days after admission [32].
Several studies indicated that increased platelet activity was associated with the severity of inflammation [33,34]. PLR, which is an another marker, can play an importante role in the inflammatory processes. It has been proposed that PLR was a predictive and prognostic marker for coronary artery disease [35]. In addition, PLR was significantly higher in the non-dipper hypertensive patients than in the dipper hypertensive patients [36]. Sunbul, et al. [37] demonstrated that patients with non-dipper hypertension had significantly higher NLR and PLR compared with patients with dipper hypertension. To the best of our knowledge, no information is available from previous studies about association between these inflammatory markers and different LV geometric patterns. We demonstrated that the NLR and PLR were associated with LVH in patients with newly diagnosed HT. Our results support the relationship between the immune system activation and the presence of LVH in patients with HT. But, this relationship has generally been shown in the literature by more specific inflammation markers such as, cytokines and adhesion molecules in both experimental and clinical studies [38,39]. Moreover, NLR and PLR from peripheral venous blood are less accurate than in vitro studies [40] suggesting that cytokines are associated with cardiac myocyte hypertrophy in predicting LVH. Therefore, we can say that the power of our study is lower.
As LVH effectively and independently predicts morbidity and mortality in cardiovascular disease, it is important to diagnose LVH both for clinical practice and research. In clinical practice, the diagnosis of LVH usually includes ECG and TTE. ECG is widely used and routine test in all patients with HT. However, a normal ECG doesn't excluded the presence of LVH due to its low sensitivity [41]. M-mode echocardiography is currently the standard clinical diagnosis method for LVH [26]. Data from real-time three dimensional (3D) echocardiography with regarding to LVM were performed few studies [42]. Even so, 3D echocardiographic LVM data available in normal subjects are not sufficient and its use in clinical practice is not recommended [16]. Cardiac magnetic resonance imaging is a very accurate method for LVH detection. It is recommended for clinical trials investigating LVM regression [41]. Nonetheless, its use in clinical practice is quite difficult and expensive. The present study showed that NLR measured on admission might be usefull marker to predict the LVMI. It is convenient marker and can be easily measured blood samples.
The limitations of the present study are as follows. (i) The current study included a relatively small number of patents, and didn't include control group. (ii) Only one measurement of admission full blood count and calculation of PLR and NLR were included in the analysis. (iii) Although, many studies have demonstrated relationships between cytokines and LVH, we didn't evaluate cytokines in the present study. (iv) These type of studies do not establish causality.
Our study suggested that NLR and PLR are related with different LV geometry patterns in hypertensive patients, which has not been reported previously. Also, NLR was an independent predictor of LVH in hypertensive patients. The present study demonstrated that NLR might be a useful and cost-effective marker to evaluate LVH in newly diagnosed hypertensive patients. However, larger scale studies are needed to support these results.
This study received no grant from any funding agency in the public, commercial or not-for-profit sectors.