To describe the association of the amplitude of the photoplethysmographic waveform (PPG) with arterial pulse pressure (PP) and surrogates of vascular tone.
In 26 anesthetized patients PPG amplitude, invasive arterial blood pressure, estimated vascular compliance (Cvasc) and Doppler resistive index (RI)/mean flow velocity (Vm) were recorded during changes in arterial blood pressure. These variables were analyzed as: 1) Group-averaged analysis: 20 beats were selected at different arterial pressure levels in each patient and then pooled together with data from all patients; 2) Individual analysis: PPG amplitude was correlated with PP and Cvasc beat-by-beat during ~ 5-10 minute recordings.
Group-averaged analysis included 111 episodes of arterial pressure variations. PPG amplitude decreased by 38% during hypertension (median 25 and 1st/3rd quartiles [24-41]%, p = 0.0001) and increased by 25% during hypotension (50[40-63]%, p = 0.0205) when compared to normotension (40[30-50]%). PP was higher (65[55-76] mmHg, p < 0.0001) and lower (30[27-39] mmHg, p < 0.0001) during hypertension and hypotension respectively when compared to normotension (44[38-51] mmHg). No statistical differences in RI were observed at different arterial pressure levels. At normotension, Vm was higher (20[14-25] cm/s) than during hypertension (18[10-26] cm/s; p = 0.0238) but lower compared to hypotension (21[15-26] cm/s; p = 0.0043). Beat by beat PPG amplitude was well correlated with PP (median rho = -0.84 [95% CI-0.98 to -0.73] and with CVasc (median rho = 0.96 [95% CI 0.99 to 0.85]; all p < 0.0001).
Simple photoplethysmographic waveform analysis can provide reliable, real-time, non-invasive information regarding the status of the vascular tone helping to discriminate the cause of changes in arterial pressure in anesthetized patients.
Arterial blood pressure, Photoplethysmography, Vascular tone, Arterial compliance
ABP: Arterial Blood Pressure; ASA: American Society Anesthesiology physical status classification; Cvasc: Estimated Vascular Compliance; ECG: Electrocardiogram; DAP: Diastolicarterial Blood Pressure; IRB: Institutional Review Board; MAP: Mean Arterial Blood Pressure; PEEP: Positive End-Expiratory Pressure; PPG: Photoplethysmographic; PP: Pulse Pressure; RI: Resistive Index; SAP: Systolic Arterial Blood Pressure; SVR: Systemic Vascular Resistance; Vm: Mean Flow Velocity; ∆PPGmax: The maximum value of the discrete derivative in the PPG signal; ∆PPmax: The maximum value of the discrete derivative in the arterial blood pressure signal
During general anesthesia sudden and sometimes substantial changes in arterial blood pressure (ABP) are common and can potentially affect patients' outcome [1-4]. These arterial hypertensive or hypotensive crises are caused by different mechanisms. The most common ones include changes in vascular tone mediated by alterations in the sympathetic activity and vasodilation induced byanesthetic drugs [5,6]. While monitoring ABP is simple and accessible, monitoring of vascular tone is uncommon, intermittent, operator-dependent (i.e. Doppler, tonometry) usually needing invasive hemodynamic monitoring systems (i.e. pulmonary artery catheter).
We recently described a photoplethysmography (PPG) waveform contour analysis based classification of changes in vascular tone in cardiac surgery patients [7]. PPG amplitude and notch positioning changed in response to modifications in vascular impedance [8,9] and were correlated well with ABP, systemic vascular resistance (SVR) and vascular compliance. Thus, changes in ABP mediated by modifications in vascular tone could be accurately diagnosed by observing changes in the shape of PPG waveforms on the pulse oximeter's monitor display [7].
However, some studies have reported only a weak to moderate correlation between PPG amplitude and SVR in cardiac surgery patients [10-12]. For instance, Awad, et al. found modest correlations i.e. r = -0.15 and r = -0.24 at finger or ear PPG probe positioning, respectively [10]. Similarly, Middleton, et al. using low frequency power analysis of PPG waveform amplitude, found correlations of r = -0.54 [12]. This rather poor correspondence between PPG waveforms with ABP and vascular tone however, does not match well with our daily clinical observations in the operating theater. We commonly observe that sudden changes in PPG amplitude correspond with instantaneous, beat by beat changes in ABP mediated by alterations in vascular tone. We speculate that inter-individual variability in local finger's perfusion may well be among the principal reasons explaining the disparity among studies and clinical observations when data of different patients is averaged and pooled.
We hypothesized that PPG waveform is closely associated to ABP and vascular tone on a real time and individual basis. The aim of this study was to test the ability of PPG amplitude in detecting real time changes in ABP caused by alterations in vascular tone. To this end we compared changes in finger PPG with invasive radial ABP and surrogates of vascular tone such as estimated vascular compliance and Doppler derived-parameters of the radial artery.
This is a prospective observational study performed at the anesthesia department in a community hospital. Part of this data that belongs to cardiac surgery patients was published previously [7]. In the current study, after IRB approval and trial registration (Clinicaltrials.org NTC02854852) we analyzed unpublished data belonging to patients undergoing non-cardiac surgery in which Doppler was simultaneously assessed at the tested hand. Inclusion criteria were written informed consent, age ≥ 20-years-old, American Society Anesthesiology physical status classification (ASA) ≤ 3 and surgeries with indication of invasive arterial blood pressure monitoring in the supine position. Exclusion criteria were emergency surgery, central hypothermia (naso-pharyngeal temperature < 36 °C), and patients with arrhythmias.
Routine monitoring included ECG, time-based capnography, pulse oximetry and naso-pharyngeal/hand temperature (S5, Datex-Ohmeda, Helsinki, Finland). Anesthesia was induced with propofol 1-1.5 mg.kg-1, vecuronium 0.06 mg.kg-1 and fentanyl 3 μ.kg-1 and maintained with propofol 80 μ.kg-1 min-1 and remifentanyl 0.5 μ.kg-1 min-1. Lungs were ventilated in volume-controlled ventilation using the Advance workstation (GE Healthcare, Madison, WI, US) with a tidal volume of 6 ml.kg-1 of predicted body weight, respiratory rate of 15 breaths min-1, positive end-expiratory pressure (PEEP) of 5 cmH2O, I:E ratio of 1:2 and FIO2 of 0.4. Intraoperative hemodynamic management was based on standard anesthesia care as described previously [7].
A radial artery 20 G catheter was placed under local anesthesia before induction. Pressure transducer was zeroed at the heart level. Invasive systolic (SAP), mean (MAP) and diastolic (DAP) arterial pressures were continuously recorded with the S5 device (GE, Datex-Ohmeda, Helsinki, Finland). Arterial blood normotension, hypertension and hypotension were defined as SAP of 90-140; > 140 and < 90 mmHg, respectively [13,14]. Pulse pressure (PP) was calculated as the foot-to-peak distance in the ABP waveform (Figure 1).
The tested hand was maintained at the heart level and the local skin temperature at 33-35 °C using a warming mattress. PPG was obtained by a pulse oximeter placed at the index finger (S5 device, GE, Datex-Ohmeda, Helsinki, Finland). The PPG amplitude was computed as the foot to peak distance and was expressed in an arbitrary 0-to-100% scale (Figure 1).
Arterial wall elasticity was defined by the estimated vascular compliance (Cvasc); which was calculated as the change in vascular blood volume produced by a change in blood pressure in one beat as described and validated by Jagomagi, et al. [15]. Cvasc was defined beat-by-beat using the PPG and ABP signals as:
CVasc = ∆PPGmax/∆PPmax
Where, ∆PPGmax is the maximum value of the discrete derivative in the PPG signal while ∆PPmax is the maximum value of the discrete derivative in the arterial blood pressure signal. Both PPG and ABP series of discrete derivatives were filtered using the Savitzky-Golay FIR filter and any deformed or corrupted beat was segmented and deleted from analysis. Analysis was performed off-line on Matlab® (Mathworks, Natick, MA, USA).
The analysis was conducted with the ultrasound MyLab Gamma device (Esaote, Genova, Italy) using a linear probe of 6-12 MHz. Duplex Doppler of the radial artery was performed by the same investigator using the snuff box technique [16]. This technique allows ultrasound incidence angles lower than 60°. The echograph automatically calculates the resistive index (RI = systolic peak velocity - diastolic velocity/systolic peak velocity) and the mean flow velocity (Vm) [17-19]. In each patient, periods of arterial blood normo, hyper and hypotension were studied with a triple Doppler measurement. The mean RI and Vm values were registered in the database (mean value of ~15 pulse waves).
Hemodynamic and pulse-oximetry variables were continuously recorded and stored in a laptop using a customized data-collection system. Data was processed and analyzed off-line in two different ways:
Group-averaged analysis: Episodes of different ABP values (normotension, hypertension and hypotension) were recorded during ~ 5 minutes. In each file we arbitrarily selected and analyzed the CVasc of 20 representative beats and the mean value for each variable together with the Doppler measured RI and Vm were used to build the database. Data from all patients were then pooled.
Individual and beat-by-beat analysis: During changes in blood pressure, PPG and ABP continuous recordings of ~10 minutes were obtained from the multiparametric monitor (Figure 1). The synchronized PPG and ABP signals were analyzed with Matlab® (Mathworks, Natick, MA, USA) as described above. PPG amplitude, PP and Cvasc were computed in each beat.
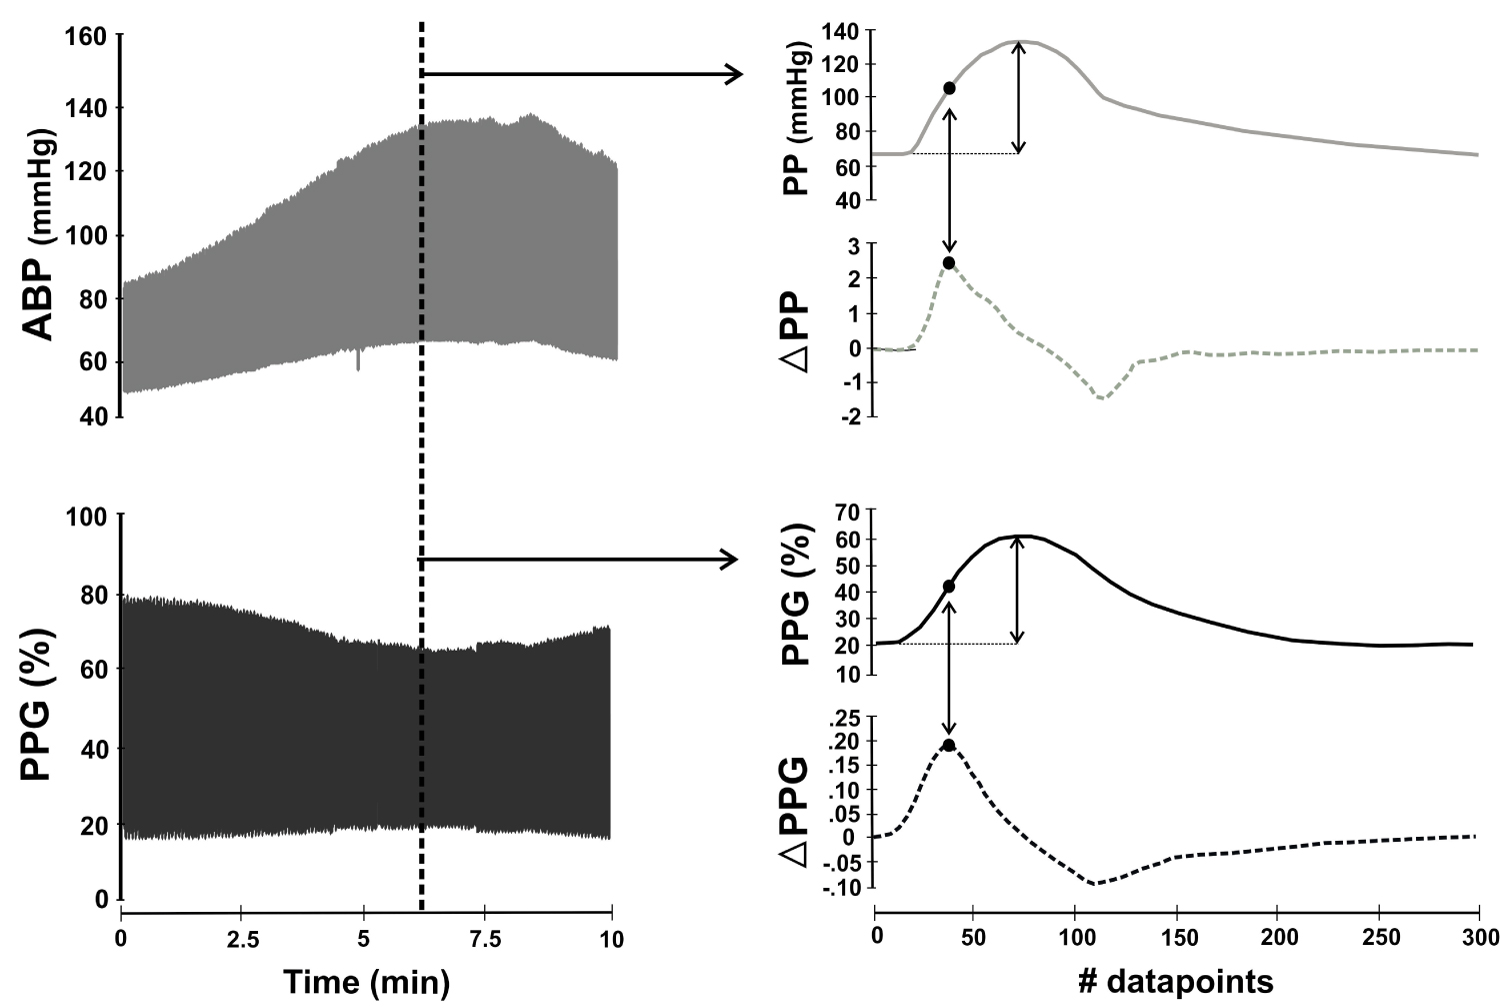 Figure 1: Calculation of vascular compliance (CVasc).
Synchronized arterial blood pressure (ABP) and photoplethysmography (PPG) signals were continuously recorded during surgery. The vertical dotted line in the right pannel selects a pair of ABP and PPG waveforms presented in the right pannel. In both waveforms, amplitude was measured as the foot-to-peak distance. Cvasc was calculated beat-by-beat as ∆PPGmax/∆PPmax; where ∆PPGmax is the maximum value of the discrete derivative in the PPG signal while ∆PPmax is the maximum value of the discrete derivative in the arterial blood pressure signal (black dots). ABP and PPG amplitude together with Cvasc were calculated on a beat-by-beat basis to perform the intra-individual correlations.
View Figure 1
Statistical analysis was performed using IBM SPSS Statistic 19.0.0 (IBM Company, USA) and Matlab® (Mathworks, Natick, MA, USA). Wilcoxon rank sum test and Spearman correlation were used for comparisons between studied variables. Results are expressed as n (%) for proportions and median and 1st-3rd quartiles or 95% confidence intervalsfor continuous variables. A p value < 0.05 was considered statistically significant.
We analyzed data from thirty patients. Four patients were discarded, two due to missing data and another two because of lack of sufficient hemodynamic alterations during surgery. Thus, a total of twenty-six patients (10 females/16 males), aged 62 ± 16 years, weighted 76 ± 10 kg, ASA 2 (26%)/3 (74%) presenting at least one arterial hyper/hypotension episode were included in the analysis. They were subjected to abdominal (52%), gynecological (17%), urological (22%), neck (4.5%) and neurological (4.5%) surgeries.
Table 1 presents the main studied parameters during episodes of arterial hyper, normo and hypotension. A total of 111 episodes were included in the analysis in which PAS ranged from 68 to 201 mmHg. SAP, DAP and MAP were statistically different between studied periods (all p < 0.0001). PP was 44(38-51) mmHg and PPG amplitude 40(30-50)% during arterial blood normotension. Arterial hypertension presented 47% higher PP values (p < 0.0001) and 38% lower PPG amplitude values (p = 0.0001) compared with normotension. Arterial hypotension was related to a 32% lower PP (p < 0.0001) but a 25% higher PPG amplitude (p = 0.0205) values than compared with normotension.
Table 1: Grouped analysis of the main studied parameters during changes in arterial blood pressure. View Table 1
No statistical differences in Doppler RI were seen between ABP episodes. During normotension Vm was higher (20[14-25] cm/s) when compared to arterial hypertension (18[10-26] cm/s; p = 0.0238) but lower than during hypotensive episodes (21[15-26] cm/s; p = 0.0043) (Table 1).
Figure 2 presents an example of the Doppler analysis (flow, RI and Vm) performed in one patient during changes in ABP. These findings were closely related to their corresponding changes in PP and PPG waveform amplitudes.
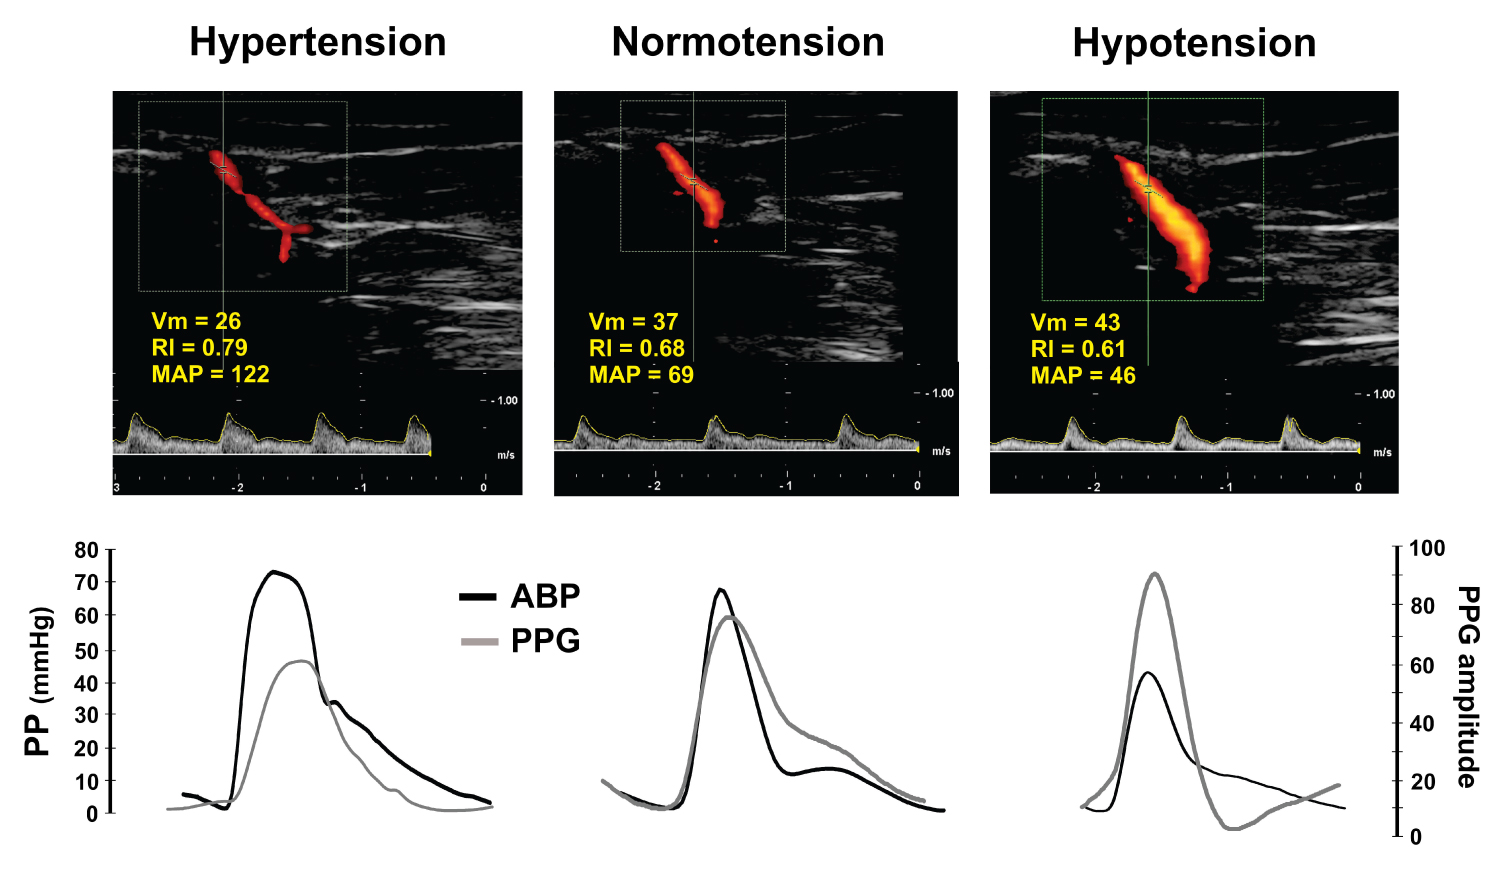 Figure 2: Dupplex Doppler with the related ABP and PPG waveforms.
Duplex Doppler analysis performed in one case obtained at different arterial blood pressure (ABP) levels. Resistive index (RI), mean blood velocity (Vm) and mean arterial blood pressure (MAP) values are shown in the upper panels. The related pulse pressure (PP) and photoplethysmographic (PPG) waveforms are depicted at the bottom. This case illustrates that Doppler, ABP and PPG are clinically related on an intra-individual basis.
View Figure 2
We obtained strong intra-individual correlations between PPG amplitude, PP amplitude and Cvasc (Table 2). PPG amplitude was negatively correlated with PP (median rho) = -0.84 [95% CI-0.98 to -0.73] and with CVasc (median rho) = -0.96 [95% CI 0.99 to 0.85]; all p < 0.0001.
Table 2: Intra-individual correlations. View Table 2
Figure 3 illustrates the PPG and ABP waveforms recorded during 10 minutes in a patient (left panel). Dots are representing waves' amplitude at each beat (middle panel), with a Rho of -0.94 (p < 0.0001).
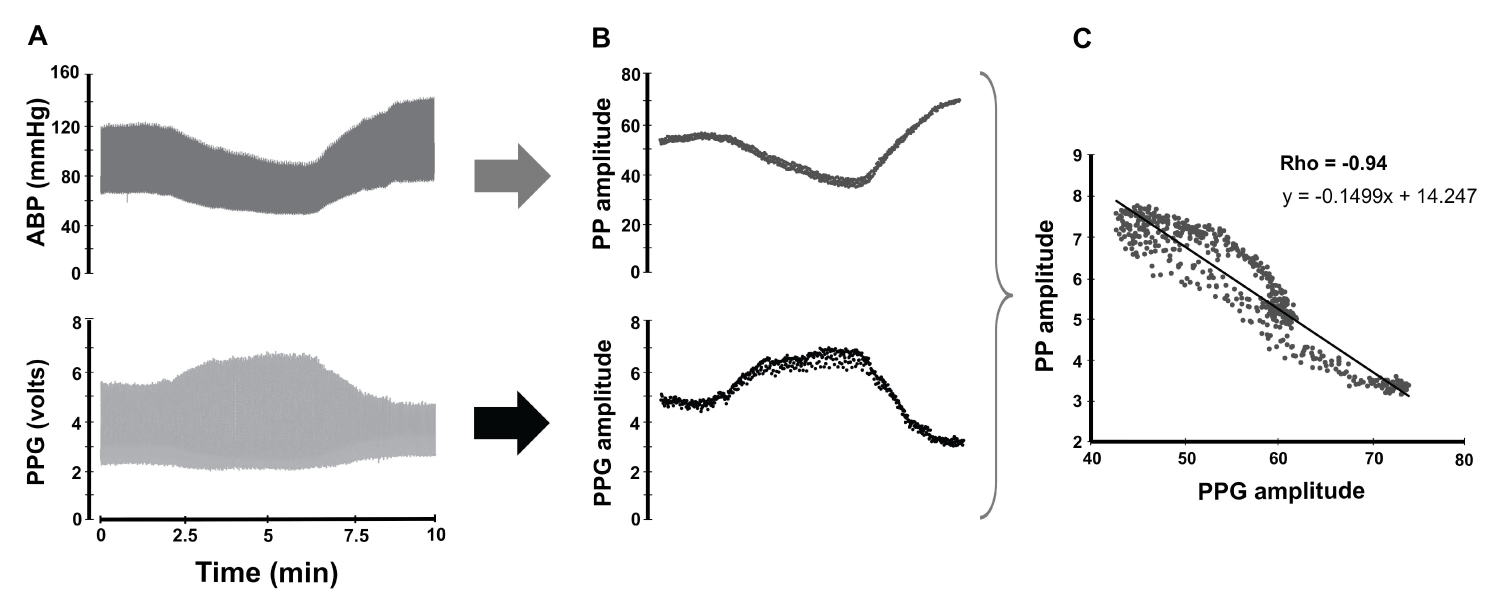 Figure 3: Correlation between arterial pulse pressure (PP) and photoplethysmography (PPG) amplitude in a beat-by-beat basis.
Synchronized arterial blood pressure (ABP) and PPG signals were collected during several minutes during anesthesia in one patient (A). The ABP amplitude (PP) and PPG amplitude of each beat are expressed as a single value and depicted as a single point (B). Each matching pair of dots was used to obtain the correlation of the entire sequence (C).
View Figure 3
Our data confirm that PPG amplitude is closely related to modifications in ABP mediated by changes in the vascular tone. We found strong individual, beat-by-beat correlations between PPG amplitude, arterial pulse pressure and estimated vascular compliance. These findings support that changes in PPG amplitude can reliably and accurately detect fast real-time clinical changes in ABP and vascular tone. Thus, a simple visual PPG contour analysis is useful to detect one of the most common mechanisms behind the changes in ABP as during anesthesia [6,7]. Intraoperative changes in arterial blood pressure occur frequently and are related to adverse consequences that can affect patient's outcome [1-4,13]. A fast, simple, non-invasive and accurate detection of such episodes can be of great value during anesthesia facilitating a proper goal-directed treatment. For example, anesthetic drug vasodilation can simulate hypovolemia and lead physicians to erroneously treat the consequent arterial blood hypotension with unnecessary intravenous fluids [20-25].
These findings together with several characteristics of PPG makes its analysis especially suited for monitoring purposes: First, it is a simple, cheap, non-invasive and continuous technology. Second, changes in PPG waveform contour can be easily visualized on the display of standard commercial pulse oximetry and multi-parametric monitors. Third, sudden changes in PPG amplitude can alert physicians when acute changes in ABP occur between intermittent NIBP cuff inflations. Fourth, it can be used during patient transport. Fifth, the related PPG analysis could be easily automatized for a fast diagnosis of changes in vascular tone.
The findings on Doppler RI and Vm were however, contradictory. In general, we found high inter-individual variability in these Doppler parameters during changes in ABP. Patients presented different spectral Doppler waveforms, RI and Vm between ABP episodes that made any pooled analysis disappointing. An example of this problem is illustrated in Figure 4 where color and spectral Doppler, RI and Vm differed between these 3 patients despite the fact that arterial blood pressure remained within the normal range. Note that PPG amplitude also changed but preserved normal shapes with the dicrotic notch positioning related to a normal vascular tone (between 15-50% of total PPG height) [7].
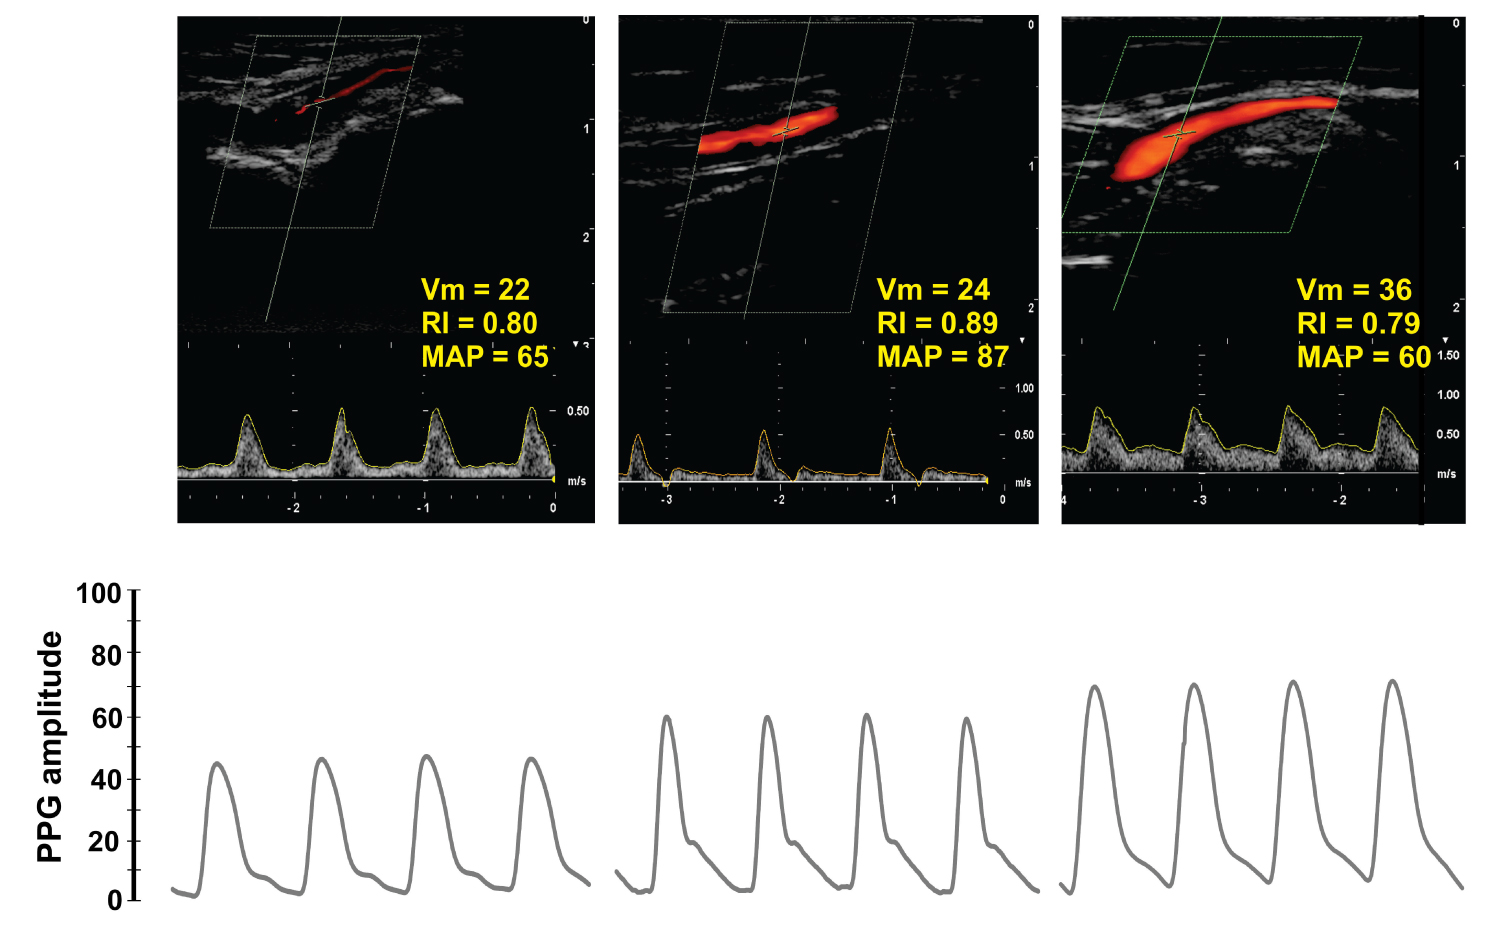 Figure 4: Dupplex Doppler and photoplethysmography (PPG) in three different patients with normal mean arterial blood pressure (MAP).
These 3 normotensive patients had different local perfusions according to Duplex Doppler, resistive index (RI) and mean velocity (Vm). Even though PPG amplitude clearly varied among patients the waveform contour, however, remained normal. The variability in local perfusion at the hand makes any inter-individual comparison between Doppler indexes and PPG amplitude of questionable validity.
View Figure 4
Nevertheless, Doppler parameters had a logical response on an individual basis as presented in Figure 2. In this patient, for example, arterial blood hypertension was related to higher RI and lower Vm when compared to arterial normo and hypotension. Thus, changes in local blood flow mediated by modifications in vascular resistance were adequately described by Doppler parameters and were closely related to the corresponding changes observed in PP and PPG amplitudes. Our results are similar to the ones found by Legarth and Nolsoe measuring RI and blood flow velocity in healthy women [19]. They found a high variability of these Doppler indexes among volunteers that limit the use of normal values for comparisons. They concluded that Doppler indexes can be used as surrogates of changes in vascular resistance only on an individual basis.
According to our findings, the PPG amplitude is also affected by the high inter-individual variability in local blood flow. This biological variability explained why Awad, et al. [10] and Middleton, et al. [12] found only weak to moderate correlations between PPG amplitude and SVR as the use of average values were used in its computation. Therefore, from a monitoring perspective, we believe that PPG is a monitoring system more suited for detecting hemodynamic changes on an intra-individual basis in a similar way as the Doppler signal.
Doppler analysis was not performed continuously during ABP changes as the ultrasound monitor cannot record more than 5-7 beats at a time. Thus, Doppler was used only for grouped-averaged data analysis while beat-by-beat calculation of vascular compliance was part of the individual-based analysis.
One important limitation is that the pulse pressure and flow waveform used to compute vascular compliance was measured in different vessels. Pulse pressure is recorded by a catheter in the radial artery but PPG is obtained from smaller vessels at the finger-tip with a different diameter, flow, wall thickness and mechanical properties, which alter local impedance. Thus, the estimated Cvasc assessed in this study represents a more global parameter that may be very different from the reference vascular compliance measured at the aorta. However, our results are similar than the one we observed in cardiac surgery patients, where Cvasc was calculated invasively using a catheter placed at the main iliac artery, closer to the aorta [7]. In this study, CVasc calculated as stroke volume over PP, obtained a good correlation with the normalized PPG amplitude (r = 0.82, p < 0.0001).
Photoplethysmography and arterial pulse pressure waveform amplitudes are closely correlated on an individual and beat-by-beat basis. Both signals changed in opposite direction anytime vascular tone (i.e. its compliance) was altered, modifying the way and velocity these flow and pressure pulse waves travel along the vascular tree. This physio-pathological behavior has important clinical implications for noninvasive hemodynamic monitoring in mechanically ventilated patients.
None.
No potential conflicts of interest exist except for Matias Madorno who is partner and manager of MBMed S.A; a company that produce respiratory monitoring equipments.
None.
GT, CMA, SP: Study design, collect data, data analysis and manuscript writing; MM, FSS, SHB: Study design and manuscript writing; AS, JMA: Statistical analysis.