The high incidence of prostate cancer (PCa) worldwide and the growing interest in overdiagnosis and overtreatment make the study of new markers imperative for helping us predict the presence and aggressiveness of PCa. The objective of this work is to evaluate the -2proPSA and Prostate Health Index Usefulness for the diagnosis of PCa.
A prospective study including 101 patients with PSA levels between 3-10 ng/mL and normal digital rectal exam (DRE) was conducted between November 2013 and November 2014. All patients underwent prostate biopsy and PSA, free PSA and -2proPSA determination. -2proPSA ratio (%2proPSA) and Prostate Health Index (PHI) were also calculated.
Patients had a mean age of 63.7 years old. The means of PSA and free PSA ratio (%fPSA) were 6.06 ng/mL and 16%, respectively. The means of -2proPSA and %2proPSA were 16.8% and 1.8%, respectively. Prostate volume mean was 46 cc and PSA density mean were 0.19 ng/cc.
In the univariate analysis, only %fPSA and PHI showed statistical significant association with the presence of tumor in prostate biopsy, whereas %2proPSA almost reached statistical significance.
In the multivariate analysis, PHI showed the best area under the curve (AUC) with a value of 0.749, followed by %fPSA (0.708) and -2proPSA (0.671).
The best values for internal and external validity of each of the evaluated parameters turned out to be for PHI, with 93% sensibility and 37% specificity, 53% positive predictive value (PPV) and 88% negative predictive value (NPV).
PHI is the parameter that allows predicting the presence of PCa more precisely for patients with normal (DRE) and PSA between 3 and 10 ng/mL.
Prostate cancer (PCa) is the most frequent neoplasia among adult men, although its elevated incidence does not translate in a higher mortality rate.
The prostate specific antigen (PSA) is a kallikrein protein family member and since the 1990s has been used as a biochemical marker for the early diagnosis of PCa. Since the introduction of PSA, we have witnessed the migration of this tumor to initial stages diagnosis, with a subsequent decrease in mortality. Even though PSA use is constantly challenged due to its low specificity, especially in what is known as the PSA grey area (between 4-10 ng/dL range), PSA is still the most utilized tumor marker for PCa [1].
In this sense, aiming to improve this parameter, new biomarkers have been studied showing varying results. PSA by-products, such as free PSA (fPSA), %fPSA (fPSA/total PSA) or PSA density (PSAD), and transitional zone PSA density have shown a limited benefit when it comes to improving PSA specificity. In this manner, between 60 to 70% of patients who undergo prostate biopsy, which was indicated based on this parameters only, end up having a negative result.
PSA is almost exclusively produced by the prostate acinar epithelium. The proPSA is an inactive precursor composed of 244 amino acids and is also secreted by the prostatic cells. There are four different isoforms of proPSA and includes integrated and truncated variants. ProPSA seems to be a more cancer specific structure of PSA, due to the fact that is specially expressed in the peripheral zone, while undetectable in the transition zone.
The -2proPSA is a free PSA truncated variant and is also the more predominant proPSA isoform isolated from prostate cancer tissues. In patients without tumor, it represents 6-20% of the total circulating free PSA [2]. However, it may reach 25-95% in patients with PCa.
Prostate Health Index (PHI) is a formula that combines Total PSA, free PSA and -2proPSA ([-2]proPSA/free PSA) × √PSA) in one score, aiming to improve cancer detection and decision making.
The objective of this work is to evaluate the usefulness of -2proPSA and PHI for the diagnosis of prostate cancer.
After approval of the hospital Ethics Committee, a prospective study was designed. All patients who underwent prostatic biopsy, fulfilling all the inclusion criteria and none of the exclusion criteria, were included in the study (Table 1).
Table 1: Inclusion and exclusion criteria. View Table 1
Patients referred to our center for prostate biopsy, as well as those indicated for biopsy directly from our outpatient clinic, were included in the study between November 2013 and November 2014. After meeting the inclusion criteria, a total of 101 patients were evaluated.
Once patients were informed about the study and after obtaining oral and written informed consent, blood samples were collected for the analysis of PSA, free PSA, and -2proPSA determinations. Subsequently, all patients underwent echodirected transrectal prostate biopsy. Twelve cores were collected in a systematic fashion, directing the punctures to the more lateral and posterior aspects of the prostate gland. All biopsies were performed as an outpatient procedure and under local anesthesia. Prostate volume was also calculated with the transrectal ultrasound.
The variables included in this study are as follows: age, PSA, %fPSA, prostatic volume, -2proPSA, %2proPSA [(-2proPSA/free PSA × 1000) × 100] and Prostate Health Index (PHI). The biopsy result, interpreted as positive or negative for tumor, was the independent variable. Intraepithelial neoplasia and atypical small acinar proliferation were interpreted as negative for tumor.
All prostate biopsies were guided with transrectal ultrasound. Following the same pattern, twelve cores were obtained, six per each prostatic lobe using 2% lidocaine as local anesthetic. A single urologist performed all biopsies. The samples were collected in color twelve individual containers and sent for analysis by two different uropathologist.
After evaluating the normal distribution of the variables with Kolmogorov-Smirnov test, a Student t-test was conducted for independent variables. In a second step, the area under the curve (AUC) was determined for the most relevant parameters. All data was processed and analyzed using the statistical package SPSS-21.
For the period between November 2013 and November 2014, a total of 115 patients were selected to participate in the study. Finally, only 101 were included. 14 patients were excluded from the study due to the presence of lower urinary tract symptoms compatible with urinary infection or because of the lack of informed consent. Population characteristics subdivided by presence vs. absence of tumor are presented in Table 2.
Table 2: Population characteristic subdivided by presence vs. absence of tumor. Univariate analysis. View Table 2
From these 101 patients, 44 cases (43.6%) had a prostatic tumor in the biopsy and 57 cases (56.4%) had a normal biopsy. The mean age of the population was 63.7 years old. The following mean values were obtained: 6.06 ng/ml for PSA, 16% for %fPSA, the -2proPSA mean was 16.8 ng/ml, 1.8% for %2proPSA, the mean prostatic volume was 46 cc and 0.19 ng/cc for PSA density. The overview of the descriptive analysis of population characteristics, subdivided by the presence vs. absence of tumor, and the results of the univariate analysis are displayed in Table 2. PSA Ratio and PHI are the only parameters that demonstrated a statistically significant association with the presence of PCa.
Table 2 presents how -2proPSA, %2proPSA and PHI showed superior central tendency measurements in the group of patients with prostate neoplasia. Nevertheless, this tendency is also exhibited by total PSA, %fPSA and PSAD. It is worth noting that prostates with tumor had a smaller mean prostate volume compared with the non-tumoral group.
The ROC curve analysis presents a greater AUC for PHI (0.749), followed by PSA ratio (0.708) and %2proPSA with a slightly lower area (0.671), and finally total PSA with the smallest AUC (0.657) (Figure 1).
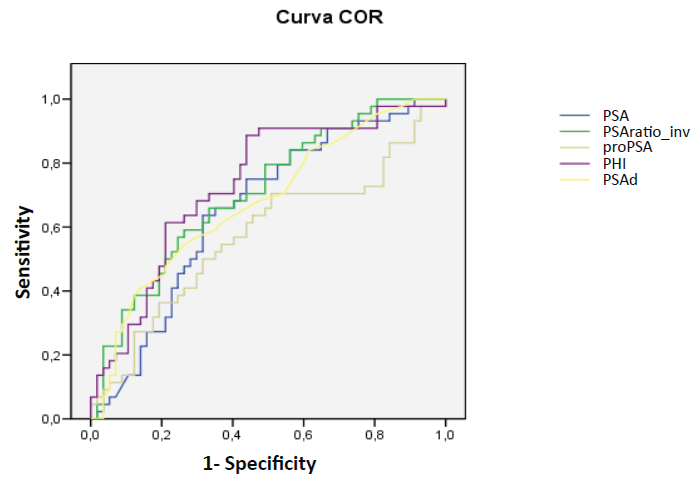 Figure 1: AUC of ROC curves for each of the variables. View Figure 1
The internal and external validity data of our PHI test, with an assigned cut-off value of 28, were: 93% Sensitivity, 37% Specificity, PPV of 53% and NPV of 88%. For the PSA ratio, with a cut-off point of 0.15, we found: 65% Sensitivity, 66% Specificity, PPV of 71% and NPV of 40%. Finally, it is worth noting that global diagnostic precision values were 29.3% for the PSA ratio and 61% for PHI.
A population sub analysis was performed. Patients were classified regarding the presence vs. absence of tumor with intermediate or high-risk Gleason score (Gleason ≥ 7). Table 3 presents the results generated by the univariate analysis.
Table 3: Intermediate or high-risk patient's sub analysis. View Table 3
As may be seen in this sub analysis, only PSA, PHI and 2proPSA were statistically significant. The ROC curve of this group of patients showed PSA and PHI with the highest AUC with 0.694 and 0.684, respectively. -2proPSA showed an AUC of 0.68 (Figure 2).
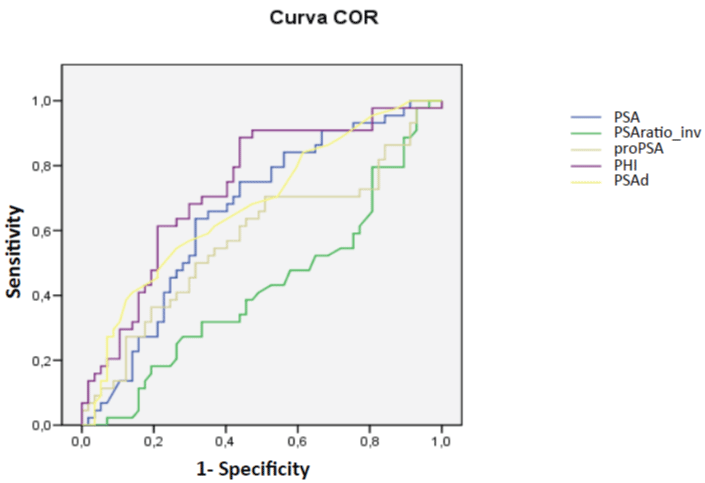 Figure 2: ROC curves of the most relevant parameters for diagnose of significant tumor. View Figure 2
After the systematic introduction of PSA as a fundamental tool for PCa evaluation, a superior number of cases have been diagnosed at the expense of finding the tumor in earlier phases. Now, the task is to identify if those “extra” early diagnostics represent a decrease in cancer-specific mortality. In this sense, researchers' efforts are being directed towards reducing the number of unnecessary biopsies (both negative biopsies, as well as clinically insignificant tumors) and the development of biomarkers with higher specificity than PSA with the ability to discriminate between clinically insignificant tumors and those who may benefit from an early radical treatment.
The PSA density and %fPSA have been broadly studied aiming to improve PSA specificity when it comes to indicate a prostate biopsy. Nevertheless, up to 8% of positive biopsies have been reported in patients with PSA ratios superior to 25% and near to 45% of negative biopsies in patients with PSA ratios inferior to 10% [1].
The -2proPSA and the index calculated from it (PHI), has been widely evaluated in diverse studies [2,3]. Both have proven to be superior than total PSA when it comes to predicting the presence of PCa, not only in the initial but also in subsequent prostate biopsies, increasing the specificity of total PSA and %fPSA for the detection of PCa in long cohorts and multicenter studies [4].
In our center, after at least two PSA determinations under optimal conditions, prostate biopsy is indicated routinely in patients older than 65-years-old with PSA higher than 4 ng/dl, and in patients either under 65-years-old or with any family history of PCa and with a PSA higher than 3 ng/dl. Routinely, we do not take into consideration %fPSA or PSAD for indication of the initial biopsy.
Some authors have reported the usefulness of -2proPSA and PHI determination on patients with lower PSA values, between 2 ng/dl and 4 ng/dl [5]. It has been described that, whereas PSA and %fPSA remained comparable among the groups with and without tumor, %2proPSA was higher in the group of patients with tumor and its specificity and AUC in the ROC curve were clearly superior. On the other hand, Catalona, et al. revealed that patients with low PSA but elevated %2proPSA tend to be diagnosed with intermediate and high-risk tumors [6].
In this case, it was decided not to modify the cut-off points indicating the prostate biopsy, until the usefulness of the new marker was proven, which can be considered a task for future investigation. Other authors have already proposed the usefulness of -2proPSA and its derivatives for the diagnosis of PCa in patients with PSA levels between 4 and 10 ng/dl [7,8] and how the risk of prostate cancer raises up to 8 times in cases where the -2proPSA is found in the superior quartile [9].
In this study, we present the results of a prospective cohort with a follow-up adherence close to 100%. Selected patients were all candidates for a first biopsy. Even though the limited number of cases may represent a limitation of the study, the patients' standardized selection and the scheme for the biopsy procedure, as well as the fact that all biopsies were performed by a single urologist, offers guarantee of homogeneity in the process that multicenter studies cannot provide.
In the univariate study, only PHI and %fPSA seem to be able to predict the presence of PCa in the prostate biopsy, whereas neither -2proPSA not %2proPSA reveled statistically significant differences, although %2proPSA was fairly close to statistical significance. It is possible that with a larger number of patients, the results may have been more in accordance with results published in previous series [10].
With the purpose of avoiding selection bias, patients with an abnormal (suggestive of tumor) digital rectal exam were excluded. In this manner, our AUC was at the level of other published series with a similar study design, such as Catalona and Guazzoni [3,4]. Other authors have included in their series patients with tumor-suspicious digital rectal exams [2], describing an AUC of 0.74, which is very similar to our findings. This fact encourages us to consider the use of PHI regarding the PSA results for future studies.
The PHI internal validity values were calculated from the quartiles obtained in our series. The cut-off point was defined by the value of the first quartile, positioning PHI at 28.2. Our results are slightly superior to other findings reported in larger population studies [4,10,11] that had also used 28 as the cut-off values for PHI, however in this study no previous sensitivity value was set. It is also important to point out that using the first quartile of the results of this study as cut-off point, only three tumors were found in the inferior values. Moreover, none of them showed a Gleason score over six, and no more than three affected cores. They were all low-risk tumors.
The detection of aggressive tumors plus a reduction of unnecessary biopsies that would detect low-risk tumors is one of the hottest topics in urology nowadays. The usefulness of -2proPSA and PHI has been widely revealed in various studies. PHI increase has been correlated with the presence of tumors with Gleason score 7 or higher [2,12,13] and also has served as the best parameter that allows differentiating the presence of aggressive tumors. Additionally, the expression of this phenomenon has also been studied in the radical prostatectomy samples, finding that PHI and %proPSA may predict the presence of tumors with Gleason score more than 7, locally advanced tumors and tumors with a higher volume.
Even though it was not the primary purpose of this study, a sub-analysis was performed to evaluate the usefulness of the diagnosis of intermediate and high-risk tumors with Gleason score of 7 or higher. In this manner, the results were less clear. In the univariate analysis, the -2proPSA seems to be the parameter that best predicts the presence of a Gleason score of 7 or higher in the prostate biopsy sample. However, in the multivariate analysis, the parameter that presented the best AUC was PSA followed by PHI and -2proPSA, although the differences were almost imperceptible. According to these results, the data does not match those published in the literature [2,14].
The suitability of -2proPSA and PHI as part of active surveillance protocols has been described previously [15]. Such role has not yet been evaluated in our series. A broader follow-up will help clarify this topic.
As described in some works, PHI application in daily practice may help spare 8 to 20% of prostate biopsies [4]. The economic impact of the use of this technique has not been deeply studied until now, some economic aspects have been published [16], they described that economic reduction is more important in the group of patients with low PSA (higher than 2 ng/dl).
In the present study, PHI has demonstrated the best AUC for the detection of PCa in the first biopsy for patients with normal digital rectal exam and PSA between 3 and 10 ng/dl. PHI has also shown a higher specificity than PSA and %fPSA for a cut-off point of 28.