Background: The manual peripheral blood smear examination is a comprehensive examination of the blood film to detect clinically significant abnormalities in leukocyte, erythrocyte, and platelet morphology. It is a time-consuming technique, but it is a more cost-effective and sensitive technique than an automated hematological analyzer. On the other hand, the automated hematology analyzer is faster, more objective, and reduces labor cost but cannot reveal the variety of abnormal cells. This study aims to find out the correlation of peripheral blood smear examination with RBC indices and histograms obtained from an automated hematological analyzer in diagnosis and morphological typing of anemia.
Objective: To compare the finding of the manual peripheral blood smear examination with red cell indices and histograms obtained from an automated hematological analyzer in anemic patients.
Method: A comparative cross-sectional study was conducted by using a convenient sampling technique. A total of 250 blood samples were analyzed from July 25-Oct 25, 2022 at Jimma medical center. About 3 ml of blood samples were collected for the analysis into an EDTA anticoagulated tube. Kappa statistics were used to measure the agreement between the two methods. The final results were presented by tables and figures.
Result: The manual peripheral blood smear examination revealed that the predominant morphological typing of anemia was microcytic hypochromic anemia (45.2%), while normocytic normochromic anemia (48.0%) was the most common anemia based on red cell indices and histogram patterns obtained from the automated hematological analyzer. The sensitivity and specificity of the red cell indices and histograms were 85.8% and 94.1% for microcytic hypochromic anemia, 91.6% and 84.6% for normocytic normochromic anemia and 91.7% and 98.7% for macrocytic normochromic anemia respectively.
Conclusion and recommendation: There was a statistically significant difference (p = 0.000) between the manual peripheral blood smear examination and the automated hematological analyzer. A manual peripheral blood smear examination should be used in addition to the automated hematological analyzer for a better diagnosis and management of anemia.
Histograms, Peripheral blood smear, Red cell indices
CBC: Complete Blood Count; CLSI: Clinical and Laboratory Standard Institute; EDTA: Ethylene Diamine Tetra-Acetic Acid; JMC: Jimma Medical Center; MCH: Mean Corpuscular Hemoglobin; MCHC: Mean Corpuscular Hemoglobin Concentration; MCV: Mean Cell Volume; NPV: Negative Predictive Value; PBS Peripheral Blood Smear; PLT: Platelet, PPV: Positive Predictive Value; RBCs: Red Blood Cells; RDW: Red Cell Distribution Width; SOP: Standard Operating Procedure; SPSS: Statistical Package For Social Science; WBCs: White Blood Cells; WHO: World Health Organization
Anemia is a reduction in the total number of red blood cells or hemoglobin in the blood, resulting in a condition in which the red blood cells do not transport enough oxygen to the body's tissues [1,2]. It affects more than 2 billion individuals worldwide, accounting for 30 percent of the world population, and preschool children and pregnant women were mostly affected globally [3].
The investigation of anemia can be performed by either a manual procedure, such as manual hemoglobin, manual hematocrit, and manual peripheral blood smear examination or an automated hematological analyzer, and the microscopic examination of a peripheral blood smear provides the clinician with a lot of information [4]. Morphologically, anemia can be classified as microcytic, normocytic, or macrocytic based on red blood cell (RBC) size [5].
A peripheral blood smear examination can reveal an abnormal red cell shape, which can be used to diagnose several types of anemia; the red cell morphology evaluation should involve an inspection for deviations in size, shape, distribution, hemoglobin content, and the appearance of inclusions [6]. Furthermore, a peripheral blood smear examination can confirm "flagged" results from an automated hematology analyzer [7].
The automated hematological analyzer is faster, more objective, and free of the subjective errors that occur with the manual peripheral blood smear examination [8]. As a result, the automated hematology analyzer has improved accuracy, can analyze a higher number of samples with more speed and precision, and reduces the need for human intervention in test entry, sampling, sample dilution, and analysis [9].
The automated hematology analyzer reduces the labor cost but creates decision making problem to finalize the diagnosis and cannot reveal the variety of abnormal cells [10,11]. On the other hand, peripheral blood smear examination is time-consuming and prone to inter-observer variation but it is a more cost-effective and sensitive technique than an automated hematological analyzer [5].
In most automated laboratories, peripheral blood smear examinations are limited to cases where the instrument "flags" the potential presence of abnormal cells or where findings may interfere with analysis and in cases when there is clinical suspicion of leukemia, an examination of the peripheral blood smear is required to make the presumptive diagnosis [12].
In modern hospital and clinical settings, the automated hematology analyzer with complete blood count results has become the cornerstone of modern laboratories and has replaced the manual methods for common hematological parameters [13]. In most institutions, the practice of reviewing all automated hematology analyzer results by preparing a stained blood film for microscopic examination is no longer practiced [10].
Reducing the number of manual scans of peripheral blood smears for the result of an automated hematological analyzer increases the release of less accurate results, which has a detrimental impact on the diagnosis and treatment of anemia [5].
Automated hematology analyzers are the most important instruments in today‘s clinical laboratory, however, in some cases, it requires operator intervention or a confirmatory test, such as a peripheral blood smear review and a manual differential cell count, and these additional steps impact laboratory turnaround time, efficiency, and labor costs, which have a negative impact on patient management [14].
The inability of automated hematology analyzers to reliably distinguish cells from other particles or cell fragments of the same volume, e.g., fragmented RBCs may be counted as platelets, resulting in an incorrectly increased platelet count and decreased WBC and RBC counts, and larger platelet clumps may be counted as WBCs, resulting in a falsely decreased platelet count and potentially an increase in WBC count, resulting in an inaccurate diagnosis and impact the diagnosis and clinical management of various hematological disorders [15].
The PBS examination and an automated hematology analyzer have shown some discordance in the investigation of anemia. The PBS examination revealed additional information in 11.4% and 13.9% of cases in India and Israel, respectively [16,17]. Furthermore, in Malawi, 69.5% of PBS examinations provided additional information to CBC, indicating an automation error [18].
In a study conducted in Ethiopia, the rate of peripheral blood smear examination was very low among general hospitals and district hospitals, which was 14.9% and 6.5%, respectively and patient outcomes were delayed due to a lack of strengthened PBS examination services [19]. Hence, this alarms us to assess the correlation of the PBS examination with the automated hematology analyzers in the study area, which lacks specific data despite the heavy burden of anemia in the area.
Generally, method comparison is very important in improving the quality of laboratory services. So this study aims to find out the correlation of the manual peripheral blood smear examination with RBC indices and histograms obtained from an automated hematological analyzer in anemic patients.
The study was conducted at Jimma Medical Center (JMC) in southwest Ethiopia. It is located in Jimma town, 345 kilometers away from the capital city of Ethiopia, and the town has a highland climate with considerable rainfall, and a long rainy season. The town is located at an elevation of 1763 meters above sea level. It also has a latitude of 7°40'N and a longitude of 36°50'E. A comparative cross-sectional study was conducted from July 25-October 25, 2022.
All anemic patients requested for CBC analysis by an automated hematological analyzer and meet the sample acceptance and rejection criteria according to standard operating procedure (SOP) at JMC during the study period.
According to the Clinical and Laboratory Standard Institute (CLSI) 2013 guideline, a minimum of 40 specimens are required for method comparison studies [20]. By considering cost, time, and method used to conduct this study a total of 250 specimens were analyzed. A non-probability convenient sampling technique was used.
Inclusion criteria
• Blood samples of all anemic patients of both sexes and all age groups as per the WHO reference range were included in the study.
Exclusion criteria:
• Leftover patient samples which were insufficient to carry out the study.
• Patient samples with an incomplete request form were excluded.
Variables:
• PBS examination
• Red cell indices
• RBC Histograms
About 3 ml of whole blood specimens was collected by the phlebotomists into a tube containing EDTA anticoagulant from patients of all ages and sex groups for CBC analysis and transferred to the hematology laboratory department. The samples were analyzed by Beckman Coulter UniCel DxH 800 (Danaher Corporation, United states) automated CBC analyzer, simultaneously the blood smears were prepared and stained with the wright stain for peripheral blood smear examination under the microscope. The request forms were used to collect information about the patient's age, gender, and clinical diagnosis.
The data was checked for completeness, cleaned, arranged and categorized manually and then entered into Epi data version 4.6. Then exported and analyzed using statistical package for social science (SPSS) version 25 software. Normality of the data was checked by Kolmogorov-smirnov and Shapiro-wilk tests. Descriptive statistics were used to express the demographic characteristics and other variables as needed of the study population. Kappa statistics were used to measure the agreement between the two methods. Sensitivity, Specificity, PPV and NPV were computed. Chi-square test was used to know the association between the two methods. The p-value < 0.05 were considered statistically significant. The results were presented with tables and figures.
Patient identification and labeling were done with care, and samples were collected and transported without delay. Clotted, mislabeled, inadequate, strongly lipemic and hemolyzed samples were rejected. Blood film for a peripheral blood smear examination was prepared with care by skilled medical laboratory technologists and the slides were reviewed by two trained laboratory technologist to ensure quality results. SOP and manufacturer instruction was followed during every step of the test performed. Supervision was made in every step of data collection. To avoid any clerical error, printout results that were generated by the analyzers were used and the result of a peripheral blood smear was recorded with extreme care. Then the results from both methods were confidentially documented, recorded, and analyzed using SPSS version 25.
The study was conducted after getting ethical clearance from the institutional review board (IRB) of the Institute of Health, Jimma University. An official support letter of request to conduct the study was written to Jimma Medical Center to obtain approval and carry out the study. Informed consent was taken from the study participant and leftover specimen from the CBC analysis was used only for the intended purposes. All information collected was kept confidential.
A total of 250 anemic patient samples were included in the study. Out of 250 blood samples, 104 (41.6%) males and 146 (58.4%) females samples were analyzed. The majority of the participant age was between 15-29 years, which accounts for about 93 (37.2%), followed by < 14 years, which accounts for about 79 (31.6%) (Table 1).
Table 1: Demographic characteristics of the study population. View Table 1
Based on the hemoglobin level obtained from the automated hematological analyzer, out of the 250 anemic blood samples analyzed, 111 (44.4%) were severe anemia, followed by 92 (36.8%) moderate anemia (Table 2).
Table 2: Degree of severity of anemia based on Hgb value. View Table 2
The most common morphological type of anemia revealed by the manual peripheral blood smear examination was microcytic hypochromic anemia 113 (45.2%), followed by normocytic normochromic anemia 107 (42.8%) respectively (Table 3).
Table 3: Shows morphological typing of anemia based on the manual peripheral blood smear examination. View Table 3
From the findings of the red cell indices, the predominant morphological typing of anemia found using the red cell indices was normocytic normochromic anemia 120 (48.0%), followed by microcytic hypochromic anemia 105 (42.0%) (Table 4) . The histograms obtained from the analyzer predominantly showed a normal curve in about 107 (42.8%) of cases, followed by left shift in 103 (41.2%) of cases, respectively (Table 5).
Table 4: Shows the morphological typing of anemia using red cell indices obtained from an automated hematological analyzer. View Table 4
Table 5: Shows the histograms patterns obtained from an automated hematological analyzer. View Table 5
From the total of 120 normocytic normochromic anemia found based on the red cell indices, 104 (86.6%) showed a normal curve, and about 11 (9.2%), 2 (2.7%), 2 (2.7%), and 1 (0.8%) showed bimodal, left shift, broad, and right shift histogram patterns, respectively. Out of 105 microcytic hypochromic anemia found from the red cell indices, the majority showed a left shift histogram pattern, which was about 101 (96.2%), followed by 3 (2.9%), and 1 (0.9%), normal curve, and bimodal histogram patterns respectively. From 25 cases of macrocytic normochromic anemia, the majority of the histogram pattern showed a right shift, which was about 15 (60.0%), followed by 7 (28.0%), and 3 (12.0%), broad and bimodal histogram patterns, respectively (Figure 1).
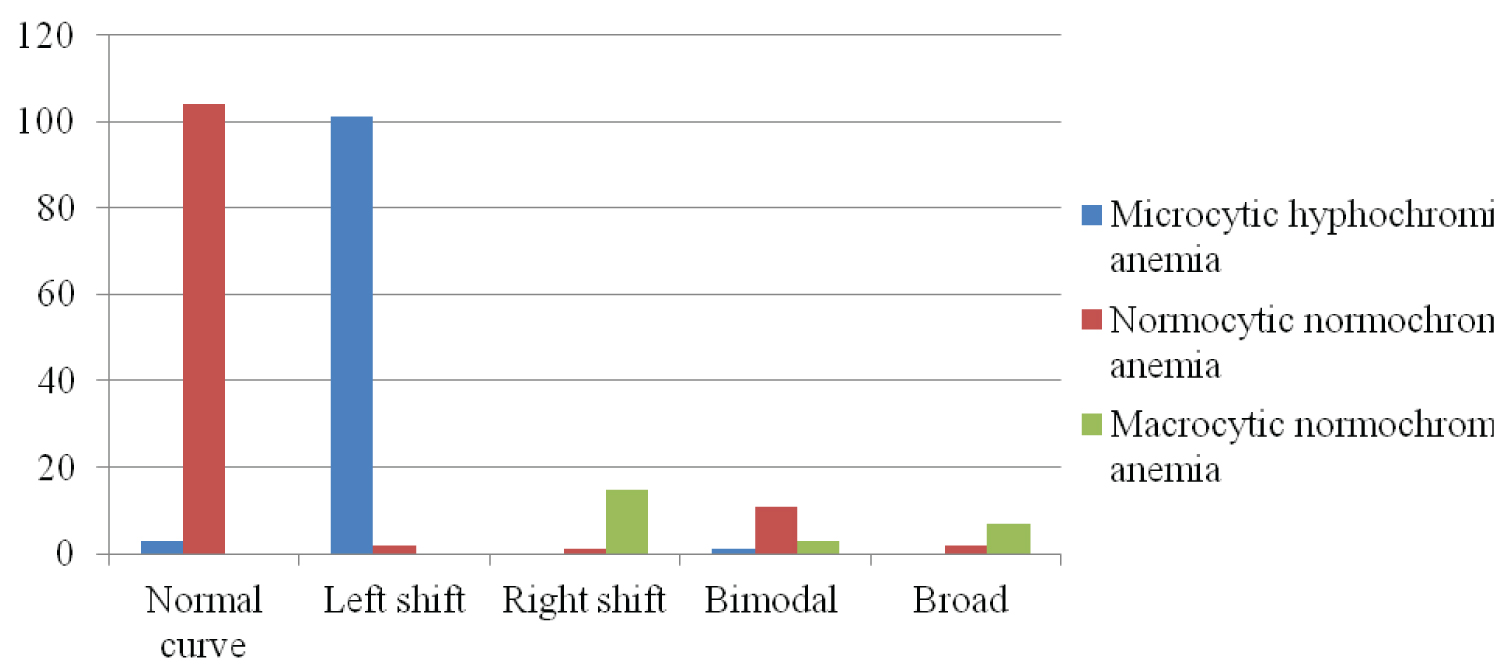 Figure 1: Shows the histograms patterns for the morphologically typed anemia based on red cell indices.
View Figure 1
Figure 1: Shows the histograms patterns for the morphologically typed anemia based on red cell indices.
View Figure 1
Out of the 250 blood samples analyzed, 98 (39.2%) were normocytic normochromic anemia, 97 (38.8%) were microcytic hypochromic anemia, and 22 (8.8%) were macrocytic normochromic anemia with both methods. Cohen’s kappa coefficient (k) was 0.8, which shows a strong agreement between the two methods. The concordant and discordant rates between the two methods were 86.8% and 13.2%, respectively. There was a statistically significant difference (p = 0.000) between the two methods in the morphological typing of anemia (Table 6).
Table 6: Shows the correlation of manual peripheral blood smear examination and red cell indices obtained from an automated hematology analyzer. View Table 6
From the total of 113 microcytic hypochromic anemia found from the peripheral blood smear examination, about 98 (86.7%) showed a left shift, 13 (11.5%) showed a normal curve, 1 (0.9%) showed a bimodal and 1 (0.9%) showed a broad histogram patterns. From 107 cases of normocytic normochromic anemia found from the PBS examination, about 94 (87.8%) showed a normal curve, and about 6 (5.6%), 5 (4.6%), and 2 (1.8%) showed bimodal, left shift, and broad histogram patterns, respectively. From the 24 macrocytic normochromic anemia cases found from the PBS examination, 16 (66.7%) showed a right shift, and 6 (25.0%) and 2 (8.3%) showed broad and bimodal histogram pattern, respectively. All cases of dimorphic anemia found from PBS examination showed bimodal histogram pattern on the automated hematology analyzer. There was a statistically significant difference (P = 0.000) between the PBS examination and the RBC histogram patterns. Cohen’s kappa coefficient was k = 0.8, which shows a strong agreement between the histogram patterns and the PBS examination (Figure 2).
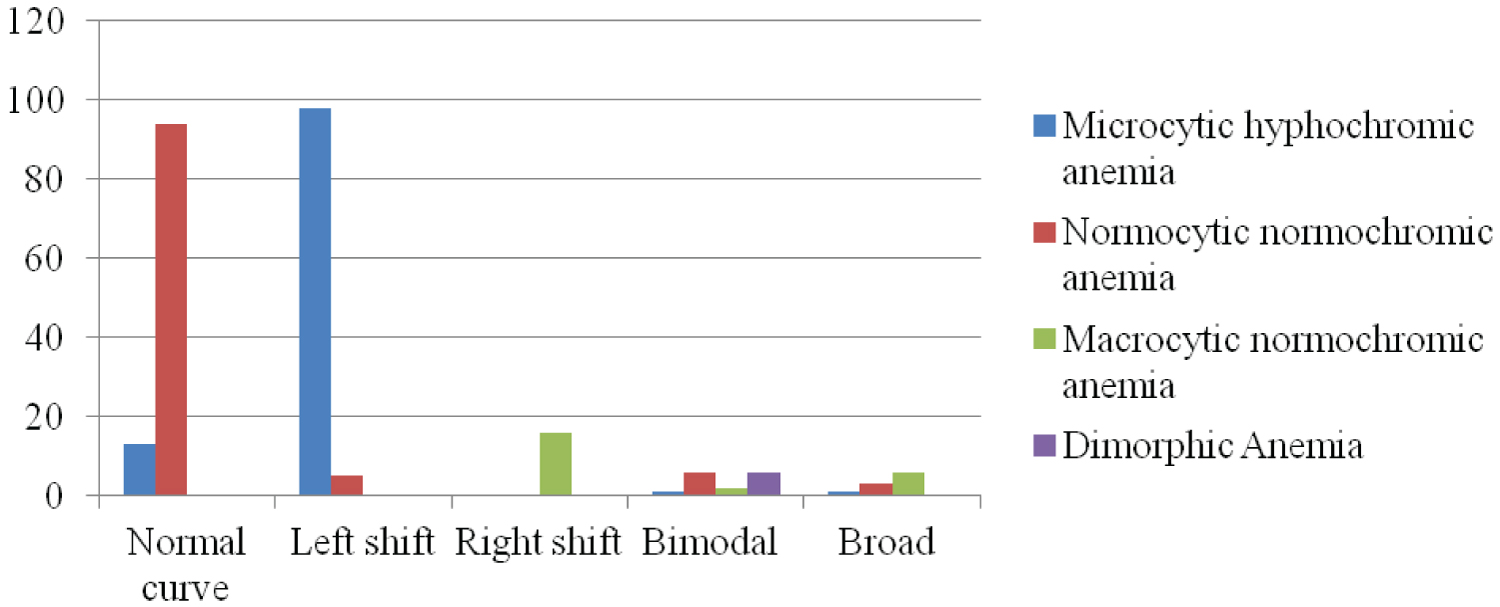 Figure 2: Shows the correlation of morphologically typed anemia by PBS examination with the histogram patterns obtained from the automated hematological analyzer.
View Figure 2
Figure 2: Shows the correlation of morphologically typed anemia by PBS examination with the histogram patterns obtained from the automated hematological analyzer.
View Figure 2
The sensitivity, specificity, PPV, and NPV of the red cell indices and histograms obtained from an automated hematological analyzer for morphological typing of anemia were calculated by taking the peripheral blood smear as the gold standard test and comparing the findings of the red cell indices and histograms with the findings of the peripheral blood smear. So, the sensitivity, specificity, PPV, and NPV of the red cell indices and histograms obtained from the automated analyzer were 85.8%, 94.1%, 92.4%, and 88.9% for microcytic hypochromic anemia, 91.6%, 84.6%, 81.7%, and 93.1% for normocytic normochromic anemia and 91.7%, 98.7%, 88.0%, and 99.1% for macrocytic normochromic anemia respectively (Table 7).
Table 7: Shows the sensitivity, Specificity, PPV, and NPV of RBC indices and histograms obtained from Beckman Coulter UniCel DxH-800 automated hematological analyzer. View Table 7
From the total of 250 blood samples analyzed, 175 (70%) showed an increased RDW and about 75 (30%) showed a normal RDW on the automated hematological analyzer. From the findings of the manual peripheral blood smear examination, anisocytosis was seen in about 167 (66.8%) and not seen in 83 (33.2%) cases. Increased RDW and anisocytosis were found in 160 of the cases, and normal RDW with no anisocytosis were found in 68 of the cases. The concordant and discordant rates between RDW and anisocytosis were 91.2% and 8.8% respectively. There was a statistically significant difference (p = 0.000) between the RDW and anisocytosis (Table 8).
Table 8: Shows the correlation of the RDW obtained from the automated hematological analyzer with anisocytosis in PBS examination. View Table 8
Peripheral blood examination has served as a window into hematological developments for decades. The analysis of blood films regularly has aided in the interpretation and diagnosis of many hematological disorders and has served as a key diagnostic tool, particularly in the investigation of anemia [21]. Nowadays, the use of an automated hematology analyzer in a hematology laboratory is regarded as a routine as well as an essential requirement [22].
In this study, the findings of the manual peripheral blood smear examination and the red cell indices and histogram patterns obtained from the automated hematology analyzers were compared. According to this study, of the total of 250 anemic samples 58.4% female and 41.6% male samples were analyzed. The major types of anemia based on the Hgb level were severe anemia in 44.4% of cases followed by 36.8% cases of moderate anemia.
An initial morphological classification of anemia that incorporates red blood cell indices and peripheral blood smear examination is likely, to be the most effective [23]. According to the findings of this study, 45.2% of cases had microcytic hypochromic anemia by manual peripheral blood smear examination. Microcytic hypochromic anemia was associated with iron deficiency, pregnancy, menstrual blood loss, and malignancy [24]. These findings were comparable with the study conducted by Sandhya V, et al. [25], Bhatt N, et al. [26], Rao B, et al. [27], Jain A, et al. [28], Singhal S, et al. [8], Jansari T, et al. [29], Choudhary S, et al. [22] and Ashok C, et al. [30] in which microcytic hypochromic anemia was the predominant anemia found with the findings of PBS examination.
The findings differ from a study conducted by Samly D, et al. [31] in which the most common morphological type of anemia was normocytic normochromic anemia in 57.0% of cases. This difference may be due to the difference in the study area; according to Samly D, et al. [31] chronic kidney disease and decreased marrow response were the major causes of normocytic normochromic anemia in India and the sample size difference may be another reason for the varation, in the study of Samly D, et al. [31] 110 samples were used, which were half of the sample size of this study.
On the other hand, in contrast to the PBS examination, the predominant anemia with the findings of the red cell indices obtained from the automated hematological analyzer was normocytic normochromic anemia, which was in 48.0% of cases. These findings were comparable with the study conducted by Samly D, et al. [31] in which normocytic normochromic anemia was the predominant anemia, followed by microcytic hypochromic anemia, by the automated hematological analyzer. However, the findings of this research were different from a study conducted by Jain A, et al. [28], Singhal S, et al. [8], Jansari T, et al. [29], Garg M, et al. [32], and Ashok C, et al. [30] in which microcytic hypochromic anemia was the predominant anemia followed by normocytic normochromic anemia by the result of red cell indices obtained from an automated hematology analyzer.
In this study, the concordance between RBC indices and peripheral smear examination in morphological typing of anemia was 86.8%, and the discordance rate was 13.2%. According to this study, about 13.2% of cases required a peripheral smear review, showing that manual review of blood smears was helpful at least in some cases as it provided additional information for the proper morphological classification of anemia. The discordance can be due to the presence of abnormal red cell shapes which was seen on the PBS examination such as pencil cells, tear drop cells, burr cells, schistocytes, target cells, sickle cells, agglutinated RBCs, fragmented RBCs, spherocytes and so on that were not detected by an automated hematology analyzer. These findings were similar to a study conducted by Singhal S, et al. [8], and Venukumar M, et al. [33] in which concordant and discordant rates were 88.6% and 11.4%, and 87.75% and 12.25% respectively.
These findings was higher than the concordant and discordant rates reported by Farah E, et al. [5], Choudhary S, et al. [22], and Sandhya V, et al. [25] studies, which were 78% and 22%, 67% and 33%, and 51.8%, and 48.2%, respectively. This difference may be due to the different analyzers used; in this study, Beckman Coulter's UniCel DxH-800 automated analyzer was used, whereas in the study conducted by Choudhary S, et al. [22] SYSMEX XS-1000i was used. Another factor contributing to the disparity was the difference in sample size; in the study of Choudhary S, et al. [22] about 600 anemic patient samples were used, which were three times higher than the sample size of this study.
A peripheral blood smear examination is often used as the gold standard for the diagnosis of numerous RBC, white blood cell, and PLT disorders [34]. In this study, the sensitivity, specificity, PPV, and NPV of the red cell indices obtained from the automated hematological analyzer were determined by taking the PBS examination as the gold standard method. According to the findings of this study, the sensitivity of the red cell indices was 85.8%, 91.6%, and 91.7% for microcytic, normocytic, and macrocytic anemia, respectively. This finding was lower than a study done by Jansari T, et al. [29], where the sensitivity of the red cell indices was 94.2%, 96.7%, and 98.2% for microcytic, normocytic, and macrocytic anemia, respectively. According to the findings of this study, the specificity of the red cell indices and histograms was 94.1%, 84.6%, and 98.7% for microcytic, normocytic, and macrocytic anemia, respectively. These findings were comparable with a study done by Venukumar M, et al. [33] in which the specificity of the red cell indices were 91%, 90.5%, and 97.5% for microcytic, normocytic, and macrocytic anemia, respectively.
These findings was higher than a study conducted by Jansari T, et al. [29], Choudhary S, et al. [22] in which the specificity of the red cell indices were 63.1%, 49.1% and 90.3%, and 64.2%, 47.8%, and 98.7% for microcytic, normocytic and macrocytic anemia, respectively. This difference in sensitivity and specificity of the red cell indices and histograms obtained from the automated hematology analyzer may be due to the different analyzers used in different studies. In the study of Jansari T, et al. [29] SYSMEX KX-21 was used, and in the study of Choudhary S, et al. [22] SYSMEX XS-1000i was used. Sample size difference may be the other factor contributes for the difference; in the study of Jansari T, et al. [29] and Choudhary S, et al. [22] 130 and 600 anemic patient samples were used, respectively, in this study 250 anemic patient samples were used.
Histogram in association with RBC indices and peripheral blood smears helps in the diagnosis and management of anemia [35]. According to the findings of this study, the histograms obtained from the analyzer predominantly showed a normal curve in about 107 (42.8%) cases, followed by a left shift in 103 (41.2%), and about 16 (6.4%), 15 (6.0%), and 9 (3.6%) were right shift, bimodal, and broad histogram patterns, respectively.
The microcytic hypochromic anemia found on the peripheral blood smear examination showed a left-shift histogram pattern in 86.7% of cases. The normocytic normochromic anemia showed a normal curve in 87.8% of cases. All cases of dimorphic anemia showed a bimodal histogram pattern. Seeing these comparison histograms is a useful diagnostic aid in the cases of normocytic normochromic anemia, microcytic hypochromic anemia, and dimorphic anemia. This findings was comparable with the study conducted by Ashok C, et al. [30]. The macrocytic normochromic anemia showed a right shift in 66.7% of cases and broad histogram pattern in 25.0% of cases. Because of the presence of microcytic red cells or small fragmented cells alongside the macrocytic cells, the histogram patterns expanded and form broad base in the case of macrocytic normochromic anemia.
• Peripheral blood smears were reviewed with two trained laboratory technologist.
• Total number of samples for the agreement study was made doubled from that of the minimum CLSI guideline requirement.
• Limited studies were available on similar analyzer models, making comparison difficult.
According to this study, there was a statistically significant difference (p < 0.000) between a manual PBS examination and the red cell indices and histogram patterns obtained from an automated hematological analyzer. There was a strong agreement (k = 0.8) on the morphological typing of anemia between the manual PBS examination and the automated analyzer.
Therefore, morphological typing of anemia by incorporating manual peripheral blood smear examination with RBC indices and histograms obtained from an automated hematological analyzer is very useful, provide brief result, and make diagnosis of anemia easier.
Based on the findings from this study,
• A manual peripheral blood smear examination should be considered as an important laboratory procedure for the investigation of anemia because it provides additional information to the automated hematology analyzer in the diagnosis of anemia.
• Most Clinical Laboratories should practice the use of both methods in diagnosis and morphological typing of anemia in order to make the diagnosis of anemia easier.
• Further studies on the comparison between the manual methods and the automated hematological analyzers should be done by including the others hematological parameters like total Rbcs count, total Wbcs count, Hgb, Hct, platelets etc.
We would like to thank Jimma medical center laboratory for their support to conduct the study.
Writing - original draft: Woyesa Beyene; Manuscript preparation: Woyesa Beyene; Co-authors: Tilahun Yemane, Edosa Tadese, Dereje Abebe, Mahder Girma, Fisum Abebe, Menberu Wubete; Investigation: Woyesa Beyene
Methodology: Woyesa Beyene; Supervision: Woyesa Beyene, Tilahun Yemane, Edosa Tadese.