Human heart is a strong muscle that pumps blood to the body. A normal, healthy adult heart is about the size of human clenched fist and it is like an engine that makes a car works, moves and functions properly as such, the heart keeps the body running. A healthy heart supplies the body with just the right amount of blood at the right rate for whatever the body is doing at that time. The flow of blood to the heart could be reduced by plaque build-up or blockage by a plaque suddenly ruptures, these could cause angina (chest pain or discomfort) or a heart attack. When the heart muscle does not get enough oxygen and blood nutrients, the heart muscle cells will die (heart attack) and weaken the heart, diminishing its ability to pump blood to the rest of the body. Remark that, if one is observing some unusual feeling in the heart, chest or in some related areas, this could result to carrying out an Electrocardiogram (ECG) test or examination. In this study, six factors (Sex, Weight, Height, Systolic Blood Pressure (SBP), Diastolic Blood Pressure (DBP) and Heart Rate (HR)) were considered and investigated using factorial experiments to see those main effect(s) and interaction effect(s) that are significant in determining the activities of PR-interval in Electrocardiogram examination. The effect of Sex is the most significant of all the treatment effects considered, followed by the effects of Height and HR, while other factors were shown to have very little effect. Hence, it could be concluded that Sex, Height and HR are the most important factors influencing PR Interval in the ECG examination in order to evaluate the metabolic disorders, effects and side effects of pharmacotherapy, and the evaluation of primary and secondary cardiomyopathic processes, among others.
Electrocardiogram, PR-interval, QRS-complex, Heart rate, Blood pressure, Factorial experiments, Experimental runs, Treatment effect
Heart disease is caused by atherosclerosis (ath-uh-roh-skluh-roh-sis) (https://www.nhlbi.nih.gov/health-topics/atherosclerosis), which is the build-up of fatty deposits, or plaques, in the walls of the coronary arteries over many years. The coronary arteries surround the outside of the heart and supply blood nutrients and oxygen to the heart muscle. Whenever the plaque builds up inside the arteries, there is less space for blood to flow normally and delivers oxygen to the heart. The flow of blood to the heart could be reduced by plaque build-up or blockage by a plaque suddenly ruptures, these could cause angina (https://www.nhlbi.nih.gov/health-topics/angina) (chest pain or discomfort) or a heart attack. When the heart muscle does not get enough oxygen and blood nutrients, the heart muscle cells will die (heart attack) and weaken the heart, diminishing its ability to pump blood to the rest of the body. In testing for the heart disease, the doctor will check blood pressure (https://www.nia.nih.gov/health/high-blood-pressure) and do a fasting blood test to check cholesterol, a type of fatty substance that can contribute to plaques in the arteries. Blood test may also be carried out to check the levels of proteins that are markers of inflammation in the body and suggest presence or otherwise of an electrocardiogram (https://www.nhlbi.nih.gov/health-topics/electrocardiogram) (ECG or EKG). This test looks at electrical activity in the heart. A chest X-ray will show whether the heart is enlarged or the lungs have fluid in them; both can be signs of heart failure (https://www.nia.nih.gov/health/what-heart-failure). The doctor might do a blood test for brain natriuretic peptide (BNP), a hormone that increases in heart failure. If the cardiologist needs to determine whether or not the heart or valve function, an echocardiogram (https://www.nhlbi.nih.gov/health-topics/echocardiography), may be ordered, and this is a painless test which uses sound waves to produce images of the heart in motion.
For the fact that there are new technologies developed for the diagnostic evaluation of patients with cardiovascular disease, the electrocardiogram (ECG) also retains its central role. The ECG is an important test for interpretation of the cardiac rhythm, conduction system abnormalities, and the detection of myocardial ischemia in a patient. The ECG is also of great value in the evaluation of other types of cardiac abnormalities including valvular heart disease, cardiomyopathy, pericarditis, hypertensive disease and coronavirus (COVID-19) disease. Equally, the ECG can be used to monitor drug treatment (specifically antiarrhythmic therapy) and to detect metabolic disturbances and so on. This study focuses on identifying some important factors that determine the activities of PR-interval in Electrocardiogram examinations.
An electrocardiogram (ECG or EKG) is a test that measures the electrical activity of the heartbeat. With each beat, an electrical impulse or wave travels through the heart. This wave causes the muscle to squeeze and pump blood from the heart. A normal heartbeat on ECG will show the timing of the top and lower chambers [1]. It is also important to know that ECG is used to detect hidden but vital changes in the heart sound such as transient ischemic episodes, cardiac arrhythmias, and for arrhythmic risk assessment of patients, [2]. Meanwhile, [3] discovered that bibliometric methods using TC-2013 and C-2013 were more efficient in identifying the hotspots in ECG-related research. The review also discovered four hotspots such as AF; LQTS; angina and MI; and HRV. Mozos, et al., [4] used regression analysis and revealed the significant associations between prolonged QTc and increased QTd and anemia and macrocytosis, respective. Also discovered the most sensitive and specific predictor of prolonged QTc and QTIIc was anisocytosis while Anemia was the most sensitive predictor of QTd > 60 ms and macrocytosis, the most specific. The presence of LVP and SA-ECG parameters can be predicted from 12-lead ECG variables in post-infarction heart failure patients [5]. The initial ECG and CK levels in patients with STEMI may contain valuable information for risk stratification, determination of prognosis and the subsequent management plan [6]. The redefinition of the actual ECG criteria for the assessment of prior myocardial infarction should be assessed and the cCMR is to be considered currently the best imaging technique in detecting myocardial scar, its severity and location where possible, and also be strongly recommended in clinical practice [7].
An ECG gives two major kinds of information. First, by measuring time intervals on the ECG, this helps doctors to determine the underlying heart conditions; how long the electrical wave takes to pass through the heart and also finding out how long a wave takes to travel from one part of the heart to the next, which eventually reveals the electrical activities as to being normal or slow, fast or irregular. Second, by measuring the amount of electrical activity passing through the heart muscle, a cardiologist may be able to find out if parts of the heart are too large or are overworked. A systematic approach to interpretation of the ECG is imperative in order to avoid overlooking any abnormalities. At this point it is also important to review some aspects of the ECG in relation to PR interval.
In electrocardiography (https://en.wikipedia.org/wiki/Electrocardiography), the PR interval is the period, measured in milliseconds, that extends from the beginning or the onset of the P wave (https://en.wikipedia.org/wiki/P_wave_(electrocardiography)) (the onset of a trial (https://en.wikipedia.org/wiki/Atrium_(heart)) depolarization (https://en.wikipedia.org/wiki/Depolarization)) until the beginning or rather to start the QRS complex (https://en.wikipedia.org/wiki/QRS_complex) (the onset of ventricular (https://en.wikipedia.org/wiki/Ventricle_(heart)) depolarization). It reflects conduction through the AV node. It is normally between 120 and 200 ms (0.12-0.20s) in duration (three to five small squares), [8]. Remark that if the PR interval is greater than 200 ms, then first degree heart block (https://litfl.com/first-degree-heart-block-ecg-library/) is said to be present on the other hand if PR interval is less than 120 ms this suggests pre-excitation (https://litfl.com/pre-excitation-syndromes-ecg-library/) (the presence of an accessory pathway between the atria and ventricles) or AV nodal (junctional) rhythm. Also, the second degree heart block, Mobitz type I (Wenckebach phenomenon), is observed at a stage that the baseline PR interval is prolonged, and then further prolongs with each successive beat, until a QRS complex is dropped. The PR interval before the dropped beat is the longest (340 ms), while the PR interval after the dropped beat is the shortest (280 ms). The PR interval is sometimes termed the PQ interval.
The Figure 1 below presents the graphical illustration of PR interval on ECG signal [9].
 Figure 1: ECG graphical illustration of sample signal indicating all the intervals, [9].
View Figure 1
Figure 1: ECG graphical illustration of sample signal indicating all the intervals, [9].
View Figure 1
Factorial experiment was employed in this experiment because the experiment involved six distinct factors namely, Sex, Weight, Height, SBP, DBP and HR; and this provide the opportunity to study the main effects and joint interaction effects at the same time on the response, which is the PR-interval.
Factorial designs are frequently used in experiments involving several factors where it is necessary to investigate the joint effect of the factors on a response [10]. In this study, it is to be noted that every factor in this experiment was measured at two levels, coded as (-1, 1), which correspond to low and high levels, respectively. The 2k factorial design with k = 6 is used in this study and it consists of all possible combinations of the levels of each of the six factors. The number of experimental runs in this design is equal to 2k, where k denotes the number of factors while 2 denotes the level of every factor considered. To ensure precision in the experimental results, each design point was replicated three times. Hence, the total number of experimental runs was 3(26) = 192. The resulting sets of data for the experiment are presented in the Table 1.
Table 1: Data Presentation of PR-interval Rate Experiment in the 26 design with replications with 64 treatment combinations. View Table 1
However, Table 2 and Table 3 presented the summaries of the results of the analyses carried out. Graphical presentations of the results of the analyses are also presented in Figure 2 and Figure 3.
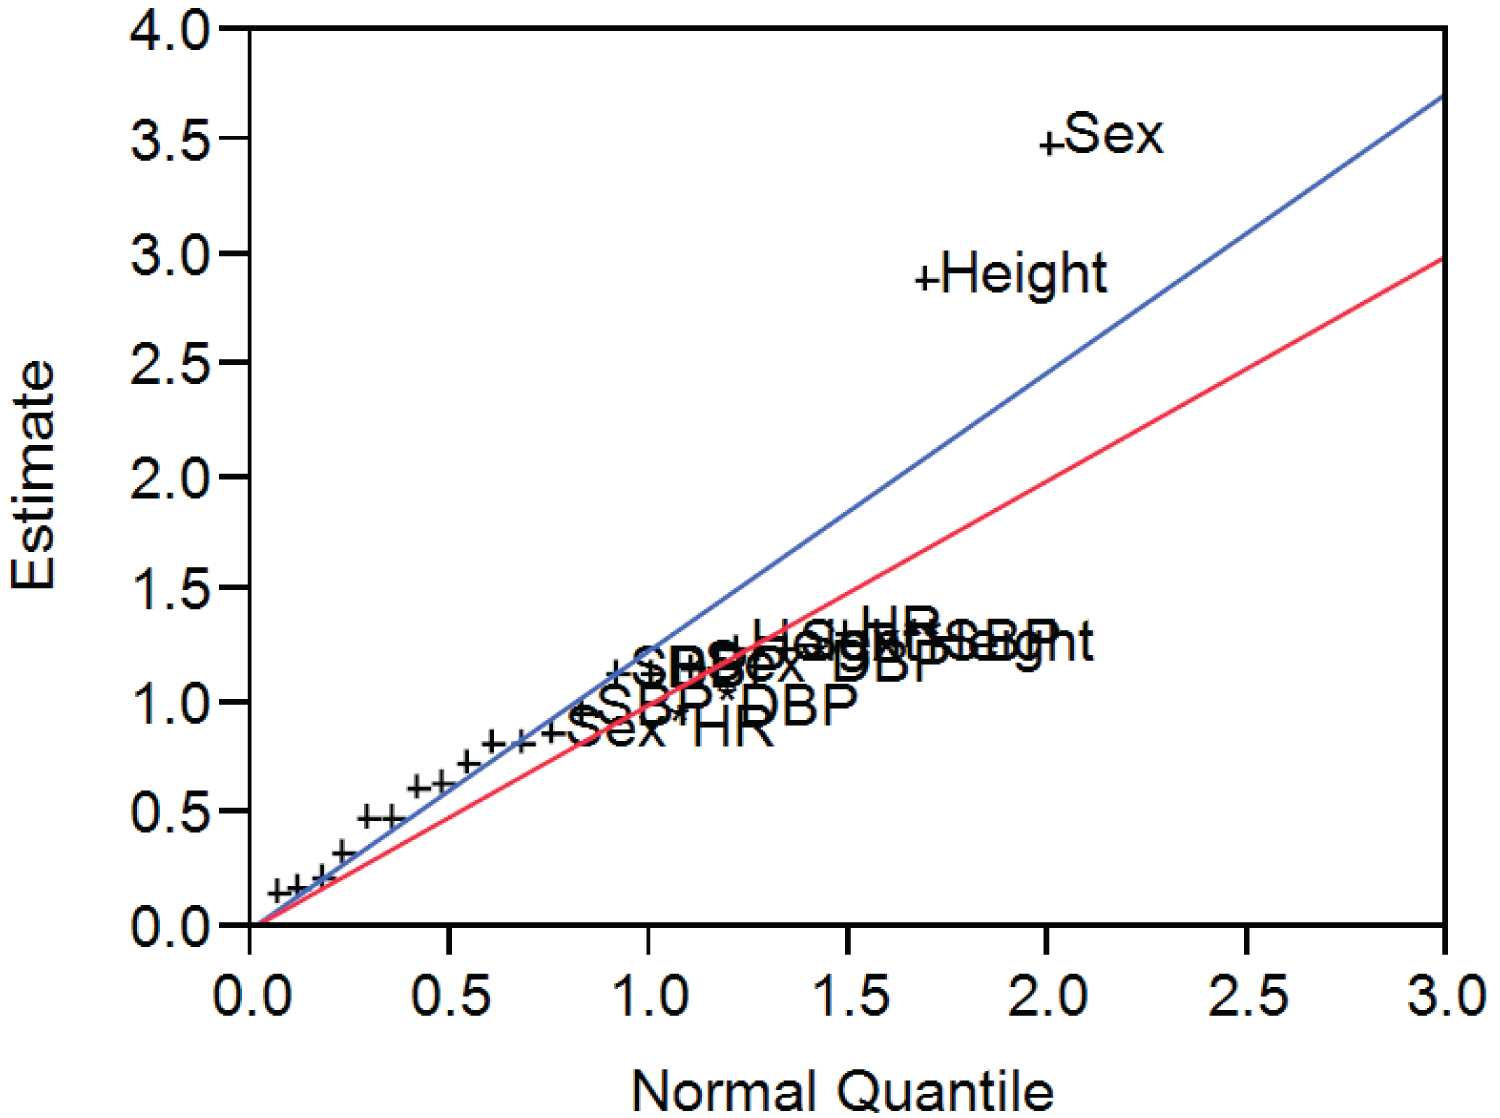 Figure 2: Half normal probability plot of the effects for the 26 factorial design for PRint.
View Figure 2
Figure 2: Half normal probability plot of the effects for the 26 factorial design for PRint.
View Figure 2
 Figure 3: Pareto plot of the effects for the 26 factorial design for PRint.
View Figure 3
Figure 3: Pareto plot of the effects for the 26 factorial design for PRint.
View Figure 3
Table 2: Effect estimates for the 26 factorial design for PR-interval. View Table 2
Table 3: Effects test and sum of square for the 26 factorial design for PR-interval. View Table 3
From the results of analysis in Table 3, it is evident that Sex, Height and HR were the only treatment effects that are significantly influencing the activities of PR-interval, with p-values of < 0.0001, < 0.0001 and 0.0456 respectively. Meanwhile, other treatment effects have p-values greater than 0.005, meaning that their contributions to the activities of PR-interval are not significant.
The half normal probability plot of effects in Figure 2 shows that all the treatment effects that lie along the straight line are negligible, while the large effects are far from the line. As such the important effects that emerge from this analysis are basically the main effects of sex, height and HR, meaning that none of the interaction effect is significant. The Pareto Plot of Estimates in Figure 3 is equally in agreement with the effects that are significant in the foregoing findings.
The effect of Sex (-3.5) is the most significant of all the treatment effects considered, followed by the effects of Height (2.8854) and HR (-1.31225), while other effects showed to have very little effect on the activities of PR-interval. This paper therefore concluded that the analysis of PR-interval of an ECG signal does a vital role with respect to Sex, Height and HR. Thus, these factors are identified as the most important factors influencing the activities of PR-interval and the corresponding model equation for the overall experiment is given as:
YPRint = 84.1875 - 3.5X1 + 2.8854X3 - 1.3125X6. (1)