Purpose: To report the anatomic and functional outcomes in diabetic macula-off tractional retinal detachment.
Design: Multicenter, retrospective, interventional, consecutive case series.
Participants: 30 selected eyes of 26 patients (out of 256 eyes of 124 consecutive patients) with a mean diabetes evolution period of 18.4 ± 4.8 years SD who underwent successful vitrectomy techniques for tractional retinal detachment involving the macula, between January 2016 and December 2020. Methods: All patients underwent pars plana vitrectomy and successfully surgical resolution of tractional retinal detachment forming only one surgery group and more than one surgery group in cases of recurrent diabetic TRD. Structural, perfused and functional postoperative findings were statistical analized.
Main outcome measures: The primary outcomes were to analized the perfusional, structural and functional postoperative findings of the intentionally selected eyes with a fully resolved diabetic TRD that underwent timely sophisticated pars plana vitrectomy (PPV) techniques. The secondary outcomes were correlating the long-term final postoperative BCVA with the multimodal, serial postoperative multimodal evaluation.
Results: The mean difference between the pre-, 3 months and final postoperative BCVA was significant (p < 0.05). The mean duration of vision loss before surgery was 11.6 ± 2.3 weeks SD. The mean time for macular detachment resolution was 3.6 ± 1.7 weeks in the group showing pure macular tractional detachment and 1.8 ± 0.8 weeks in the group showing combined tractional and rhegmatogenous macular detachment (p < 0.05) for the eye group with one surgery only and 12.2 ± 8.1 weeks SD for the eyes with more than one surgery (p < 0.05). Mean follow-up 11.4 ± 5.7 months. Longitudinal multimodal imaging tests demonstrated abnormal superficial and deep microcirculation patterns with multiple micro-abnormalities of the foveal avascular zone and different but distinct areas of non-perfused macula on OCT angiography, as well as the presence of disorganization of the retinal inner layers (DRIL) and chronic ischemic macular edema in 82% of the eyes examined by SD-OCT. Microperimetry, chromatic macular visual field testing and mfERG testing revealed an abnormal retinal response with an unstable eccentric foveocentral fixation pattern and a profound reduction in the N1- and P1-wave nV amplitudes with a prolonged P1 implicit time.
Conclusion: Despite successful anatomical reattachment of the macula, long-term postoperative microcirculatory abnormalities along with persistent and ischemic tissue were detected predominantly in the recurrent TRD group due to multiple microcirculatory defects, including ischemic edema of the external and internal layers of the retina and DRIL.
Secondary complicated retinal detachment, Macula-off tractional retinal detachment, Ocular coherent tomography angiography, Long-term proliferative diabetic retinopathy complications, Perfusion microcirculatory, Disorganization of the retinal inner layers, Ischemic macula, Chromatic visual field testing, Microperimetry, Multifocal electroretinography
AVC: Average Vessel Caliber; BCVA: Best-Corrected Visual Acuity; CME: Cystoid Macular Edema; CSFT: Central Subfoveal Thickness; DM: Diabetes Mellitus; DME: Diabetic Macular Edema; DRIL: Disorganization of the Retinal Inner Layers; DR: Diabetic Retinopathy; ELM: External Limiting Membrane; ERM: Epiretinal Membrane; EZ: Ellipsoid Zone; FA: Fluorescein Angiography; FAZ: Foveal Avascular Zone; FAZ-A: Foveal Avascular Zone Area; FAZ-CI: Foveal Avascular Zone Contour Irregularities; FRS: Foveal Retinal Sensitivity; GCL-IPL: Ganglion Cell Layer-Inner Plexiform Layer; INL: Inner Nuclear Layer; IS/OS: Inner Segment/Outer Segment; logMAR: Logarithm of the Minimum Angle of Resolution; mfERG: Multifocal Electroretinography; MAIA: Macular Integrity Assessment; MRS: Macular Retinal Sensitivity; OCT: Optical Coherence Tomography; OCT-A: Optical Coherence Tomography Angiography; OPL: Outer Plexiform Layer; PDR: Proliferative Diabetic Retinopathy; PPV: Pars Plana Vitrectomy; PFO: Perfluoro-N-Octane; PRP: Panretinal Photocoagulation; RRD: Rhegmatogenous Retinal Detachment; RPE: Retinal Pigment Epithelium; RSAM: Retinal Sensitivity Analysis Mapping; SO: Silicon Oil; TRD: Traction Retinal Detachment; VA: Visual Acuity; VD: Vessel Density; VEGF: Vascular Endothelial Growth Factor; VH: Vitreous Hemorrhage; VT: Vessel Tortuosity
Diabetes Mellitus (DM) is a worldwide problem specially in developing countries due to poor medical care. Among the main causes of potentially treated severe visual loss are diabetic macular edema (DME) and chronic cystic macular edema (CME) and complications related to proliferative diabetic retinopathy (PDR) such as recurrent vitreous hemorrhages (VH), tractional retinal detachment (TRD), refractory macular edema associated with posterior hyaloid traction, combined traction/rhegmatogenous retinal detachment and epiretinal membrane /ERM) proliferation are the most common indications of surgical vitrectomy [1-3].
Anti-VEGF is a very useful method in the management of diabetic retinopathy (DR). In selected patients the applications of adjuvants as steroids in paraocular injections or by intravitreous extended-release devices have gained popularity for their practicality effectiveness in maintaining long-term vision. It has left the panretinal photocoagulation (PRP) as a second-line treatment in developed countries [4].
The results of the Diabetic Retinopathy Clinical Research Network Protocol and the CLARITY (clinical efficacy and mechanistic evaluation of aflibercept for proliferative diabetic retinopathy) trials has been used as guidelines for the surveillance and management of patients with macular edema and complications related to proliferative diabetic retinopathy [4]. These results are found to be better over classical PRP treatment.
In case of delayed detection of diabetic retinopathy, it must be treated by advanced pars plana vitrectomy (PPV) techniques. The visual outcomes after diabetic vitrectomy, however, have not undergone a similar change [5,6]. In spite of numerous studies the predictive factors of visual outcomes remain to be elucidated [7].
Sun, et al. [8] have used the horizontal B-scan of optical coherence tomography (OCT) images to characterize the disorganization of the retinal inner layers (DRIL) as the inability to distinguish any of the boundaries of the ganglion cell layer-inner plexiform layer (GCL-IPL) complex, inner nuclear layer (INL), and outer plexiform layer (OPL). Regarding DME, DRIL was reported to be associated with poor BCVA and changes in the DRIL affects the subsequent changes in final BCVA.
OCTA is a noninvasive OCT platform to create in vivo 3-dimensional composites of separate layers of the retinal and choroidal vasculature without the use of a contrast agent [9]. Sensitivity can be increased through multiple algorithms for detailed imaging of each superficial and deep retinal capillary plexus as well as the choriocapillaris [10-12]. The OCTA images can be automatically segmented to provide an en face, depth-encoded region of the vasculature that is co-registered with the structural OCT B-scan.
OCTA eliminates the need for a dye [13,14], and eliminates the "transit window" seen with both fluorescein angiography (FA) and indocyanine (ICG). OCTA also avoids the dark artifact of retinal and vascular features that may occur with dye leakage [15]. The capillary-level detail with high depth resolution provides information given only by histological studies [16-20].
In patients with DR, OCTA demonstrates retinal foveal avascular zone (FAZ) enlargement, and microaneurysms. The ability to separately examine the superficial and deep capillary plexuses with OCTA helps users delineate retinal involvement in various diabetic lesions. AngioVue imaging showing superficial and deep plexuses with vessel density quantification of proliferative DR shows areas of nonperfusion, microaneurysms, and clear enlargement of the FAZ [21].
Studies show that FA cannot resolve the deep capillary plexus or peripapillary radial capillaries at all [15,16,22]. Most, if not all, of the clinically relevant macular findings are demonstrable and correlated with OCTA findings in DR [23,24]. OCTA is a superior tool for quantitatively evaluating the severity of non-perfused retina.
OCTA can reliably detect both neovascularization of the disc (NVD) and elsewhere (NVE), assuming that the pathology is within the field of view [25-27]. These advancements are expected to improve the management of DR. It includes the monitoring in quantification of retinal capillary perfusion while treating patients with anti-VEGF and after surgical treatment of diabetic TRD involving the macula as we did in this study. Alterations in the retina perfusion during or after macula surgery, or due to microangiopathy natural progression may be prevented with sustained anti-VEGF therapy [19]. This study attempts to predict best-corrected visual acuity (BCVA) after successful macular surgery. Specific spectral-domain (SD)-OCT findings, such as DRIL and ellipsoid band has been used as reliable biomarkers for the BCVA prediction. DRIL has been used as it behaves longitudinally after anatomically and structurally successful surgery of the macula. The study also aimed to analyze some OCTA findings, such as superficial and deep capillary plexuses and FAZ enlargement. Also, BCVA has been correlated with multimodal functional evaluation with the help of microperimetry, 10-2 and 30-2 chromatic visual field testing and multifocal electroretinography (mfERG) findings.
The present study adhered to the tenets of the Declaration of Helsinki. All the required approval were taken from the three institutions enrolled (no reference number were provided for the present study). Written informed consent in accordance with the institutional guidelines was obtained from all 30 patients.
The clinical charts of 30 consecutive, symptomatic eyes of 27 patients (out of 124 diabetic patient charts reviewed) were included who met the following criteria: 18 years or older, being a controlled diabetic, progressive loss of vision of less than 12 weeks due to macula-off tractional retinal detachment (TRD), (Figure 1 images a-h) confirmed by SS-OCT or B-mode ultrasonography, an axial length of < 26.5 mm, with no evidence of vascular macular pathology other than PDR, at least 6 months of follow-up after surgery, had undergone successful vitrectomy techniques with clear media at the end of follow-up, evidence of macular TRD resolution with the macula attached in the last follow-up visit, at least two serial SS-OCT or SD-OCT assessments, one OCT angiography at the end of follow-up, and a postoperative functional evaluation with microperimetry and multifocal electroretinography when possible on the last follow up visit. The exclusion criteria were as follow: loss of follow-up, TRD from other vascular etiology, postoperative complications with opaque media at the last follow-up visit, developing neovascular glaucoma with no light perception during follow-up. Thirty consecutive eyes were found to meet the aforementioned criteria and their charts were analyzed serially from January 2016 to December 2020.
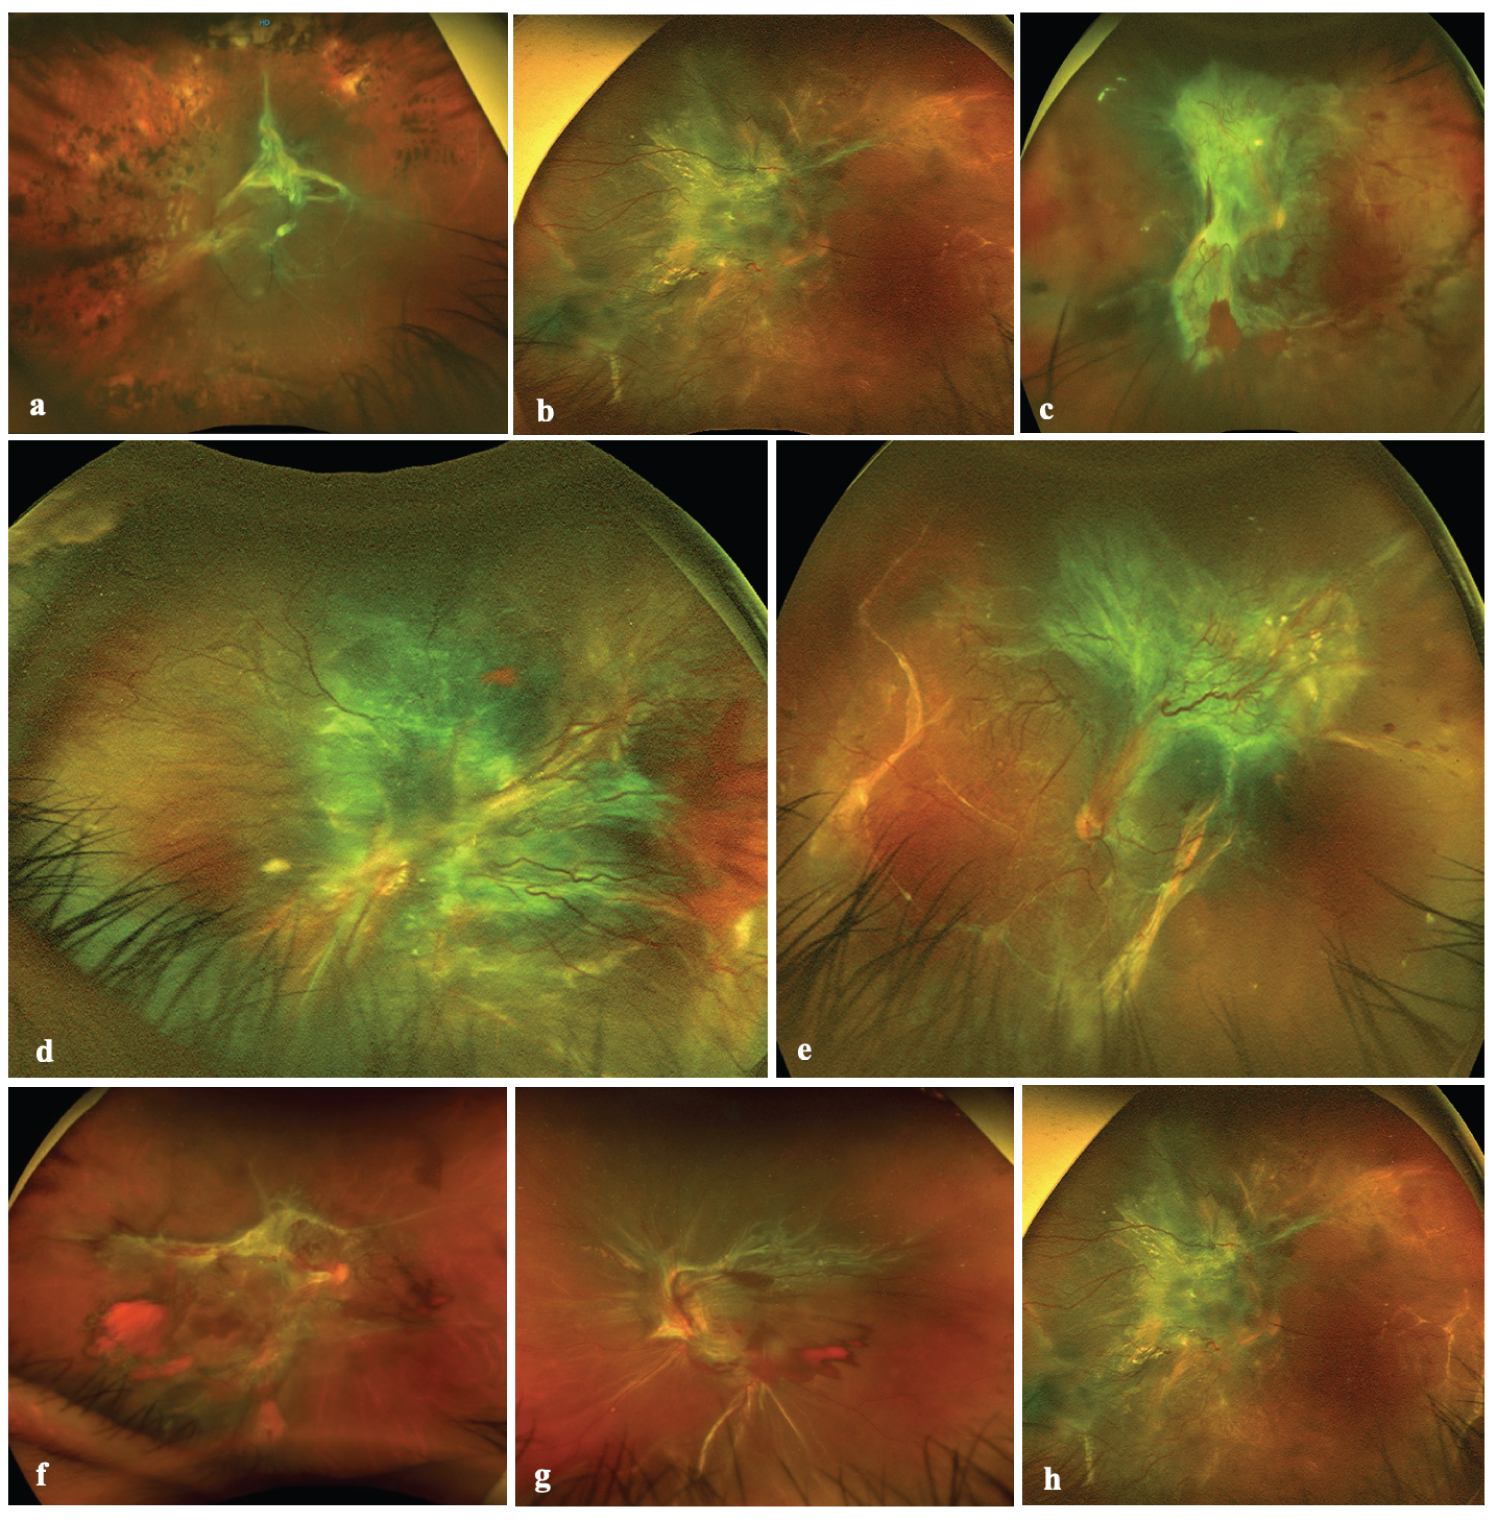 Figure 1: Different types of diabetic tractional retinal detachment. (a) Depicts a wide-field Optos color fundus image of a diabetic tractional retinal detachment (TRD) with macular involvement. The media is clear, proliferative fibrovascular tissue is emerging from the optic disc and along the temporal vascular arcades, the retina of the posterior pole is detached with the macula involved. The rest of the retina looks thin and atrophic with evidence of prior panretinophotocuagulation (PRP); (b) Image depicts another picture of diabetic TRD with macular involvement, the TRD extends to the nasal equator of the retina with vertical subretinal demarcation lines; (c) Three months fibrotic macula off TRD; (d) Magnified wide-field Optos color image of an exuberant fibrovascular tissue proliferation over the posterior pole and along the vascular arcades which contract and detached the macula; (e) Heterotopic macula off TRD with exuberant fibrovascular tissue; (f) Depicts a diabetic TRD where the optic nerve is seen, a very extensive TRD is affecting the posterior pole and the macula is detached. There is very active vascular activity with evidence of localized vitreous hemorrhage, there is no evidence of previous PRP; (g) Image shows one more case of diabetic TRD with macular involvement and clinical evidence of localized vitreous and preretinal bleeding with the inferotemporal vascular arcade with the retinal vessels silver wire appearance; (h) Predominantly fibrous macula off TRD.
View Figure 1
Figure 1: Different types of diabetic tractional retinal detachment. (a) Depicts a wide-field Optos color fundus image of a diabetic tractional retinal detachment (TRD) with macular involvement. The media is clear, proliferative fibrovascular tissue is emerging from the optic disc and along the temporal vascular arcades, the retina of the posterior pole is detached with the macula involved. The rest of the retina looks thin and atrophic with evidence of prior panretinophotocuagulation (PRP); (b) Image depicts another picture of diabetic TRD with macular involvement, the TRD extends to the nasal equator of the retina with vertical subretinal demarcation lines; (c) Three months fibrotic macula off TRD; (d) Magnified wide-field Optos color image of an exuberant fibrovascular tissue proliferation over the posterior pole and along the vascular arcades which contract and detached the macula; (e) Heterotopic macula off TRD with exuberant fibrovascular tissue; (f) Depicts a diabetic TRD where the optic nerve is seen, a very extensive TRD is affecting the posterior pole and the macula is detached. There is very active vascular activity with evidence of localized vitreous hemorrhage, there is no evidence of previous PRP; (g) Image shows one more case of diabetic TRD with macular involvement and clinical evidence of localized vitreous and preretinal bleeding with the inferotemporal vascular arcade with the retinal vessels silver wire appearance; (h) Predominantly fibrous macula off TRD.
View Figure 1
All consecutive patients underwent a general ophthalmic evaluation and preoperative examinations. It includes a BCVA assessment, slit lamp biomicroscopy examination, fundus examination with panfundoscopic contact lenses, and indirect ophthalmoscopy. In clear media eyes, cross-sectional images of the macular region were acquired using SD-OCT (Ret-vue-3.4 OCT, Optovue Inc., Fremont, CA, USA). The axial lengths were measured using partial coherence laser interferometry (Zeiss IOL Master 700; Carl Zeiss Meditec, AG, Oberkochen, Germany). The presence of tractional macular detachment was confirmed by SD-OCT, B-scan ultrasonography (A and B Ultrasound Unit, Quantel Medical, Du Bois Loli, Auvergne, France) and indirect ophthalmoscopy. A postoperative microstructural evaluation (mean final evaluation of 23 ± 4.7 SD months) was performed using SD-OCT (Spectralis OCT; Heidelberg Engineering, Heidelberg, Germany) and the swept-source DRI OCT Triton device (Topcon Medical Systems, Inc.). Postoperative multimodal functional evaluations included the final BCVA, macular retinal sensitivity (MRS), foveal retinal sensitivity (FRS), and retinal sensitivity analysis mapping (RSAM). It was assessed by microperimetry with the standard Macular Integrity Assessment (MAIA). Standard protocol covered a 10° diameter area with 37 measurements points and a light stimulus projected directly over the macula surface, with a size stimulus of Goldman III, background luminance of 4 apostilbs (asb) and maximum luminance of 1000 asb, and 36 decibels (dB) dynamic range. Fixation stability and location patterns parameters were assessed by tracking eye movements 25 times/second and by plotting the resulting distribution over the scanning laser ophthalmoscope image. Each movement represented by a point, and the overall site describes the preferred retina locus. Computerized mfERG was used to detect focal (regional) outer retinal abnormalities, the amplitude and implicit time of the N1 wave, implicit time of the P1 wave, and elevation electroretinography 3-D maps were assessed in the affected eye and compared to the normal contralateral eye or to the corresponding control normative dataset. 61-hexagon 30° standardized technique to test the macular electrical multifocal outer layers sensitivity point to point at the < 2-degree to > 15-degree central rings (< 2, 2-5, 5-10, 10-15, > 15 central rings) was performed at the last follow-up evaluation visit.
Standard 25-gauge three-port pars plana vitrectomy was performed in all 30 eyes under local anesthesia plus sedation by one of the authors (MAQR). In addition to central vitrectomy, triamcinolone acetonide (Kenalog 40 mg/mL; Bristol-Myers, New York, NY)-assisted removal of the cortical vitreous from the surface of the retina was performed using a silicone-tipped cannula and active suction, paying special attention to detect macular preretinal fibrovascular proliferations. Removal of the hyaloid in complex vitreoretinal interface cases such as these requires a combination of delamination alternating with segmentation along with viscodissection techniques for adherent vitreous and epiretinal fibrovascular proliferative tissue, avoiding iatrogenic retinal breaks. To maintain hemostasis throughout the procedure, attention was given to any foci of perfused retinal neovascularization or bleeding from the retinal vasculature. Once the hyaloid was carefully dissected and removed, attention was turned to fibrovascular membrane dissection using viscodissection, segmentation, and/or delamination techniques as mentioned previously, and the residual epiretinal tissue was peeled or dissected to release macular traction and distortion. As a part of the surgeon's personal technique, and after removal of the anterior-posterior traction, we then focused on tangential or circumferential traction, and surgical macular evaluation and revision were performed in all cases by using trypan blue 0.15% ophthalmic solution (Membrane Blue; Dutch Ophthalmic, USA) as an adjuvant dye to stain cortical vitreous remnants or epiretinal macular membranes. In cases showing membrane epiretinal proliferation, a mixture of 0.15 mL of 0.25 mg/mL (0.025%) diluted isomolar solution (pH 7.4) of Brilliant Blue G (BBG) dye was used to selectively stain the ILM because of the suspected traction contribution of ERMs proliferation. Once the tractional components were released, the rhegmatogenous lesions were diathermally marked, macular reattachment was achieved, and scatter panretinal photocoagulation (PRP) with an argon laser was performed in all cases. In cases with no rhegmatogenous lesions, PRP was applied avoiding areas of subretinal fluid that may cause small retinal breaks (Figure 2a-h; Figure 3a-c and Figure 3g-i). Only cases in which a long-acting non-expandable perfluoropropane (C3F8) gas mixture at 15% was used as a tamponade were enrolled in the analysis; phacoemulsification followed by intraocular lens implantation was performed in 12 phakic eyes, and the lens status was not considered as a variable in the functional analysis.
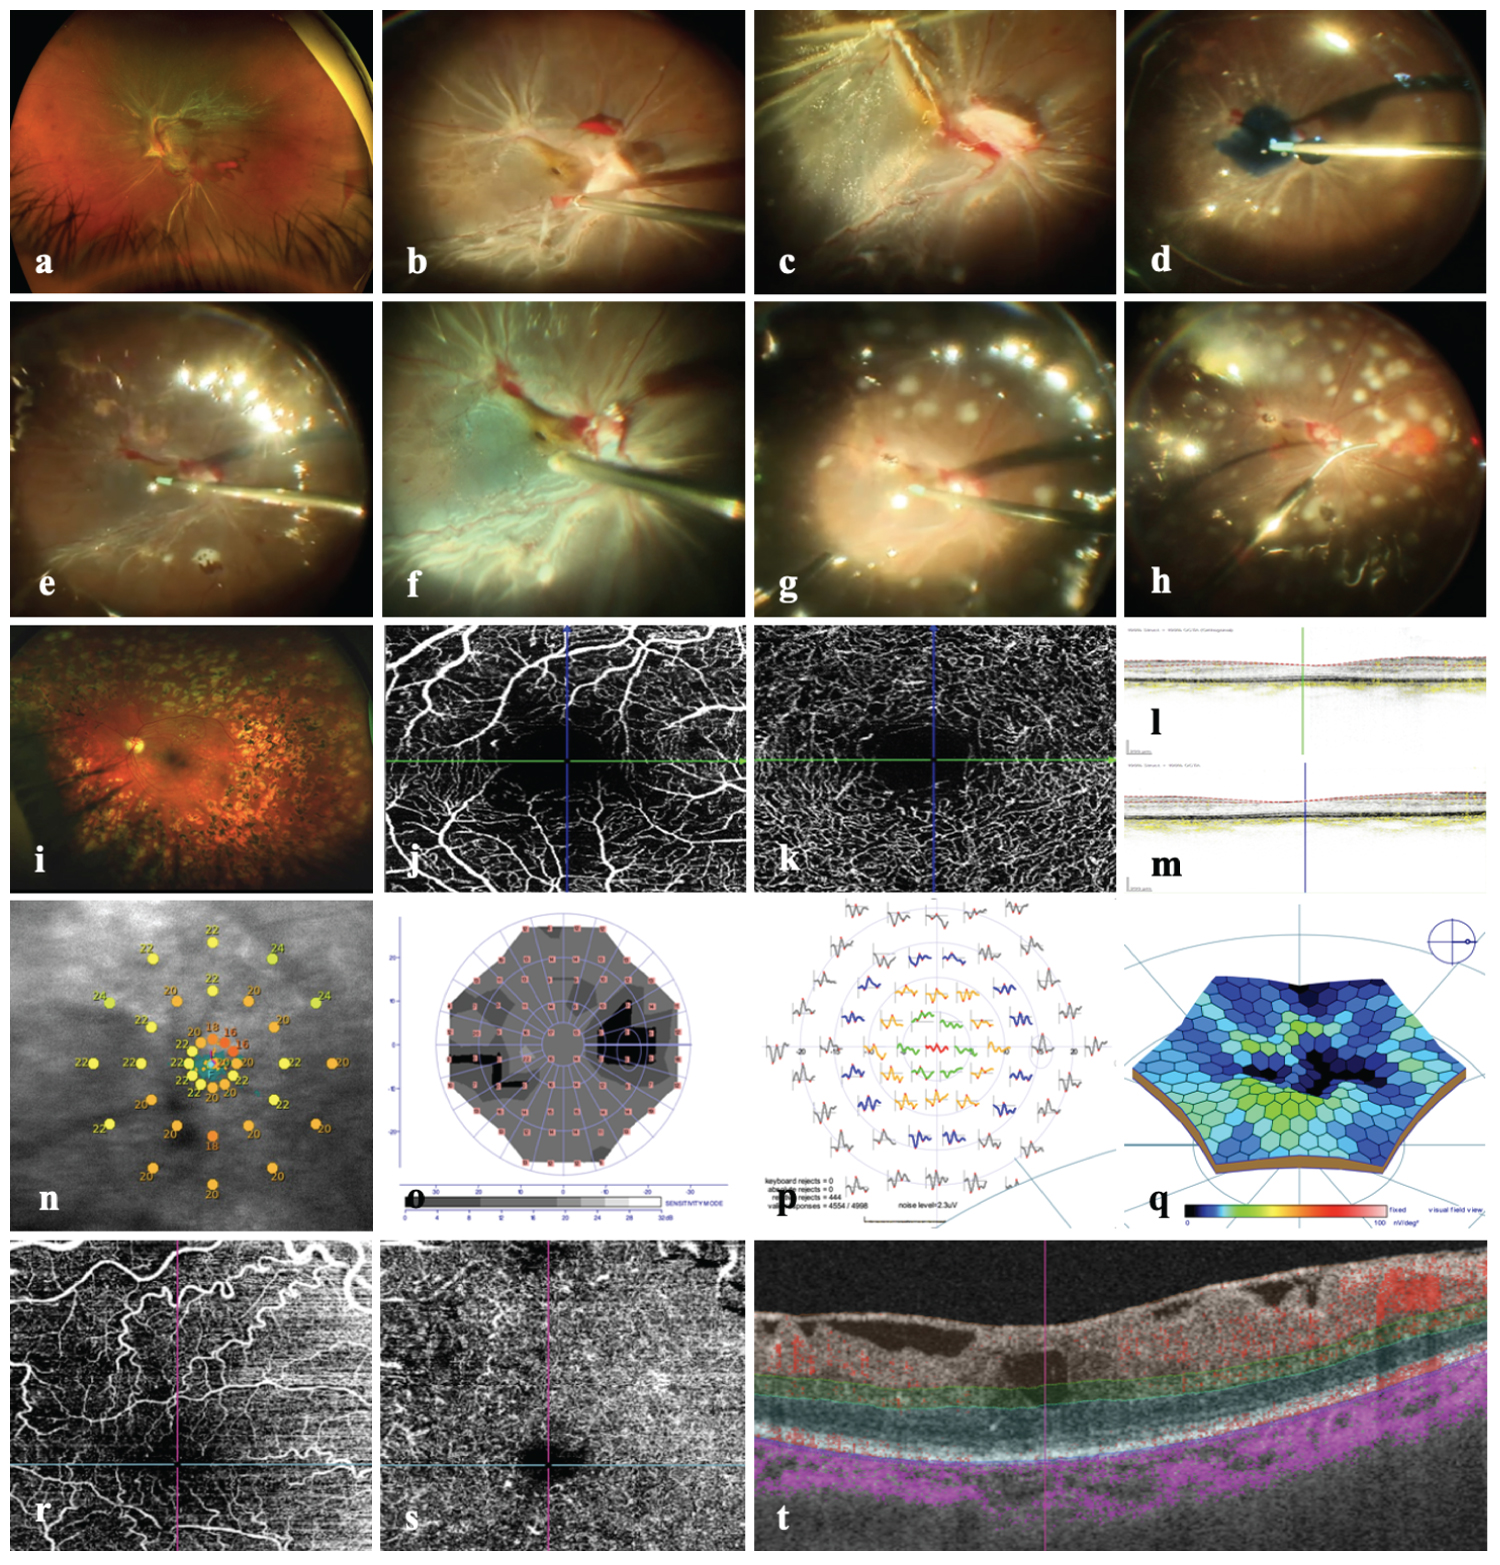 Figure 2: Surgical steps and structural and functional findings. (a) Depicts a wide-field Optos color fundus image of an eye with long evolution type 2 diabetes mellitus and abundant proliferative fibrovascular preretinal tissue which detach the retina involving the macula; (b) Image depicts a surgical image where a severe traction detachment is seen, the macula is detached and there is fibrovascular tissue emerging from the optic nerve running and detaching the retina and temporal vascular arcades; (c) Magnified image where the macula is clearly detached with the macula dragged and distorted; (d) Surgical image under air depicting the released of the detached macula where trypan blue dye is used for vitreous or fibrovascular remnants stain; (e) Surgical image under air image depicts a distorted and stained macular surface with evidence of macular tissue dragged due proliferative tissue remnants over the optic and along the temporal vascular arcades; (g) Depicts a surgical image where the macula has been released and looks reattached; (h) Transoperative argon laser endophotocoagulation over the surface of the reattached retina; (i) Corresponding final long-term photo of the previous images case depicting a pale optic nerve, the macula looks attached and there is PRP scars over the entire retina; (j) En face OCT angiography image of the superficial vascular plexus (SVP) showing an enlarged foveal avascular zone (FAZ), with some capillary dropouts; (k) En face OCT angiography of the deep vascular plexus with countless abnormal capillaries terminal segment defects and wide zones of capillaries dropouts; (l and m) Images corresponding horizontal and vertical crosslines b scan SD-OCT of the ischemic macula showing an irregular ellipsoid band with ELM line preservation and absence of disorganization of retina inner layers (DRIL); (n) Image shows an abnormal macular sensitivity on microperimetry; (o) Image depicts an abnormal retinal sensibility on the central visual field; (p) The mf ERG is deeply abnormal in the central rings and the topographic elevation 3-D map is abnormaly depressed; (r) En face OCTA images depict slabs of two different cases of successfully reattached macules where there is demonstrated long-term superficial consistent with countless abnormal terminal capillaries segments and compensatory tortuosity; (r) and deep plexus vascular abnormalities showing terminal superficial and deep capillaries dropouts with interrupted vascular segments and countless telangiectatic abnormalities; (t) Image depicts the corresponding SD-OCT horizontal b scan with evidence of central intraretinal cyst, intraretinal hemorrhagic component and traction associated to ERM.
View Figure 2
Figure 2: Surgical steps and structural and functional findings. (a) Depicts a wide-field Optos color fundus image of an eye with long evolution type 2 diabetes mellitus and abundant proliferative fibrovascular preretinal tissue which detach the retina involving the macula; (b) Image depicts a surgical image where a severe traction detachment is seen, the macula is detached and there is fibrovascular tissue emerging from the optic nerve running and detaching the retina and temporal vascular arcades; (c) Magnified image where the macula is clearly detached with the macula dragged and distorted; (d) Surgical image under air depicting the released of the detached macula where trypan blue dye is used for vitreous or fibrovascular remnants stain; (e) Surgical image under air image depicts a distorted and stained macular surface with evidence of macular tissue dragged due proliferative tissue remnants over the optic and along the temporal vascular arcades; (g) Depicts a surgical image where the macula has been released and looks reattached; (h) Transoperative argon laser endophotocoagulation over the surface of the reattached retina; (i) Corresponding final long-term photo of the previous images case depicting a pale optic nerve, the macula looks attached and there is PRP scars over the entire retina; (j) En face OCT angiography image of the superficial vascular plexus (SVP) showing an enlarged foveal avascular zone (FAZ), with some capillary dropouts; (k) En face OCT angiography of the deep vascular plexus with countless abnormal capillaries terminal segment defects and wide zones of capillaries dropouts; (l and m) Images corresponding horizontal and vertical crosslines b scan SD-OCT of the ischemic macula showing an irregular ellipsoid band with ELM line preservation and absence of disorganization of retina inner layers (DRIL); (n) Image shows an abnormal macular sensitivity on microperimetry; (o) Image depicts an abnormal retinal sensibility on the central visual field; (p) The mf ERG is deeply abnormal in the central rings and the topographic elevation 3-D map is abnormaly depressed; (r) En face OCTA images depict slabs of two different cases of successfully reattached macules where there is demonstrated long-term superficial consistent with countless abnormal terminal capillaries segments and compensatory tortuosity; (r) and deep plexus vascular abnormalities showing terminal superficial and deep capillaries dropouts with interrupted vascular segments and countless telangiectatic abnormalities; (t) Image depicts the corresponding SD-OCT horizontal b scan with evidence of central intraretinal cyst, intraretinal hemorrhagic component and traction associated to ERM.
View Figure 2
A complete case analysis was performed with a sample of 30 selected eyes of 27 patients (out of 124 diabetic patient charts reviewed). The demographic characteristics were described by using total number and frequency for categorical variables and mean with standard deviation for continuous variables. To check the difference in mean value of more than two groups, the analysis of variance (ANOVA) test with post hoc Bonferroni test was used for continuous variables for normally distributed data, whereas, Mann-Whitney test was applied in case, when the dataset was non-normal. In case of categorical data, inferential analysis was done by employing Pearson χ2 test. The analyses were performed using SPSS version 27, [28] and JAMOVI software.
The patients' general and demographic data are listed in Supplemental Table 1. It shows the demographic details for the study variables of females and males without significant difference (p > 0.05).
Outstandingly the ANOVA test findings revealed a significant difference in the preoperative BCVA (1.14 ± 0.21) when compared to three months postoperative BCVA (0.66 ± 0.31) and final postoperative follow-up BCVA (0.77 ± 0.35) measure Supplemental Table 2.
The post-hoc evaluation (Games-Howell test) indicated a significant difference among the pair's preoperative-3-months postoperative evaluation, and preoperative-final postoperative evaluation for the factor BCVA Graph 1.
 Graph 1: Comparison between preoperative, three months and final postoperative BCVA.
Note. n = 30. M: Means; SD: Standard Deviation.
View Graph 1
Mauchly's test was used to assess the assumption of sphericity [29,30]. The results of ANOVA showed that the variances of difference scores between repeated measurements were all similar based on an alpha of 0.05, p = .446, indicating the sphericity assumption was met, this means there were significant differences between the values of different BCVA measures taken Supplemental Table 3, Graph 2 and Graph 3.
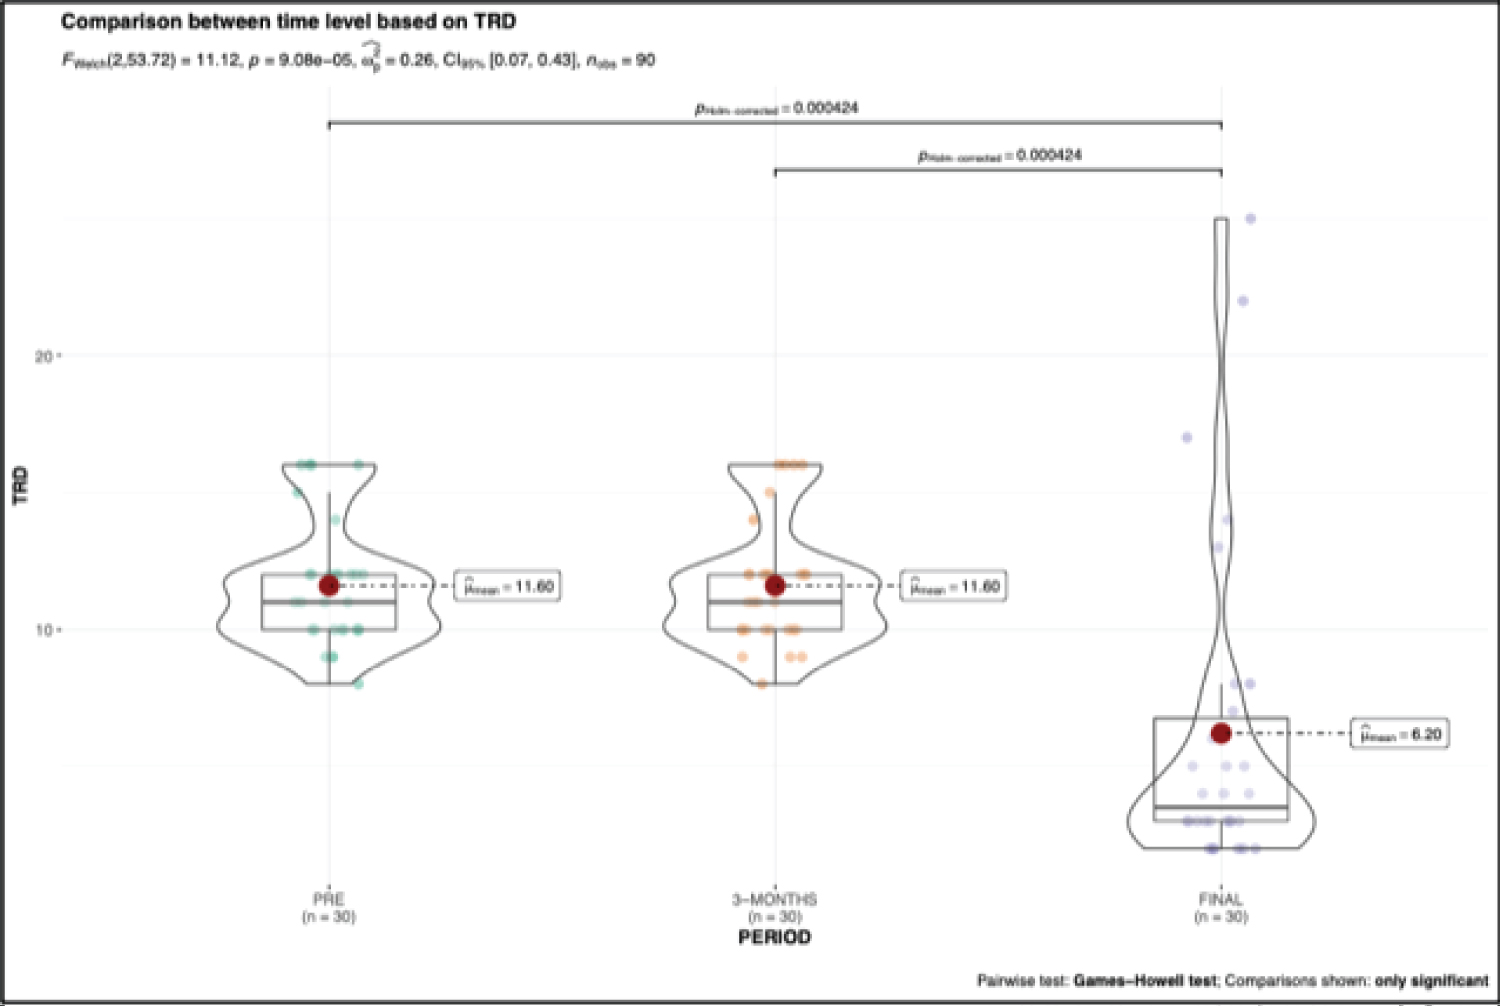 Graph 2: As the results of ANOVA shows significant difference in pre, 3-months and final follow-up for BCVA and TRD. Therefore, a post-hoc test was conducted to examine which groups differ significantly from others with respect to the mean for BCVA (Figure 1) and TRD (graph 2). The Games-Howell test analysis indicated a significant difference among the pairs pre-3-months (pHolm-corrected = 5.74e-05) and pre-final (pHolm-corrected = 6.87e-08) for the factor BCVA (Graph 1). A significant difference among the pairs pre-final (pHolm-corrected = 0.000) and 3-months-final (pHolm-corrected = 0.000) was also observed for the factor TRD (Graph 2).
View Graph 2
Graph 2: As the results of ANOVA shows significant difference in pre, 3-months and final follow-up for BCVA and TRD. Therefore, a post-hoc test was conducted to examine which groups differ significantly from others with respect to the mean for BCVA (Figure 1) and TRD (graph 2). The Games-Howell test analysis indicated a significant difference among the pairs pre-3-months (pHolm-corrected = 5.74e-05) and pre-final (pHolm-corrected = 6.87e-08) for the factor BCVA (Graph 1). A significant difference among the pairs pre-final (pHolm-corrected = 0.000) and 3-months-final (pHolm-corrected = 0.000) was also observed for the factor TRD (Graph 2).
View Graph 2
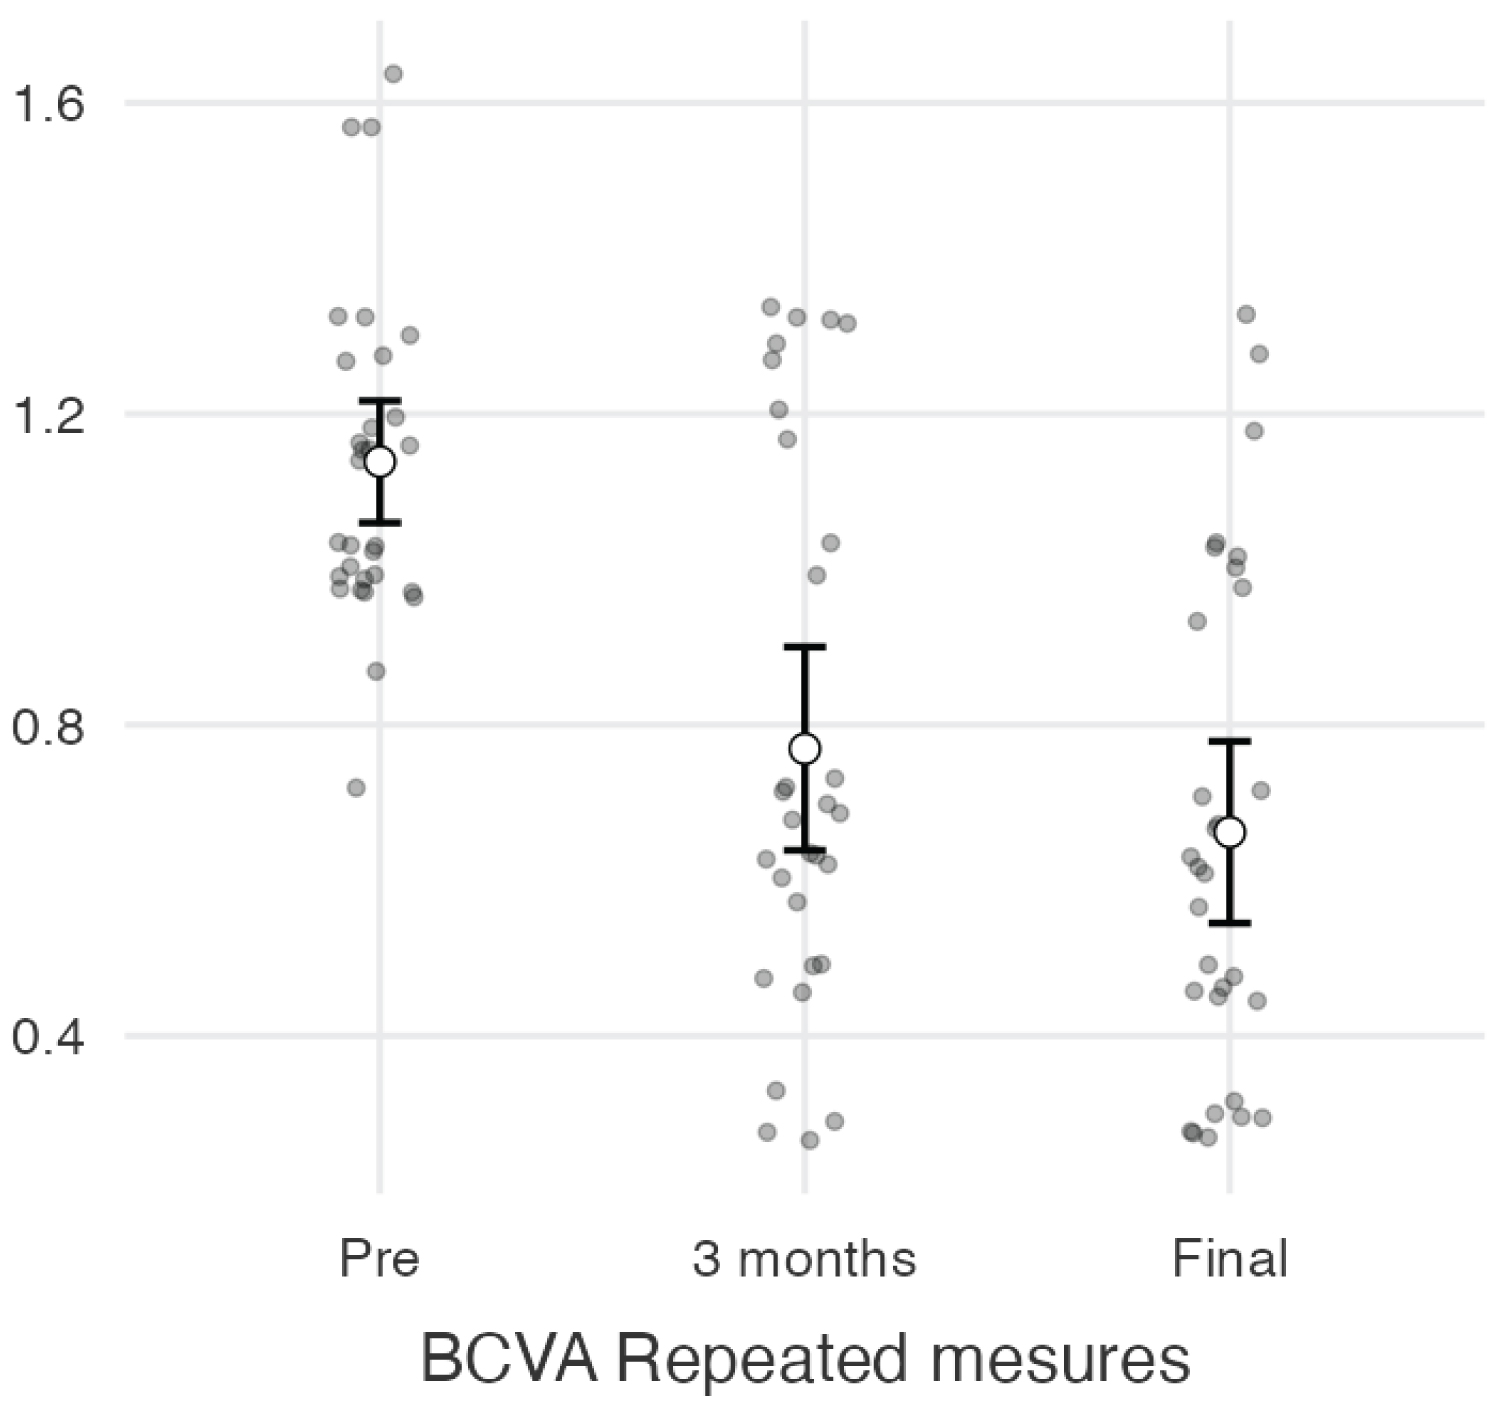 Graph 3: BCVA Repeated measures estimated marginal means, the graph showing the mean points for each stage (pre, 3 months and final) with the 95% confidence interval about the mean value.
View Graph 3
Graph 3: BCVA Repeated measures estimated marginal means, the graph showing the mean points for each stage (pre, 3 months and final) with the 95% confidence interval about the mean value.
View Graph 3
A comparison was made between primary vitrectomy and vitrectomy revision (due to redetachment of the macula) by employing Analysis of Variance (ANOVA) for continuous variables and Pearson χ2 test for categorical variables. The mean score of months postoperative BCVA in logMAR units for eyes with more than one surgery due to re-detachment of the macula and dense vitreous hemorrhage (1.0 ± 0.4) was significantly (p = 0.025) more than that of the eyes with one surgery only (primary vitrectomy) (0.7 ± 0.3). The mean score of final TRD resolution in weeks for eyes with more than one surgery (12.2 ± 8.1) was also significantly (p < 0.001) more than that of the eyes with one surgery only (primary vitrectomy) (3.6 ± 1.7). It is noticeable that among the patients having more than one eye surgery, the major reoperation cause was macular re-detachment (n = 5.0, 55.6%) followed by dense vitreous bleeding (n = 3.0, 33.3%). The mean score of three months CSFT for eyes with one surgery (337.1 ± 110.6) was significantly (p < 0.05) more than that of the eyes with more than one surgery due to re-operation caused by macular redetachment (259.9 ± 59.8). Additionally, the mean score of final CSFT for eyes with one surgery (316.7 ± 89.5) was significantly (p < 0.05) more than that of the eyes with more than one surgery (249.6 ± 46.5) Supplemental Table 4.
The result of Welch test indicated no significant correlation of BCVA with the different follow-up levels for eyes with recurrent TRD. Whereas the correlation of BCVA with follow-up secuential evaluations for eyes with one surgical treatment was found to be significant. The Bonferroni test indicates considerable difference in BCVA among the pairs preoperative and three months evaluation (p = 2.6e-08) and preoperative and final postoperative evaluation (p = 2.67e-05) for eyes with one surgical procedure (Graph 4 and Graph 5).
 Graph 4: Kaplan-Meier survival plot of LogMAR grouped by time PERIOD.
View Graph 4
Graph 4: Kaplan-Meier survival plot of LogMAR grouped by time PERIOD.
View Graph 4
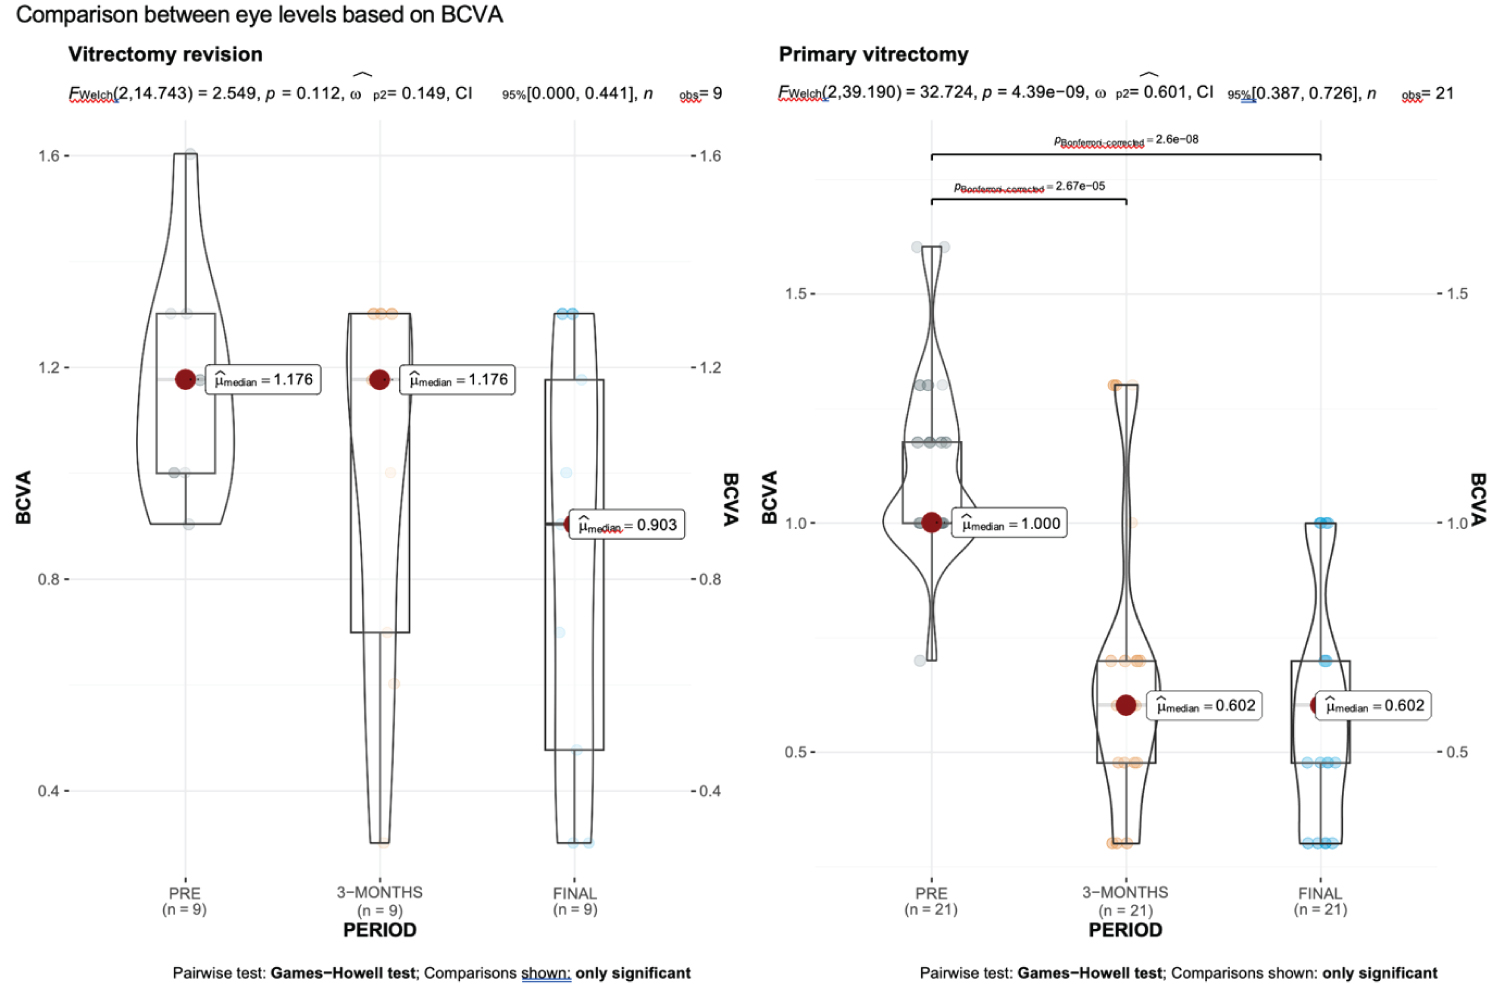 Graph 5: Comparison between preoperative, 3-months and final postoperative BCVA between the eyes with more than one surgery and eyes with only one surgery.
View Graph 5
Graph 5: Comparison between preoperative, 3-months and final postoperative BCVA between the eyes with more than one surgery and eyes with only one surgery.
View Graph 5
Mann-Whitney test findings showed significant difference in the mean final postoperative BCVA for abnormal (0.8 ± 0.3) and normal (0.3 ± 0.1) levels of OCT angiography. Whereas the mean difference of final TRD resolution in weeks for abnormal (6.3 ± 5.2) and normal (3.2 ± 1.0) levels of OCTA was found to be non-significant when correlated with the final postoperative BCVA (Supplemental Table 5). Composite Graph 6 shows the comparison between OCTA findings (abnormal vs. normal) for BCVA and TRD.
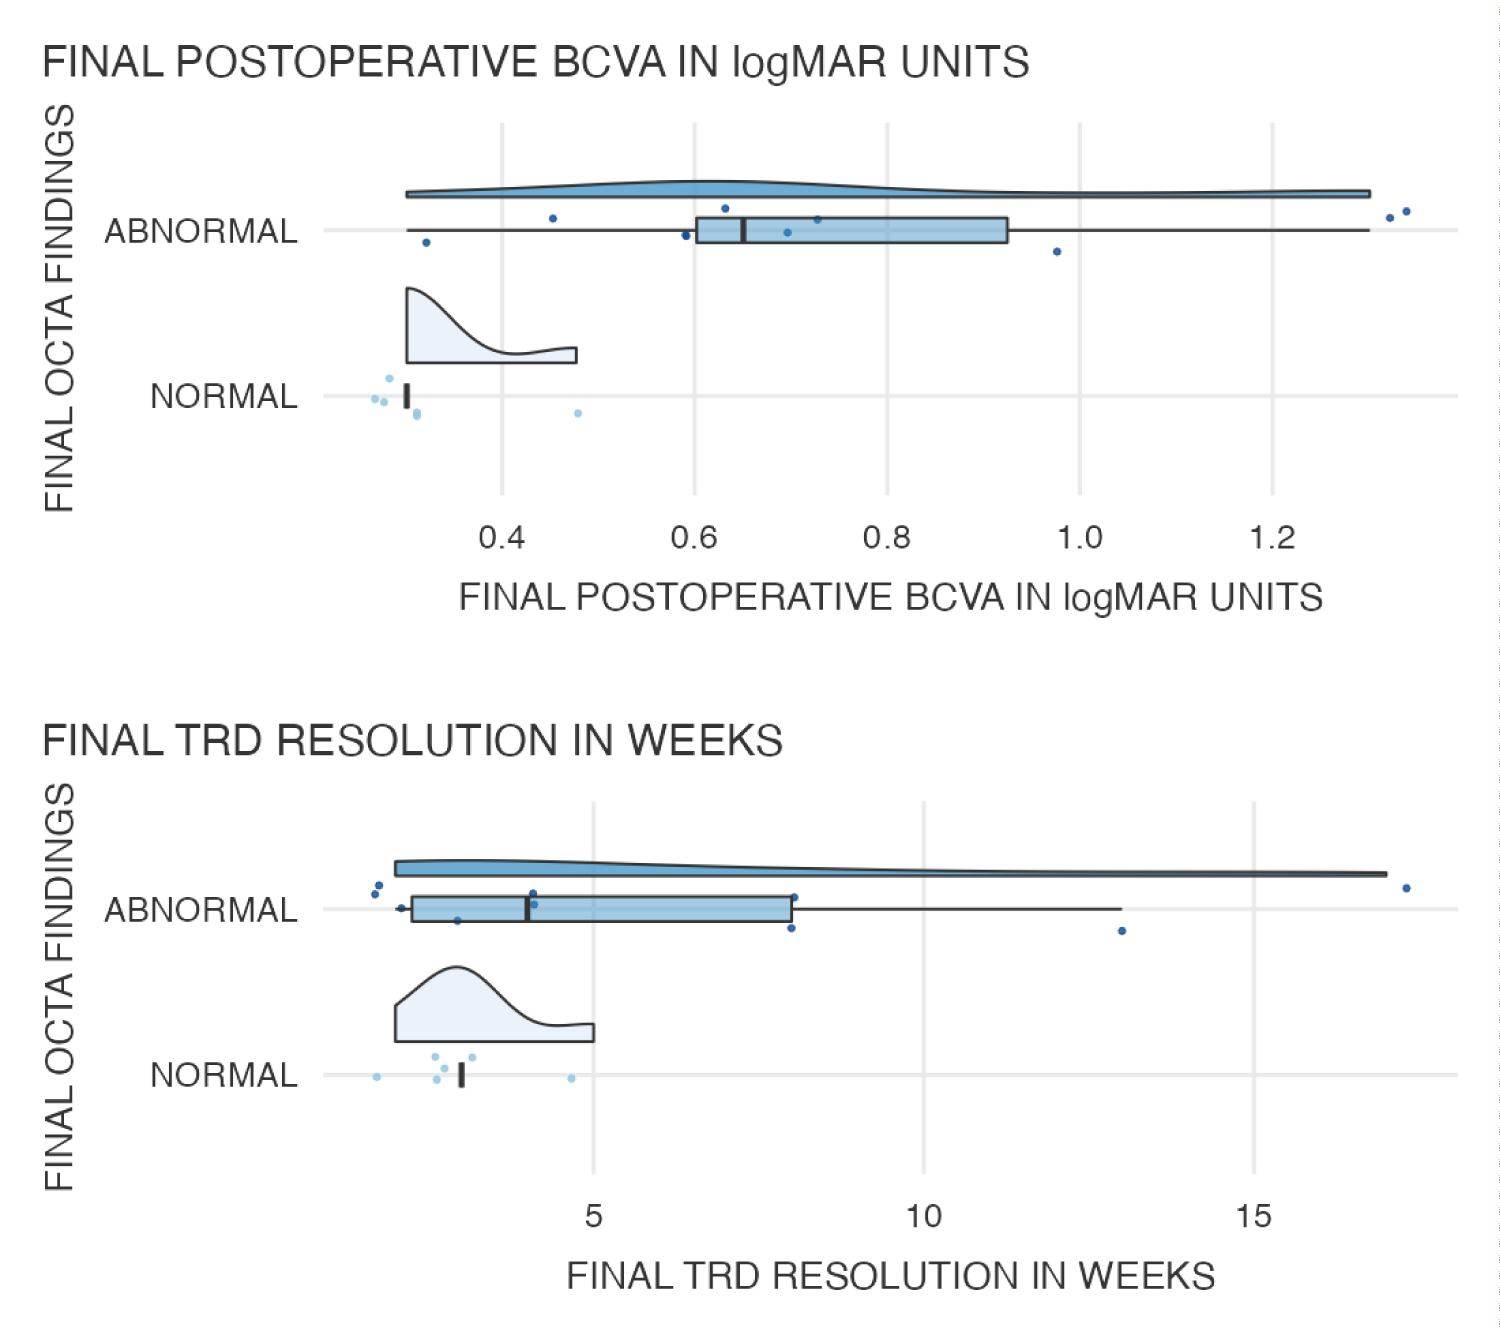 Graph 6: Comparison between OCT angiography findings (abnormal vs. normal) for BCVA and TRD.
View Graph 6
Graph 6: Comparison between OCT angiography findings (abnormal vs. normal) for BCVA and TRD.
View Graph 6
Mann-Whitney test was conducted to compare the mfERG testing (abnormal vs. normal) for BCVA and TRD resolution time. The findings showed no significant difference in the mean value of final postoperative BCVA with the final TRD resolution in weeks for abnormal and normal levels of mfERG testing (Supplemental Table 6 and Composite Graph 7).
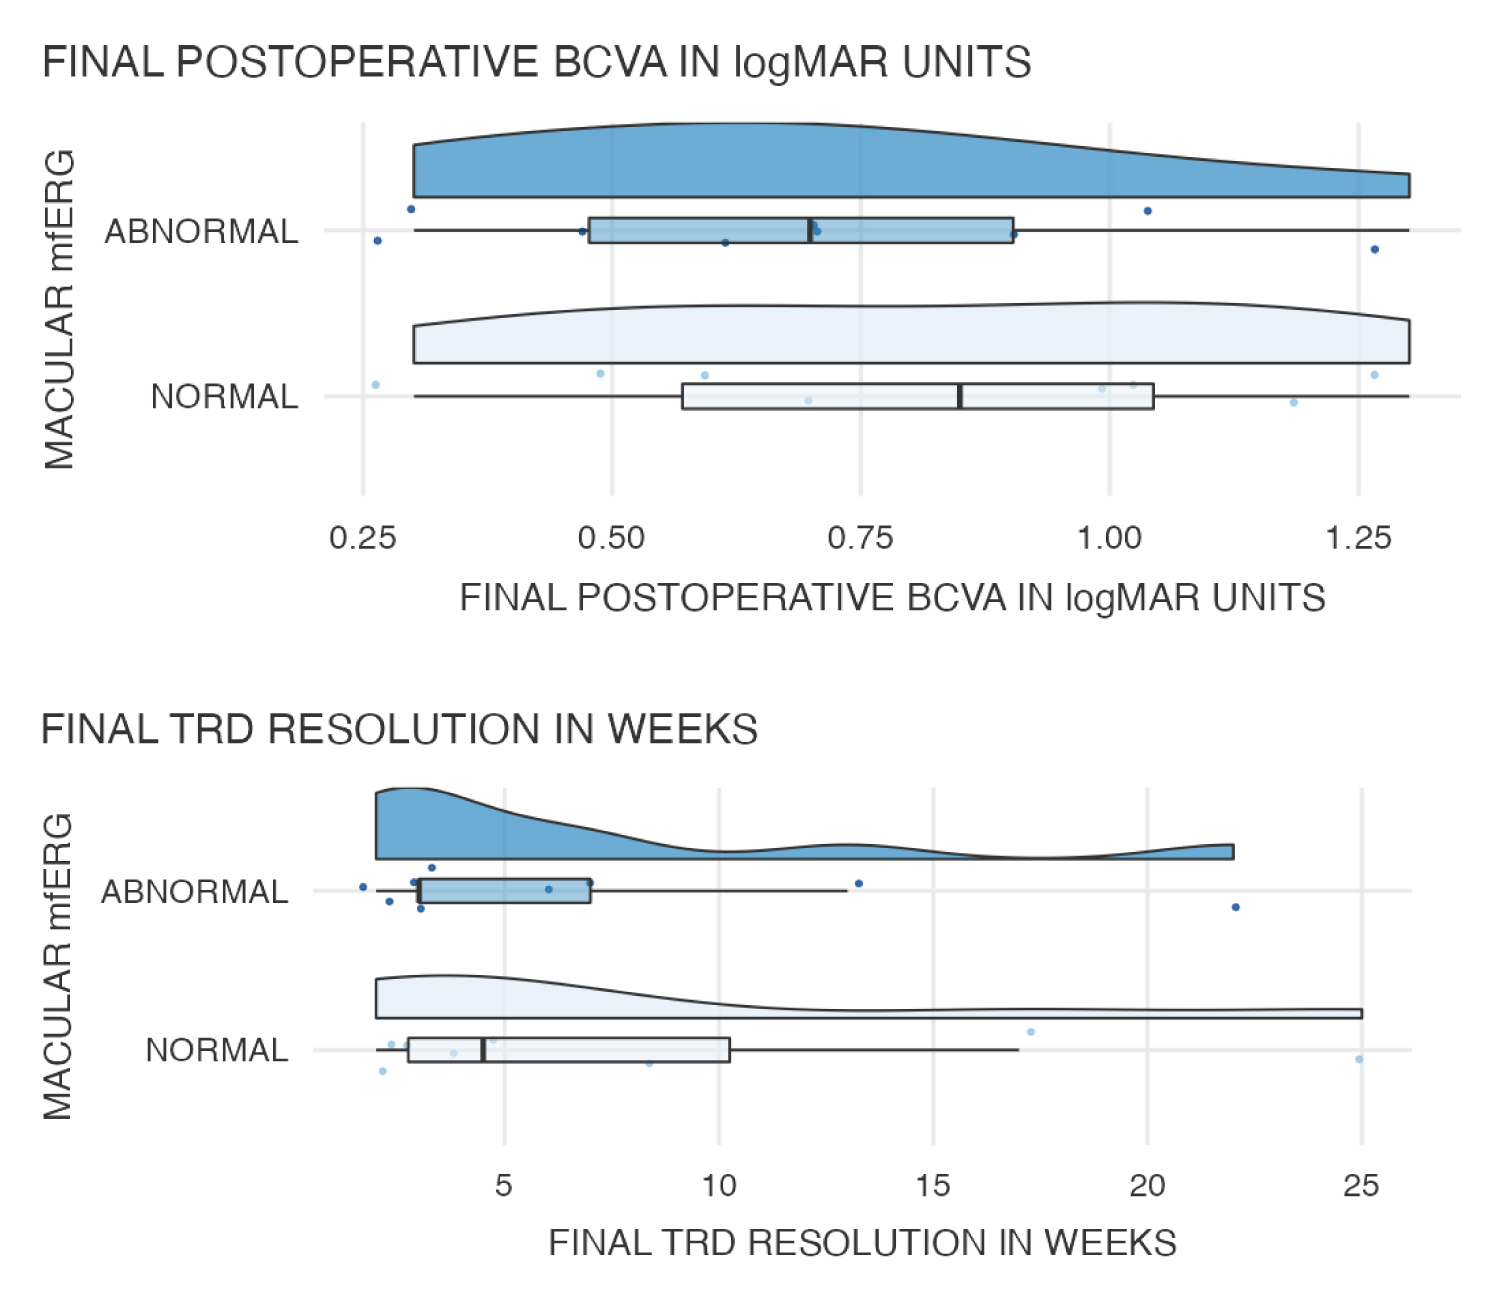 Graph 7: Comparison between mfERG testing (abnormal vs normal) for BCVA and TRD.
View Graph 7
Graph 7: Comparison between mfERG testing (abnormal vs normal) for BCVA and TRD.
View Graph 7
Mann-Whitney test was conducted to compare the 10- and 30-2 chromatic visual field testing (abnormal vs. normal) for BCVA and TRD. The finding shows no significant difference in the mean value of final postoperative BCVA and final TRD resolution in weeks for abnormal and normal levels of 10-2 and 30-2 chromatic visual field testing. Supplemental Table 7 and Composite Graph 8 shows the comparison between 10-2 and 30-2 chromatic visual field testing (abnormal vs. normal) for BCVA and TRD.
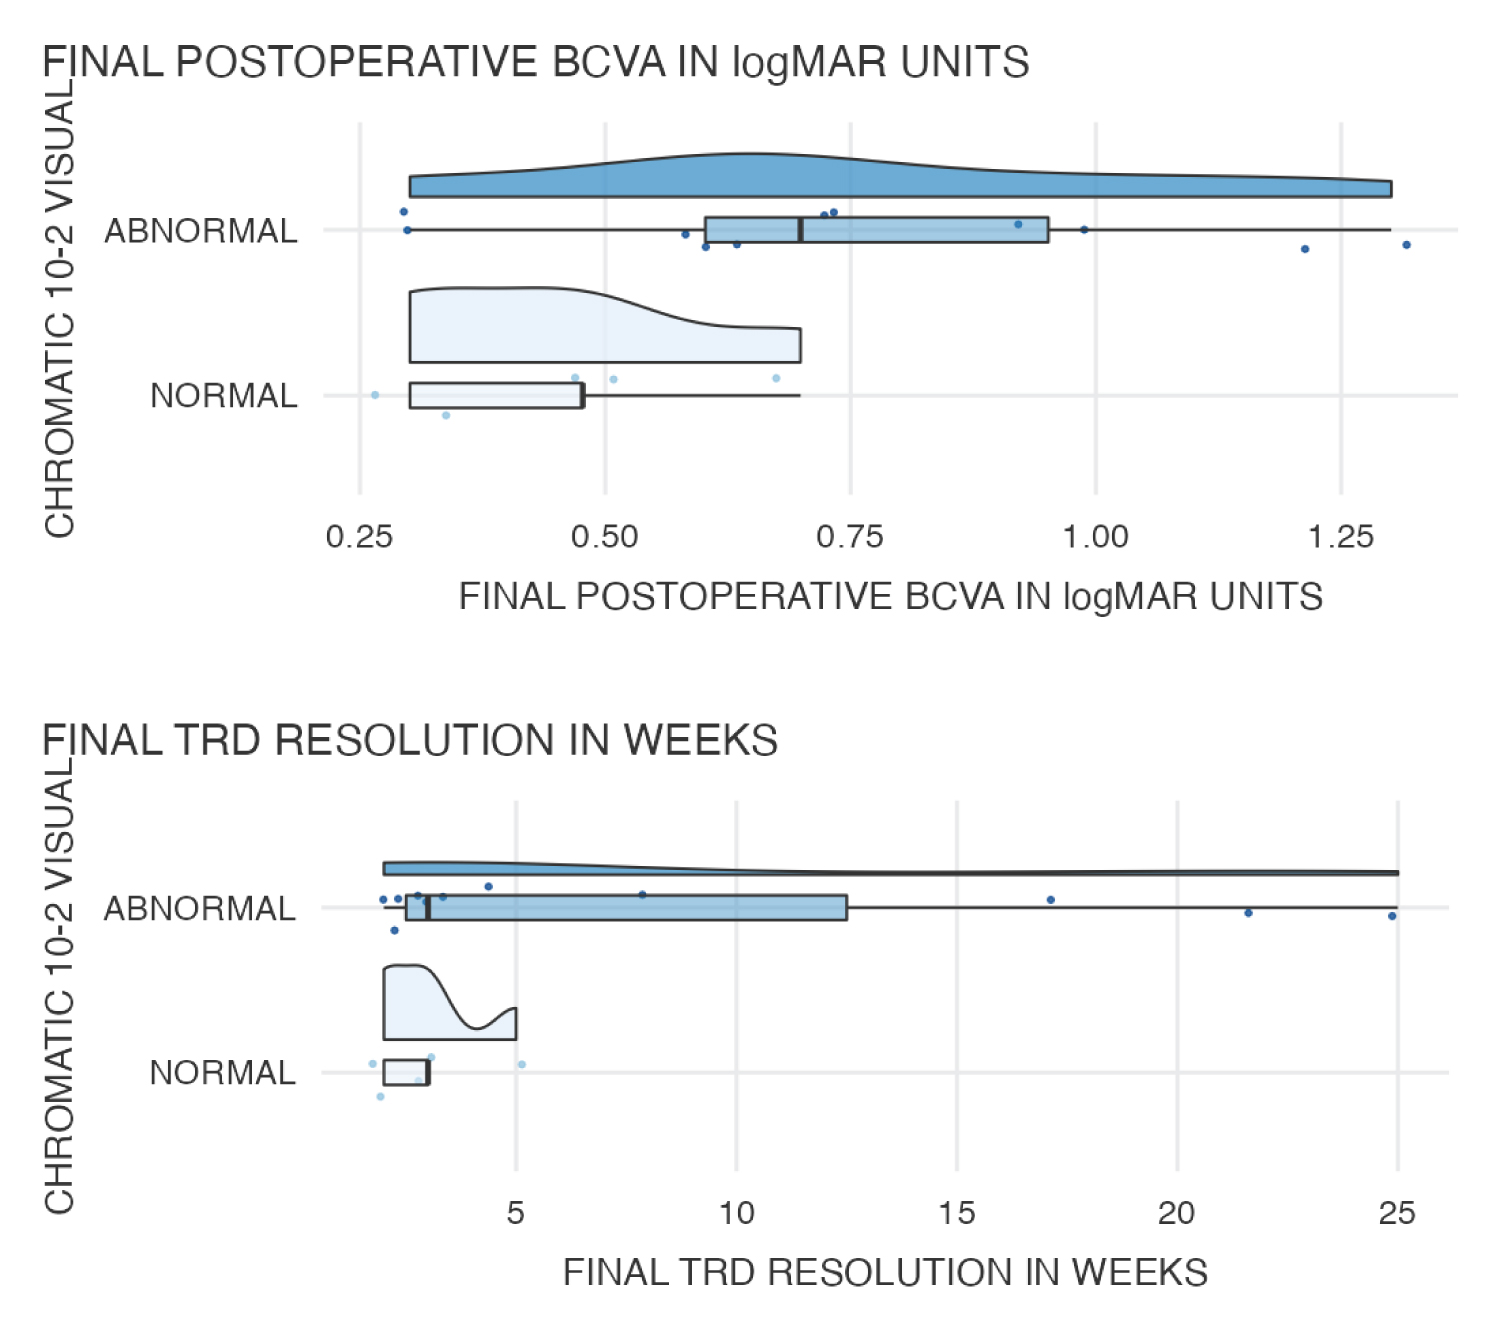 Graph 8: Comparison between chromatic visual field testing for BCVA and TRD.
View Graph 8
Graph 8: Comparison between chromatic visual field testing for BCVA and TRD.
View Graph 8
To describe the structural preoperative and postoperative SD-OCT findings, we used the terminology proposed by the International Nomenclature for Optical Coherence Tomography Panel report [31]. The structural SD-OCT findings (Figure 2l, Figure 2m, Figure 2t, Figure 3d and Figure 3e; Figure 3j and Figure 3k; Figure 4-hi, Figure 4-i3, Figure 4-i4, Figure 4j, Figure 4-j1 and Figure 4K) showed Foveal contour profile abnormalities, diffuse retinal layer thinning with CSFT abnormalities, IS/OS disruptions, and ELM abnormalities. In the OCTA evaluation the superficial and deeper capillary vascular plexus showed extensive perfusion abnormalities, choriocapillaris plexus evaluation revealed an abnormal choriocapillaris perfusion, the pericapillary foveal net was enlarged, asymmetrical and irregular, the quality of vascular density was abnormal (Figure 2j, Figure 2k, Figure 2r and Figure 2s; Figure 3f and Figure 3l, 13i, i1 and 12) (Supplemental Table 8).
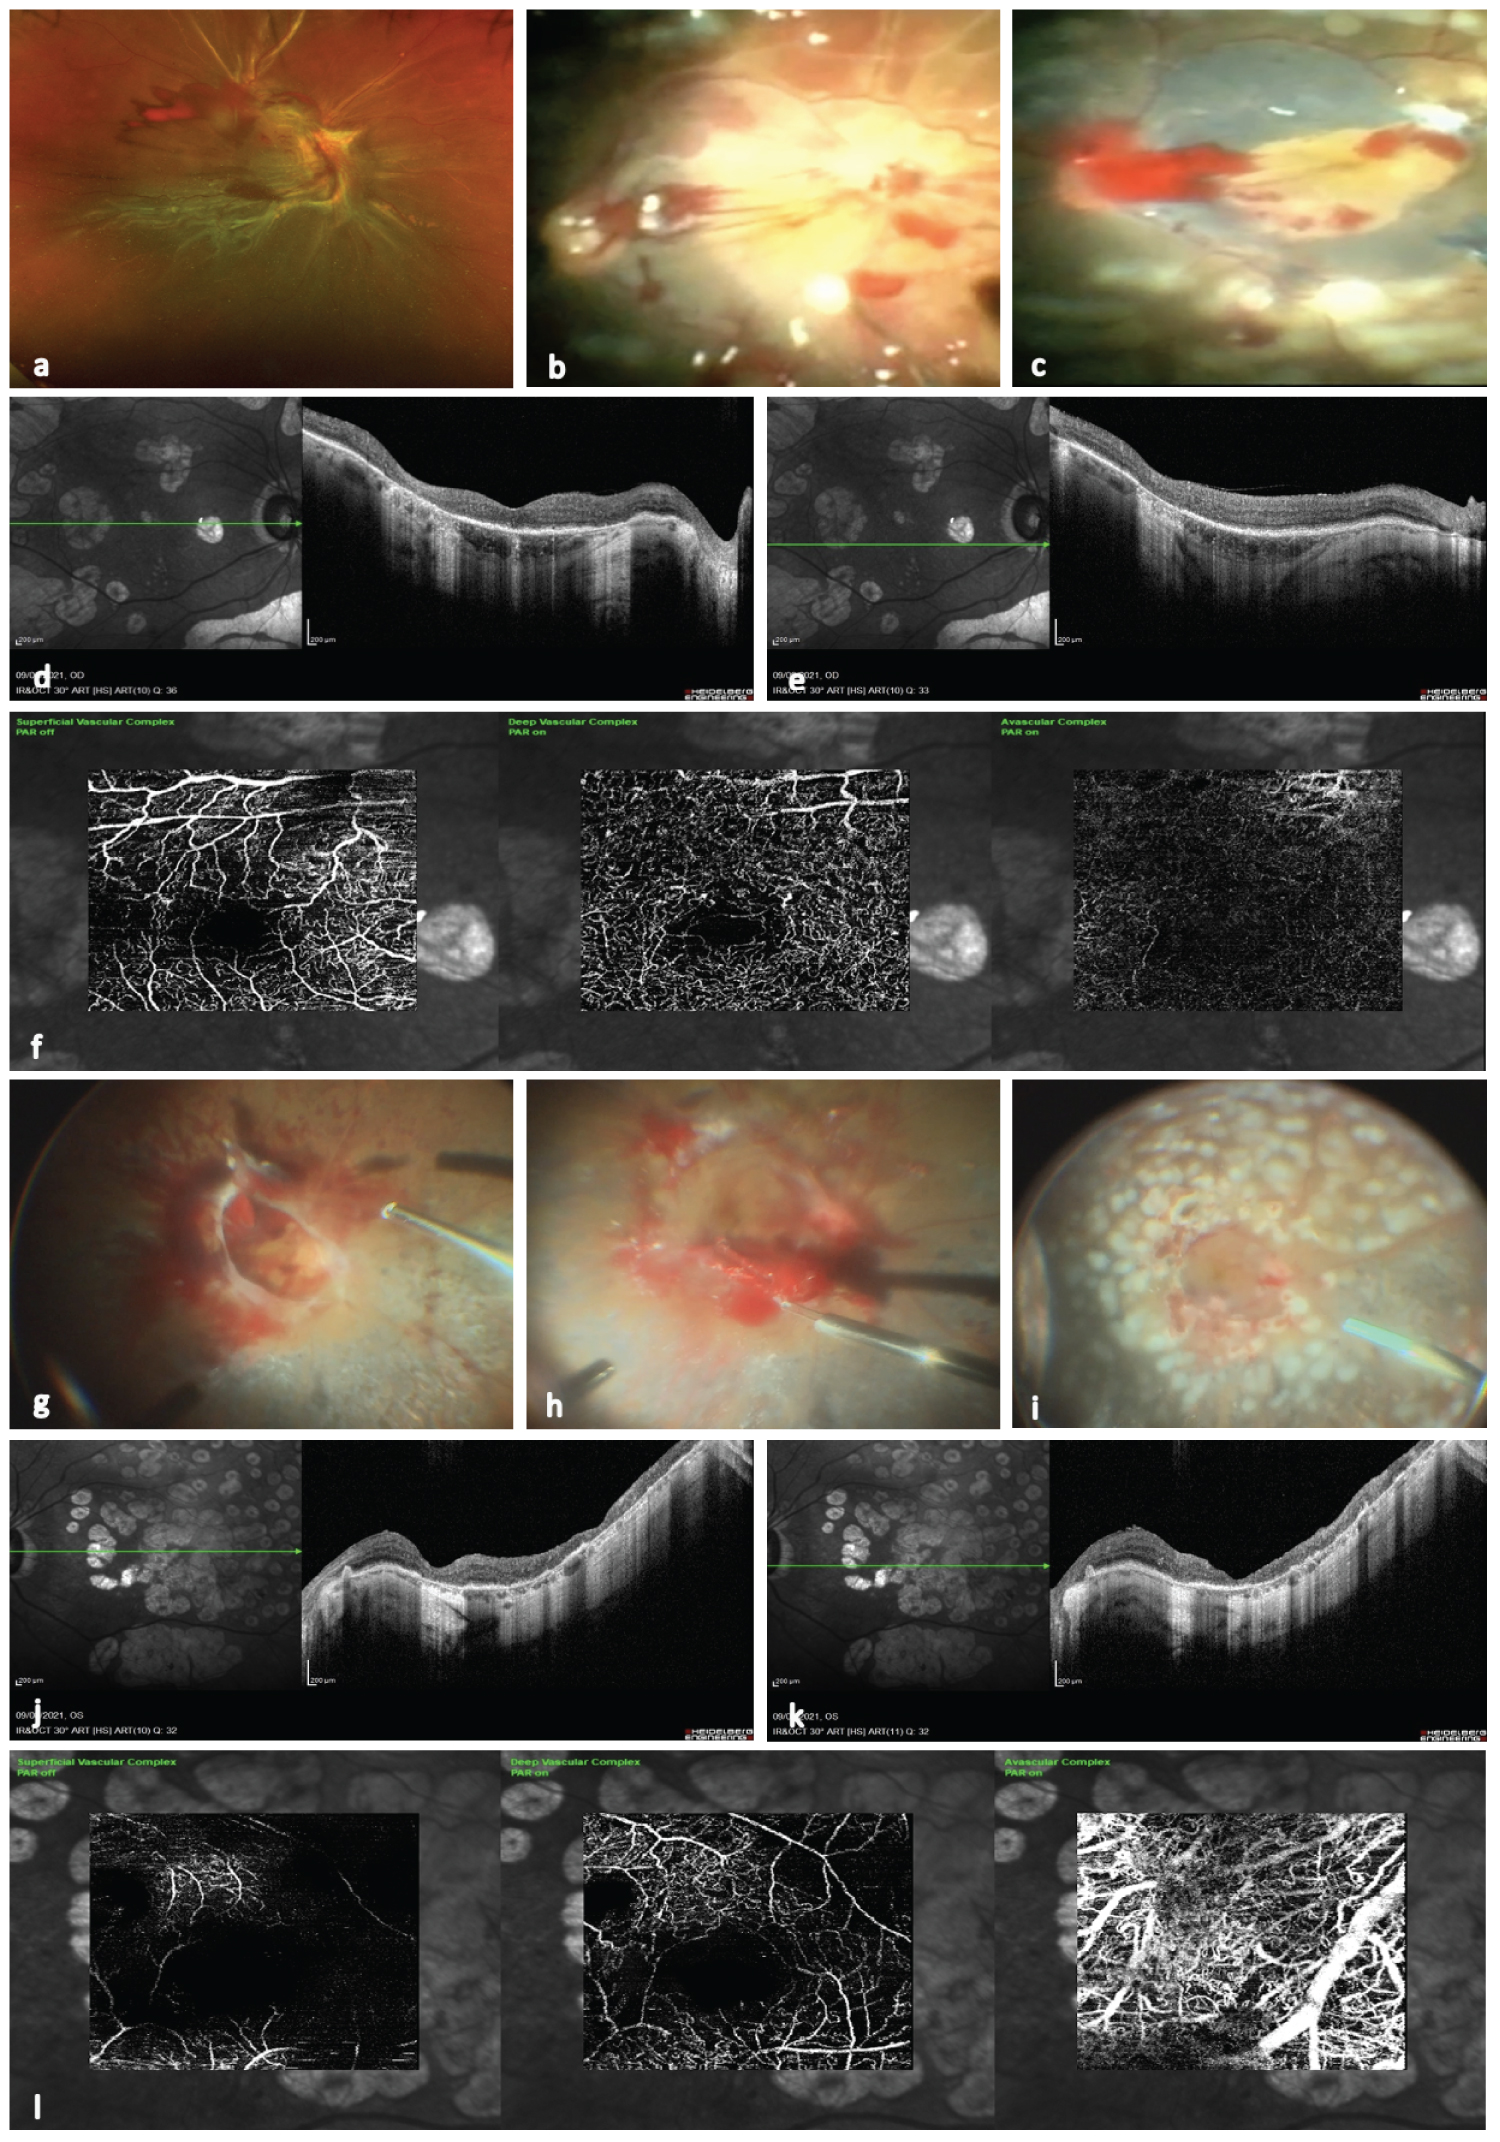 Figure 3: (a) Image with a preoperative diabetic tractional retinal detachment; (b) Image depicting a transoperative view once the retina has been reattached and some macular traction lines through the macula are seen; (c) Image showing the corresponding the stained and removed internal limiting membrane; d) Image depicting a 4 months postoperative spectralis horizontal b scan with some laser scars and irregular thinning with a well recovered macular contour, hard to define structural biomarkers and absence of diffuse retinal inner layer; e) Corresponding image at the final follow-up with a better recovered b-scan, the hype reflexive effect of the laser scarring is noted; f) En face OCTA showing some degree of irregular filling at the level of the superficial and deep vascular plexuses, notice that the choriocapillaris is pretty insufficient; g) Surgical view of a very complex diabetic TRD involving the macula in hammock fashion type TRD; (h) The macula has been release and passive blood and exploration is mandatory; (i) Image depict the corresponding appearance of the previous image with the retina totally reattached with extensive panretinophotocuagulation is seen; (j) Image showing diffuse and corresponding laser scarring retinal thinning, the macular contour is undistinguishable; (k) Corresponding final spectralis horizontal b scan depicting a thinner macular profile with diffuse thinning of the macular layers; (l) Postoperative en face OCTA image depicting irregular filling at the level of superficial plexus, with the deep plexus insufficiently filling due to capillary dropouts and irregular and enlarge perifoveal capillary net, the choriocapillaris is abnormal with compensatory and engorged choroidal vessels.
View Figure 3
Figure 3: (a) Image with a preoperative diabetic tractional retinal detachment; (b) Image depicting a transoperative view once the retina has been reattached and some macular traction lines through the macula are seen; (c) Image showing the corresponding the stained and removed internal limiting membrane; d) Image depicting a 4 months postoperative spectralis horizontal b scan with some laser scars and irregular thinning with a well recovered macular contour, hard to define structural biomarkers and absence of diffuse retinal inner layer; e) Corresponding image at the final follow-up with a better recovered b-scan, the hype reflexive effect of the laser scarring is noted; f) En face OCTA showing some degree of irregular filling at the level of the superficial and deep vascular plexuses, notice that the choriocapillaris is pretty insufficient; g) Surgical view of a very complex diabetic TRD involving the macula in hammock fashion type TRD; (h) The macula has been release and passive blood and exploration is mandatory; (i) Image depict the corresponding appearance of the previous image with the retina totally reattached with extensive panretinophotocuagulation is seen; (j) Image showing diffuse and corresponding laser scarring retinal thinning, the macular contour is undistinguishable; (k) Corresponding final spectralis horizontal b scan depicting a thinner macular profile with diffuse thinning of the macular layers; (l) Postoperative en face OCTA image depicting irregular filling at the level of superficial plexus, with the deep plexus insufficiently filling due to capillary dropouts and irregular and enlarge perifoveal capillary net, the choriocapillaris is abnormal with compensatory and engorged choroidal vessels.
View Figure 3
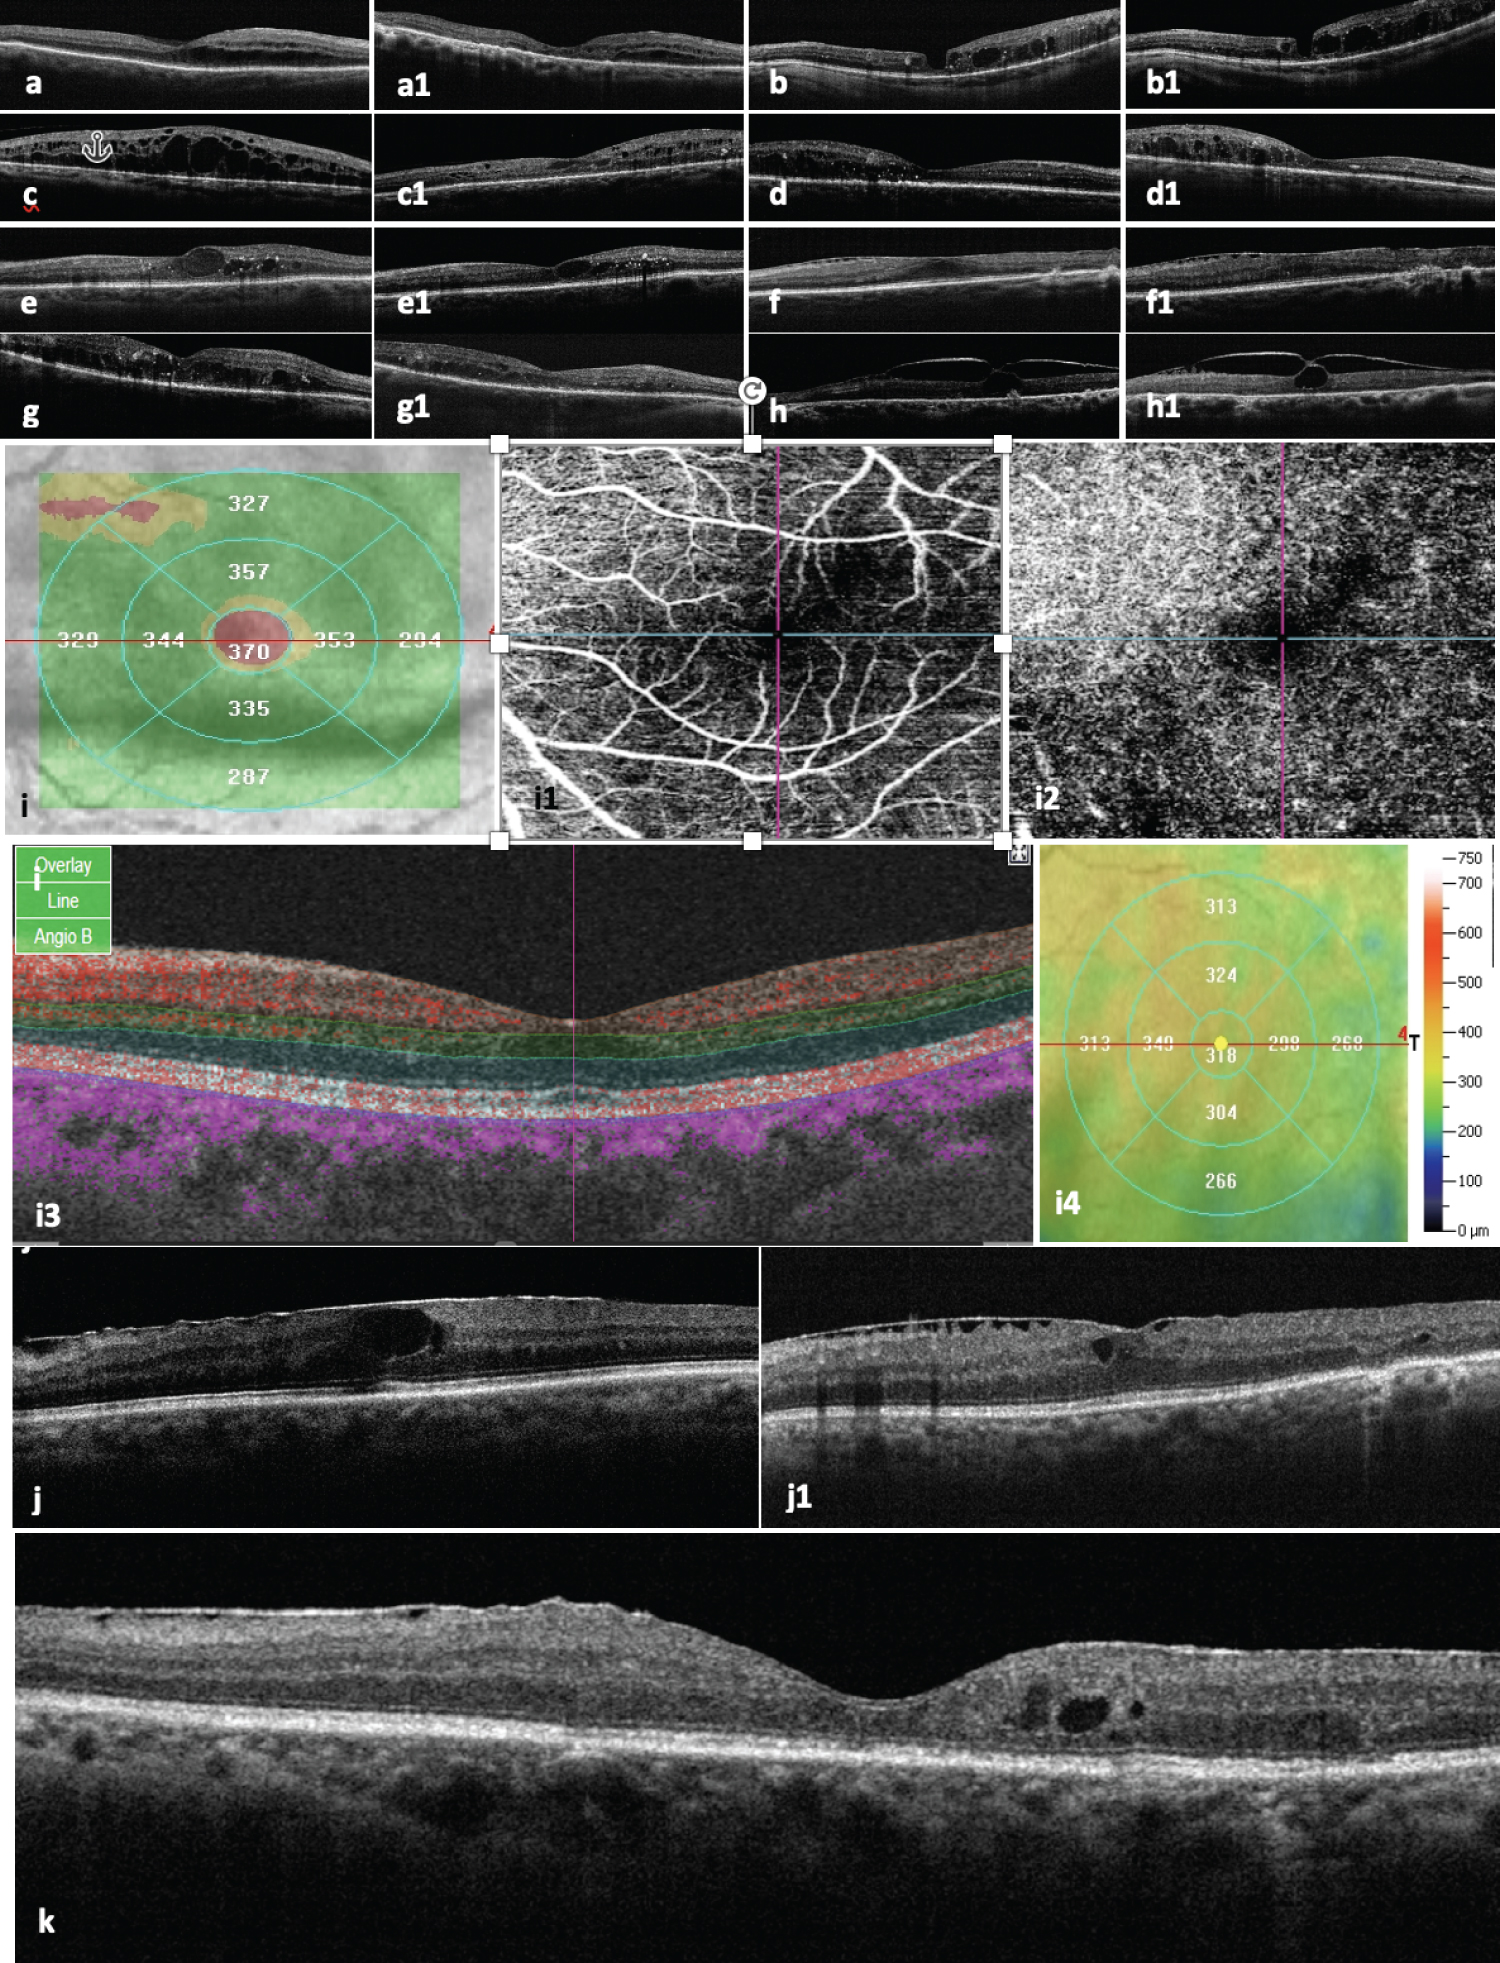 Figure 4: Postoperative structural findings.
(a and a1) images of postoperative horizontal b scan at 4 months postoperatively and last final long-term evaluation respectively of a successfully reattached diabetic tractional retinal detachment, a thin macula is observed, with residual subretinal fluid. Main OCT biomarkers are difficult to recognized, some disorganization of retina inner layers (DRIL) is still recognized in the serial OCT examination; (b and b1) serial postoperative images of the same surgical case depict a very atrophic macula, with a long-standing chronic cystic macular edema and the evidence of partial-thickness superficial macular hole, there is some confluence of the large intraretinal chronic cystic spaces; (c) Image depicts a four months postoperative structural severe cystic edema which resolved at the final postoperative OCT evaluation (c1); (d and d1) Images of serial postoperative macular edema worsening despite of successfully macular reattachment; (e and e1) Images depict residual chronic cystic macular edema, the postoperative final OCT shows some edema resolution but still with hyperreflective spots corresponding to lipoprotein intraretinal exudates deposition; (f and f1) 4 months and final evaluation serial horizontal B-scans respectively depicting residual but important macular thickening associated to the presence of epiretinal membrane proliferations (ERMs), there is evidence of chronic DRIL, however, central subfoveal ellipsoid band is recovered; (g and g1) images depict lipoprotein intraretinal exudative deposition, with drill and large external chronic cystic spaces are seen. Edema resolution with residual macular edema is still seen in the last follow-up OCT evaluation (g1); (h and h1) Images show a persistent residual vitreomacular traction despite of a successfully reattachment of the macula; i) Image with a postoperative topographic irregular macular thickening; i1) En face OCTA postoperative corresponding image of the SVP; i2) En face OCT angiography image of DVP showing some irregularities of the deep macula circulation with an enlarged FAZ; I3) Corresponding horizontal final postoperative OCT; (j) Image depicts an irregular, diffuse macular thickening associated to ERMs with large chronic cystic intraretinal spaces and some central subfoveal DRIL; (j1) OCT b scan image of central residual macula edema associated to ERM proliferation; (k) Magnified image of a postoperative residual chronic macula edema associated to ERMs proliferation with some wrinkling of the inner retina layer, some DRIL and the presence of middle layers intraretinal chronic residual large cystic spaces due to residual chronic diabetic macula edema.
View Figure 4
The microperimetry findings (Figure 2n) showed a correlation between the SD-OCT macular pathology and the corresponding functional abnormalities determined by mfERG, and perfused abnormalities found on OCT angiography (Figures 2j, Figure 2k, Figure 2r and Figure 2s; Figure 3f and Figure 3l; Figure 4-j1 and Figure 4-j2). However, there was no correlation between the localized locus with reduced macular sensitivity and the corresponding retinal thickness on the OCT. The corresponding OCTA B scan depicts intraretinal vascular patterns and epiretinal membrane proliferation (Figure 2t; Figure 4-j1 and Figure 4-j2 images). A reduced mean retinal sensitivity, a deeply reduced foveal sensitivity with abnormal fixation stability, and an excentric location pattern with an abnormally depressed retinal sensitivity analysis map were the main findings on microperimetry. The chromatic campimetry revealed reduced retinal sensibility without any speciphic color discrimination abnormalities (Figure 2o). The mfERG showed outer retinal and photoreceptor abnormalities and ischemic patterns of the middle layers of the retina and also showed amplitude reduction on the N1 wave, an abnormally prolonged P1 implicit time, and a deeply abnormal mfERG elevation map (Figure 2p and Figure 2q; Supplemental Table 9).
Technology has improved over the past decade, allowing the development of effective small-gauge vitrectomy, wide-field viewing systems, advanced fluidics, and precise tissue control, which may be especially useful in complex cases of TRD involving the macula. Thus, the complications of PDR may be addressed both medically and surgically, as we described in this report. However, the outcomes of surgical treatments for diabetic patients have not undergone a similar change [32,33].
The probability of DR improvement is more likely in eyes receiving anti-VEGF injections than in eyes receiving laser treatment [25]. Eyes with vitreous hemorrhage that precludes the use of adequate laser treatment have traditionally two treatment options: wait for the hemorrhage to clear, with the inherent risk of rebleeding, and attempt additional laser treatment, or perform vitrectomy. The DRCR.net protocol N study examined the utility and effectiveness of intravitreal ranibizumab in comparison with intravitreal saline for facilitating clearance of vitreous hemorrhage and permitting and adequate PRP laser treatment [5]. Recurrent vitreous hemorrhage was noted in 6% of the eyes treated with ranibizumab vs. 17% of those treated with saline (P = 0.01). The 1-year results demonstrated low rates of in both arms (38% overall; 35% in the ranibizumab arm vs. 41% in the saline arm, P > 0.05) with a modest improvement in the PRP completion rate. The recently published DRCR.net Protocol S study examined the outcomes comparing PRP treatment with intravitreal ranibizumab for eyes with PDR [34]. Primary outcomes were measured at 2 years. Eyes that received ranibizumab demonstrated visual acuity (VA) outcomes that were non-inferior to those of eyes treated with PRP, had reduced OCT thickness, and had less need for vitrectomy surgery [33].
Diabetic macular ischemia due to microangiopathy leads to decreased perifoveal capillary blood flow, which in turn causes chronic ischemia of the retinal tissue. By assessing the point-to-point correlation between SD-OCT and non-perfusion on OCTA, we observed that retinal capillary nonperfusion is associated with photoreceptor compromise on OCT which is re-reflected in an evident alteration of the IS/OS (ellipsoid) band continuity and reflectivity. This study highlights a new concept explaining the possible contribution of the retinal deep capillary plexus to photoreceptor compromise in the tractional manifestations of the diabetic macula. Macular ischemia at the deep capillary plexus may play an important role in these outer retinal changes and photoreceptor ischemic compromise. We speculate a significant amount of ischemia of the deep capillary plexus as long as the macula remains detached from the RPE. This study included 30 consecutive and selected eyes with a mean duration of diabetes mellitus of 18.4 ± 4.8 SD years, and mostly all consecutive eyes showed outer retinal disruption revealed by SD-OCT and SS-OCT that colocalized to areas of enlargement of the FAZ and macular capillary nonperfusion in the corresponding OCTA in the postoperative serial examination, so we inferred that photoreceptor damage with ellipsoid band disruption, presence of DRIL and macular ischemia are the possible reasons for the poor visual improvement after the remission of macular edema [27,34] or diabetic TRD surgical resolution according with our results.
Foveal DRIL with a large FAZ has been shown to correlate with poor BCVA in patients with resolved DME [35], but there is very limited literature discussing how to establish the correlation between quantitative OCTA features and clinical testing parameters and to verify whether quantitative OCTA parameters can serve as objective factors to predict visual improvements after treatment with surgery for TRD involving the macula. In this study and due to the complex of the pathology at the level of the vitreoretinal interface and because in most of the eyes included the media were cloudy due to hemorrhage, or not structurally defined by the presence of epi and preretinal fibrovascular complexes, and according to the design of this protocol, no perfusion evaluation was performed by preoperative OCTA. In this study, four OCTA biomarkers, namely, the FAZ area (FAZ-A), FAZ contour irregularity (FAZ-CI), and vessel density (VD), superficial and deep vascular plexuses were comprehensively analyzed along with their correlation with clinical markers, that is, BCVA and structural markers such as central subfoveal thickness (CSFT), presence or not of DRIL, and EZ appearance to determine how these SD-OCT and OCTA biomarkers change longitudinally over the postoperative period and how they correlate with BCVA, campimetric, microperimetry, and mfERG findings, additionally, in relation with small data set of microperimetry, chromatic visual field testing and mfERG evaluation, definitive conclusions could not be drawn but some important findings and clinical considerations are made.
Through our clinical experience with superficial and deep Vascular networks, we have found that, unlike FA, OCTA allows in-depth study of vascular changes in DR. Changes in the structure of the superficial network can be observed in patients with macular ischemia, and the quantification of macular ischemia has potential as a biomarker for DR, since the demarcation of nonflow areas is obvious in the superficial plexus.
We found that poorer VD in both the superficial and deep capillary plexuses in the parafoveal area was correlated with presence of DRIL, ellipsoid band abnormalities, abnormal CSFT with poorer final postoperative BCVA. This finding is consistent with that of a previous study of others [36-39]. The outer parafoveal VD in the superficial layer has been shown to predict visual improvement after ranibizumab treatment, but this finding was not demonstrated in eyes after macula reattachment surgery [37]. VD in the macula could also be used in clinical applications to evaluate the perfused status of the macula after surgery, as demonstrated in this report.
Previous studies have shown that increased FAZ-A or FAZ-CI, an increased nonperfusion area, decreased VD at the central macula in OCTA were associated with worsening of DR [38,40]. Here, we report our experience of evaluating capillary network of the FAZ-A and FAZ-CI as well as VD non-quantitative evaluation analyses as potential signs of macular ischemia in successfully operated eyes with TRD involving the macula. This study did not evaluate the feasibility of using OCTA to automatically quantify capillary nonperfusion as a potential sign of macular ischemia in eyes that undergo vitrectomy due to TRD involving the macula.
It is possible that macular ischemia, in addition to photoreceptor disruption, also contributes to poor vision in our patients. Moein, et al. [32] showed that a larger FAZ was correlated with poor VA in patients with resolved DME. In our report, a large FAZ was poorly correlated with BCVA and a lack of DME in the postoperative follow-up period.
Durvin, et al. [41] showed that the VD in the superficial layer, not the deep layer, was correlated with the BCVA in DR, perhaps due to the projection artifact on the deep layer, with improvements in the technique for projection artifact removal, enabling better visualization of the two distinct main retinal capillary plexuses.
In the present study, we longitudinally evaluated postoperative foveal DRIL and other SD-OCT and SS-OCT parameters, such as CSFT and EZ zone integrity and reflectivity, to assess how they may predict VA during follow-up in eyes undergoing successful surgery for TRD involving the macula. Our results demonstrate that DRIL can resolve over time and that resolution of DRIL is a good predictor of subsequent improvement in the final BCVA. The decreased DRIL abnormalities presumably represent anatomical improvement toward a more normal morphology. We hypothesized that macular ischemia and enlargement of the FAZ may contribute to outer retinal and photoreceptor disruption on SD-OCT in diabetic patients in the absence of diabetic macular edema (DME), as a possible consequence of ischemia at the level of the deep capillary plexus. Whether reversibility potentially declines with increasing duration of DRIL or can be induced to occur is unknown, but these findings would have important implications in the timing of diabetic TRD surgery.
It is unknown exactly what DRIL, as demonstrated on OCT images, may represent histologically. This strong and very distinct biomarker may indicate tissue damage or a lower probability of tissue recovery. We believe that the mechanisms by which DRIL affects BCVA have not yet been determined, and further histological correlation is needed. Thus, we are also trying to correlate the postoperative structural evaluation of foveal DRIL with OCTA findings in eyes with successful surgical reattachment of the macula. These findings may support our results showing that increased DRIL length and, thus, possibly less viable remaining tissue are associated with worse visual outcomes in successfully repaired TRD involving the macula.
DRIL affecting 50% or more of the central 1-mm-wide zone centered on the fovea (foveal DRIL) is associated with worse VA. This description holds true even in eyes with reduced vision despite TRD anatomic resolution. The strong association of foveal DRIL with the BCVA in a previous cross-sectional study [37] supported the longitudinal investigation of foveal DRIL as a potential biomarker of future BCVA in eyes with current TRD involving the macula.
Reports on PDR after surgery and numerous studies of various non-vascular macular diseases have shown that disruption of the outer retina mainly the ellipsoid and ELM biomarkers are significant predictors of visual prognosis [39,40]. In the present study, in the analysis of Variance (ANOVA) and Pearson χ2 chi-squared test the presence or length of the DRIL and the integrity of the ELM line and EZ zone were not considered as factors that may predict visual outcomes. However, the same analysis showed that macular redetachment factor, TRD resolution in weeks, as well as CSFT in the group of more than one surgery compared with the only one surgery group, but not the EZ band nor the ELM lines abnormalities were associated with better visual outcomes. On regard with chromatic visual field testing all the patients tested shown different degrees of visual field abnormalities in macular sensibility on the 10-2 and 30.2 visual field testing without been able to demonstrate any special cone-selected color discrimination abnormalities, the eyes which ended with final BCVA less than 20/200 (1.00 in logMAR units) showed deeply abnormal 10-2 and 30-2 visual field testing.
The study failed to detect any association between SD-OCT variables and subsequent BCVA in eyes with resolved TRD involving the macula; this failure may have occurred because we did not include the multiple preoperative abnormalities in this group, and not a separate analysis was performed for each underlying abnormality. The present study shows that certain biomarkers are very important once the macula has been successfully reattached. Another advantage it has given us the information that once the macula has been detached and depending on the qualities of perfusion of the eye, the issue of macula detachment has to be attended in a timely and careful way to reattach the macula and ensure that the perfusion mainly of its outer layers is resumed. It is indicated in postoperative multimodal evaluations where better results are shown when the eye underwent a timely successfully surgery with total diabetic TRD resolution.
In conclusion, to best of our knowledge, this is one of the first multicenter reports that correlated DRIL resolution, OCTA vascular plexus findings, and other physiological and functional patterns made serially besides BCVA evaluation after the resolution of TRD involving the macula. We observed some recovery of structural biomarkers with improved VD and capillary structuring at the level of the deep plexus of the macula. The foveal area remained irregular and enlarged without showing recovery data, all this was correlated with a better final visual acuity, additionally, in relation with small data set of microperimetry, chromatic visual field testing and mfERG evaluation, definitive conclusions could not be drawn but some important findings and clinical considerations are made. These functional evaluations performed at the end of clinical follow-up were deeply abnormal mostly in all eyes tested.
Our study demonstrates that diabetic ischemia is largely responsible for poor visual outcomes and that the limiting factors appear to be at the vascular and cellular levels. The final postoperative BCVA appears to be associated with multiple factors as the preoperative perfused status of the macula, the control and possible sudden changes in the transoperative perfused status of the macula and the subsecuent postoperative control of the perfused variables.
This report expands the knowledge of the significance of DRIL and other biomarkers in OCT and some biomarkers in OCTA in successfully operated eyes due to TRD involving the macula by showing the effect of different resolution patterns on BCVA recovery.
Further research is needed to determine the best timing to perform surgical interventions in patients with TRDs involving the macula secondary to PDR to minimize irreversible damage to the retinal tissue and improve BCVA in these patients.
This retrospective study adhered to the tenets of the Declaration of Helsinki, received full ethical approval from the Research Ethics Committees, and was approved by the Institutional Review Committees and the Teaching Departments of the 3 institutions enrolled (no reference number is provided for retrospective studies by these institutions). Written informed consent in accordance with the institutional guidelines was obtained from all the patients.
Obtained.
No proprietary interests, conflicts of interest, financial disclosures, or affiliations related to this study exist.
MAQR, original idea, writing the manuscript, dataset interpretation, statistical analysis interpretation, final revision, conclusions; EAQG, figures artwork, statistics, tables, graphics; JGMN, statistics, tables, graphics; FEC, photographic material compilation; BMA, photographic material compilation; JHKL, photographic material compilation; JMN, statistical analysis, MM, final revision, statistical analysis; VLG, final revision, statistical analysis, artwork and figure formatting, figure text editing; FGW, final revision.
The photos, composite figures and laboratory studies to support the findings of this study may be released upon written application to the Photographic, Psychophysics laboratory and Clinical Archives department at Instituto of Ophthalmology Fundacíon Conde de Valenciana (Non-profit Organization), Chimalpopoca 14, Colonia Obrera, Mexico City 06800, Mexico and from the Corresponding Author upon request.
The authors declare that there is no conflict of interest regarding the publication of this paper.
No funding or grant support was received for this study.
We express our deep appreciation to the technical staff of the three participant institutions, Retina Service at the Instituto de Oftalmologia, Fundacion Conde de Valenciana, Mexico City, Mexico. Retina specialist at the American British Cowdray hospital and Retina service at the Hospital Juarez, Mexico.