The objective of this study is to assess the usefulness of contrast enhanced MRI liver using hepatocyte specific contrast agent in the hepatobiliary phase to determine liver function in the form of a model for end-stage liver disease (MELD) score and a new model for end-stage liver disease (MELD-Na) score. It is also done to determine the cut off value of relative enhancement for non-liver impairment (NLI) and liver impairment (LI).
A total of 112 patients who had MRI liver performed using Gd-EOB-DTPA from January 2014 to December 2018 in a local university hospital were identified and included in the study. Their electronic medical records were reviewed and the following data were attained: Total bilirubin, prothrombin time (INR), serum creatinine and sodium. MELD and MELD-Na score were used to estimate total liver function. Regions of Interest (ROI) were drawn on the right and left liver lobe for plain and porto-venous phase study to get the relative liver enhancement (RLE).
There is a significant moderate negative correlation for MELD and low negative correlation for MELD-Na score with Gd-EOB-DTPA liver enhancement (r = -0.37, p < 0.001; r = -0.21, p < 0.05), respectively. From the ROC curve, the cut off value of RLE between NLI and LI is 0.5994 with a sensitivity of 71% and specificity of 65% (AUC = 0.748).
Liver enhancement in MRI can be used as a screening tool to determine residual liver function in patient with liver cirrhosis.
MELD score, MELD-Na score, Relative liver enhancement
Liver function plays an invaluable role in our clinical practice. It helps in predicting complications related to liver failure and residual liver function after partial hepatectomy for surgical per se. Scoring systems such as model for end-stage liver disease (MELD) score can be used as indicator for disease prognostication [1,2]. However, hepatocyte function does not properly reveal in liver function test.
Indocyanine Green (ICG) test which is widely used to evaluate residual hepatic functional reserve also has its own limitation due to ICG hepatic uptake is affected by blood flow within the liver, lipoprotein that binds with ICG in the blood and the hepatocellular membranous exchange of ICG [3-5].
There is an insufficiency in ICG test in predicting the regional dysfunction of the liver as well as hepatic compensation due to regional deficiency [1]. Moreover, ultrasound has its own restriction in its reproducibility [6].
Hepatocyte-specific contrast agent was largely used in assessment and diagnosis of liver tumor and staging of liver fibrosis [7]. Liver enhancement post administration of hepatocyte-specific agents is found to be more exact in quantifying the residue of hepatocyte function. It is because the accumulation of contrast differs in number of functioning hepatocytes [8-10]. The purpose of this study thence is to show the effectiveness of hepatocyte-specific contrast enhanced MRI in evaluation of liver function by means of MELD and MELD-Na score. We incorporate MELD- Na score as it is more accurate in prediction of prognosis in chronic liver disease in certain situations [11].
Ethics approval was obtained from the institution Research and Ethics Committee. As this was a retrospective cross-sectional study and therefore, informed consent was waived.
MRI liver studies in a local university hospital performed with the use of *Gd-EOB-DTPA [12] from January 2015 to December 2018 were identified from the integrated radiology information system and included in the study. However, MRI images with severe motion artefacts were excluded from the study. MRI liver studies using the Gd-EOB-BOPTA [13] were also not included and patients with no biochemical markers such as liver function test, coagulation profile and BUSE within three months from the MRI date were not eligible for this study.
A total of 112 patients were incorporated in this study after taking into consideration the inclusion and exclusion criteria. Their electronic medical records were reviewed and the following data were obtained: Total bilirubin, prothrombin time (INR), serum creatinine and sodium obtained closest to date of the MRI study.
Patients were required to be screened for any MRI contraindications. 10 ml contrast Gd-DOB-DTPA (Primovist) was given using hand injection. Parameters of T1-volumetric interpolated brain examination-fat suppression post gadolinium images (T1W-VIBE-FS post gadolinium) were described below.
The imaging parameters for axial T1-VIBE-FS images were TR/TE, 3.8/1.36 ms; field of view 350 mm; slice thickness 3 mm; gap 20% and phase-encoding direction, anterior to posterior. The MRI sequences were Axial: T1 FS, T2, T1 in and out phase, DWI, ADC; Cor: T1FS, T2. These sequences consisted of five phases, including plain, arterial, porto-venous, delayed 2 minutes and delayed 20 minutes in axial plane. The plain and delayed 20 minutes phases were taken for this study. The MRI was performed using 3T Siemen Machine (MAGNETOM Verio; SIEMENS, Germany).
*LFT included serum levels of alkaline phosphatase (ALP), albumin, total protein and total bilirubin. MELD score was used to estimate the liver function. New MELD score was calculated based on the formula: MELDinitial = 10 × (0.957 × In (serum creatinine) + 0.378 × In (total bilirubin) + 1.12 × In (prothrombin time (INR)) + 0.643. To avoid scores below zero, biochemical blood values lower than 1 were modified to 1. For MELDinitial score > 10, new MELD recalculated: New MELD = MELDinitial + 1.32* (137-Na) - [0.033*MELDinitial*(137-Na)]. Sodium values less than 125 mmol/L were set to 125, and values more than 137 mmol/L were set to 137. Patients were split into two groups with those MELD score lower or equal to 10 (normal liver function, NLF) and patient with MELD score higher than 10 (impaired liver function, ILF).
For each patient, axial pre-contrast T1-weighted images and hepatobiliary phase images were reviewed. To determine the mean signal intensity (SI), two regions of interest (ROI) were manually placed in the right liver (RL) and left liver (LL) lobes with same site in every sequence. All ROIs were placed in the most homogeneous area avoiding those regions with vessels, focal liver lesions or imaging artifacts. All the ROI must be of round or oval shape with same area of 1-1.5 cm2 for each measurement on the pre- and post-contrast enhanced images. Mean signal intensity of the ROIs [Mean = (SIRL + SILL)/2] were taken as demonstrative of the mean signal intensity of the entire liver.
Relative enhancement (RE) between the signal intensity on plain images and signal intensity post contrast images in hepatobiliary phase (HP) were calculated using the formula: RE = (SIHP - SIplain)/SIplain (Refer Figure 1). Relative enhancement was used to correlate the hepatic uptake of Gd-EOB-DTPA for patients with different liver function in term of MELD and MELD-Na scores.
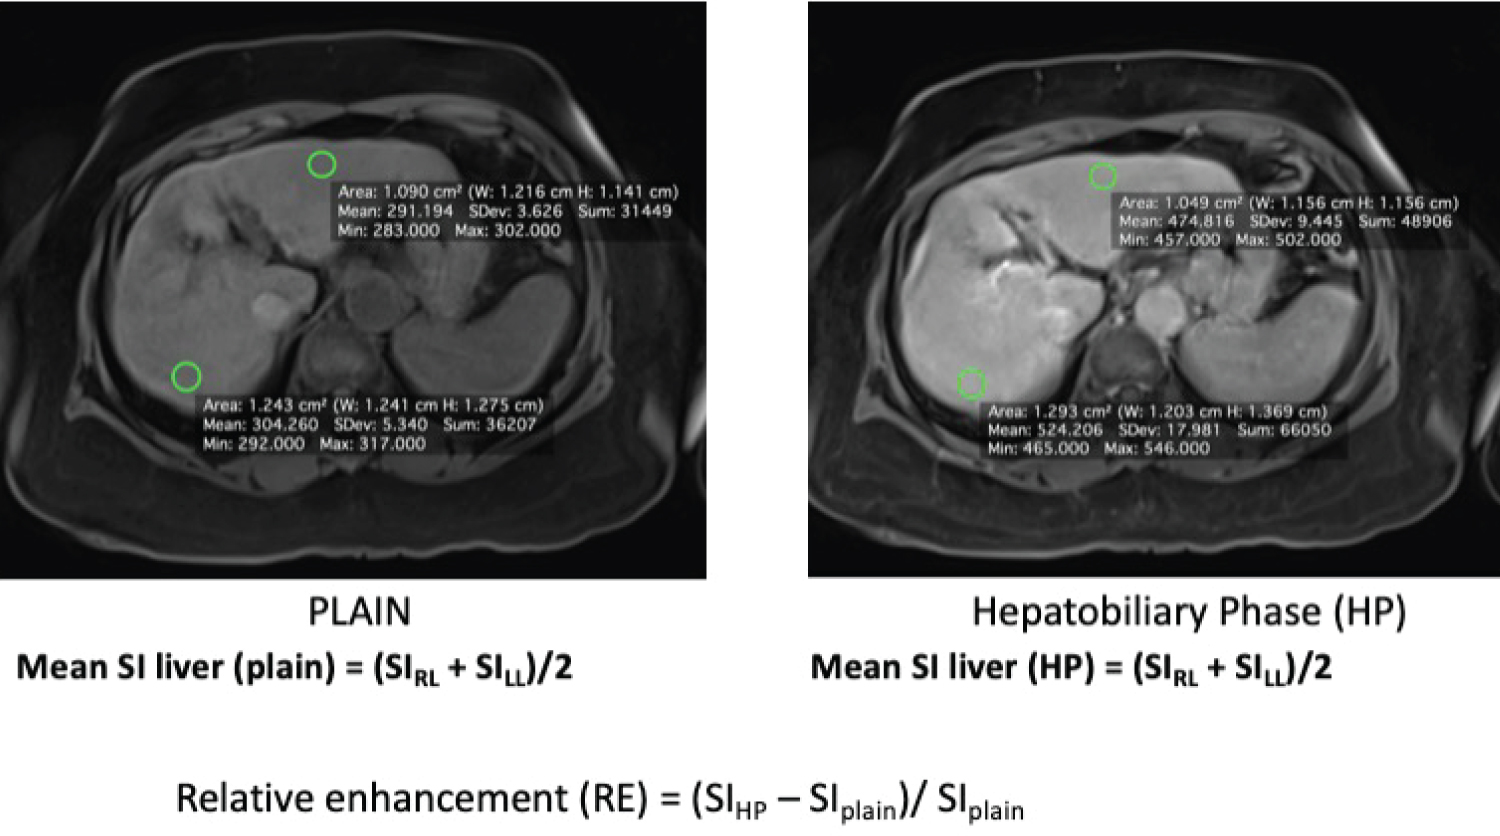 Figure 1: ROI were being drawn on both liver lobes on plain MRI (A) and hepatobiliary phase (B) and calculation of the relative enhancement (RE) based on the formula as depicted.
View Figure 1
Figure 1: ROI were being drawn on both liver lobes on plain MRI (A) and hepatobiliary phase (B) and calculation of the relative enhancement (RE) based on the formula as depicted.
View Figure 1
The statistical analysis was performed using SPSS software package IBM version 25. Anon-parametric correlation between relative liver enhancement and MELD/MELD-NA score was determined by the Spearman’s rank-order correlation and reported with its coefficient. A significant value was set at p < 0.05. The cut off value of RLE between normal liver function and impaired liver function was calculated using ROC curve.
A total of 112 patients with MRI Liver performed were included in the study. The total number of patients with MELD score of 9 or below were 69 patients, 10 to 19 were 42 patients and 20 to 29 was 1 patient. The distribution is as shown in Figure 2.
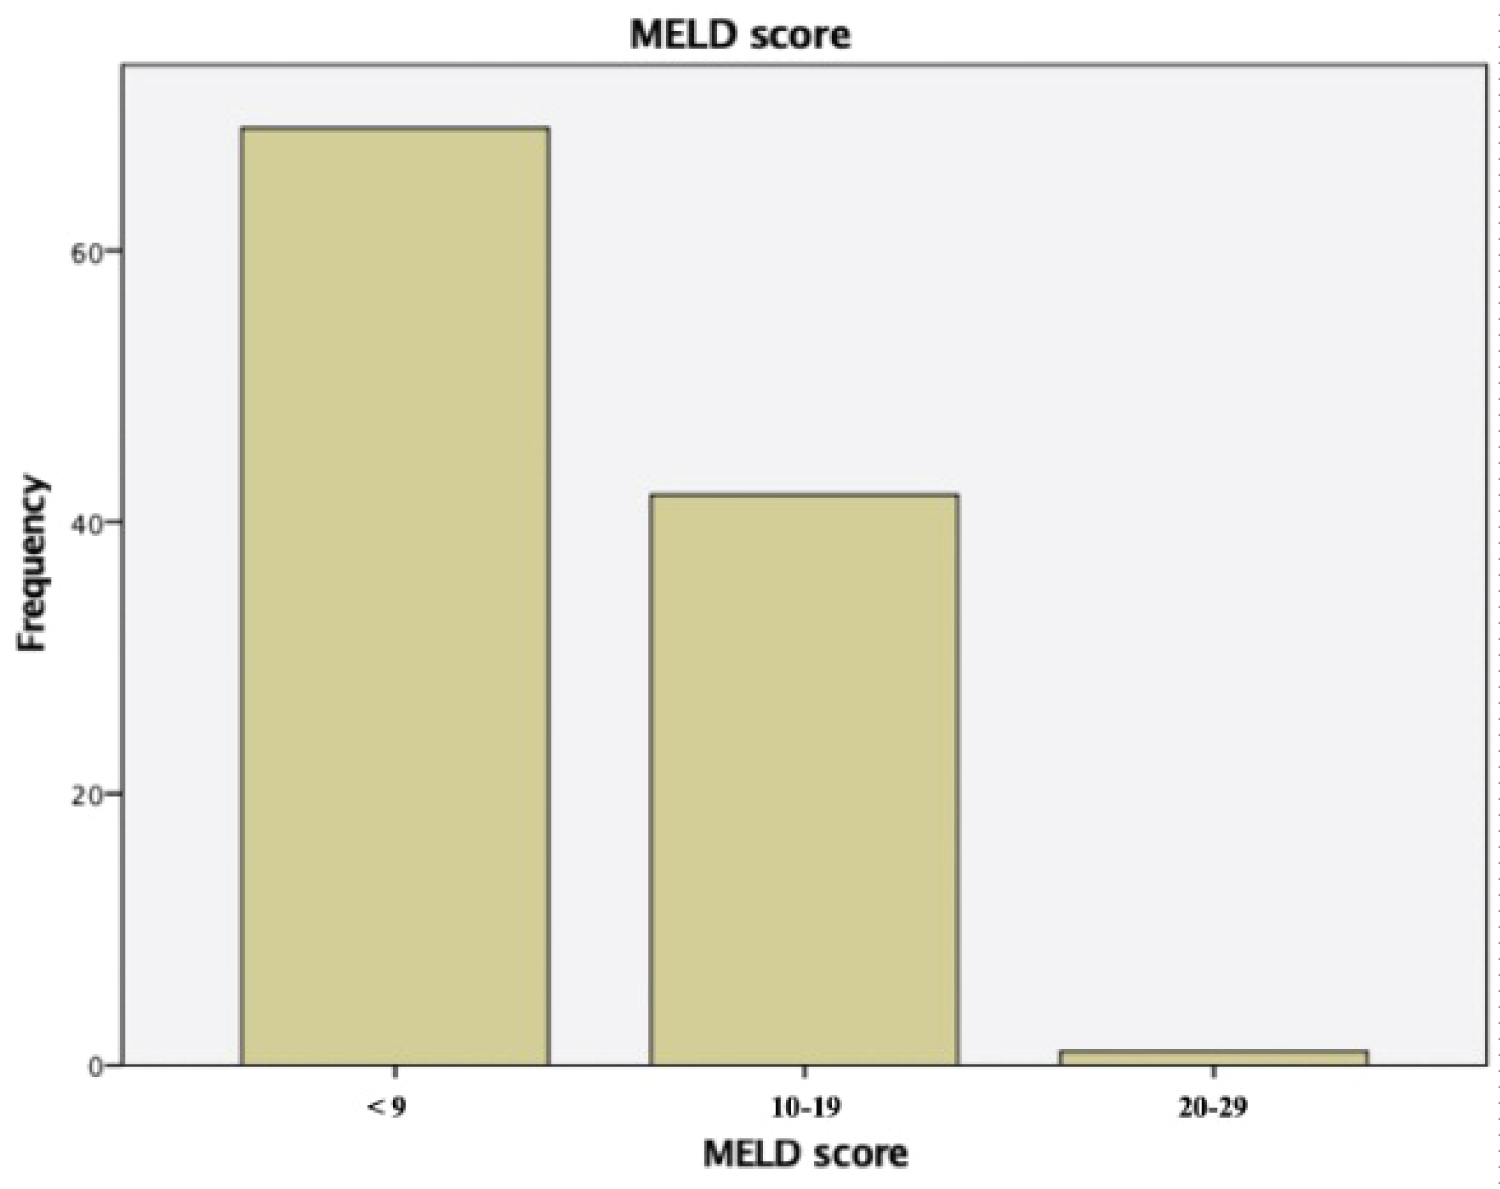 Figure 2: Bar chart showing distribution of MELD score and frequency in this study.
View Figure 2
Figure 2: Bar chart showing distribution of MELD score and frequency in this study.
View Figure 2
There was a moderate, negative correlation between MELD score and relative enhancement of liver (N = 112, r = -0.37, p = 0.001), with higher MELD score coupled with reduced relative enhancement of liver (Refer Table 1). Similarly, there was a small, negative correlation between MELD-Na score and relative enhancement of liver (r = -0.212, N = 112, p = 0.025), with higher MELD-Na score associated with reduced relative enhancement of liver. However, because the sample size of the study was more than 100 (N = 112), therefore a small correlation coefficient is associated with statistically significant relationship (Table 2).
Table 1: Means, standard deviations and correlations. View Table 1
Table 2: Means, standard deviations and correlations. View Table 2
ROC analysis was performed to determine the cut-off values with the respective AUC values to discriminate between NLF and ILF patients. The cut-off value of relative enhancement to differentiate between NLF and ILF was found to be 0.5994 (sensitivity of 71% and specificity of 65.1%), with AUC 0.748 (Figure 3).
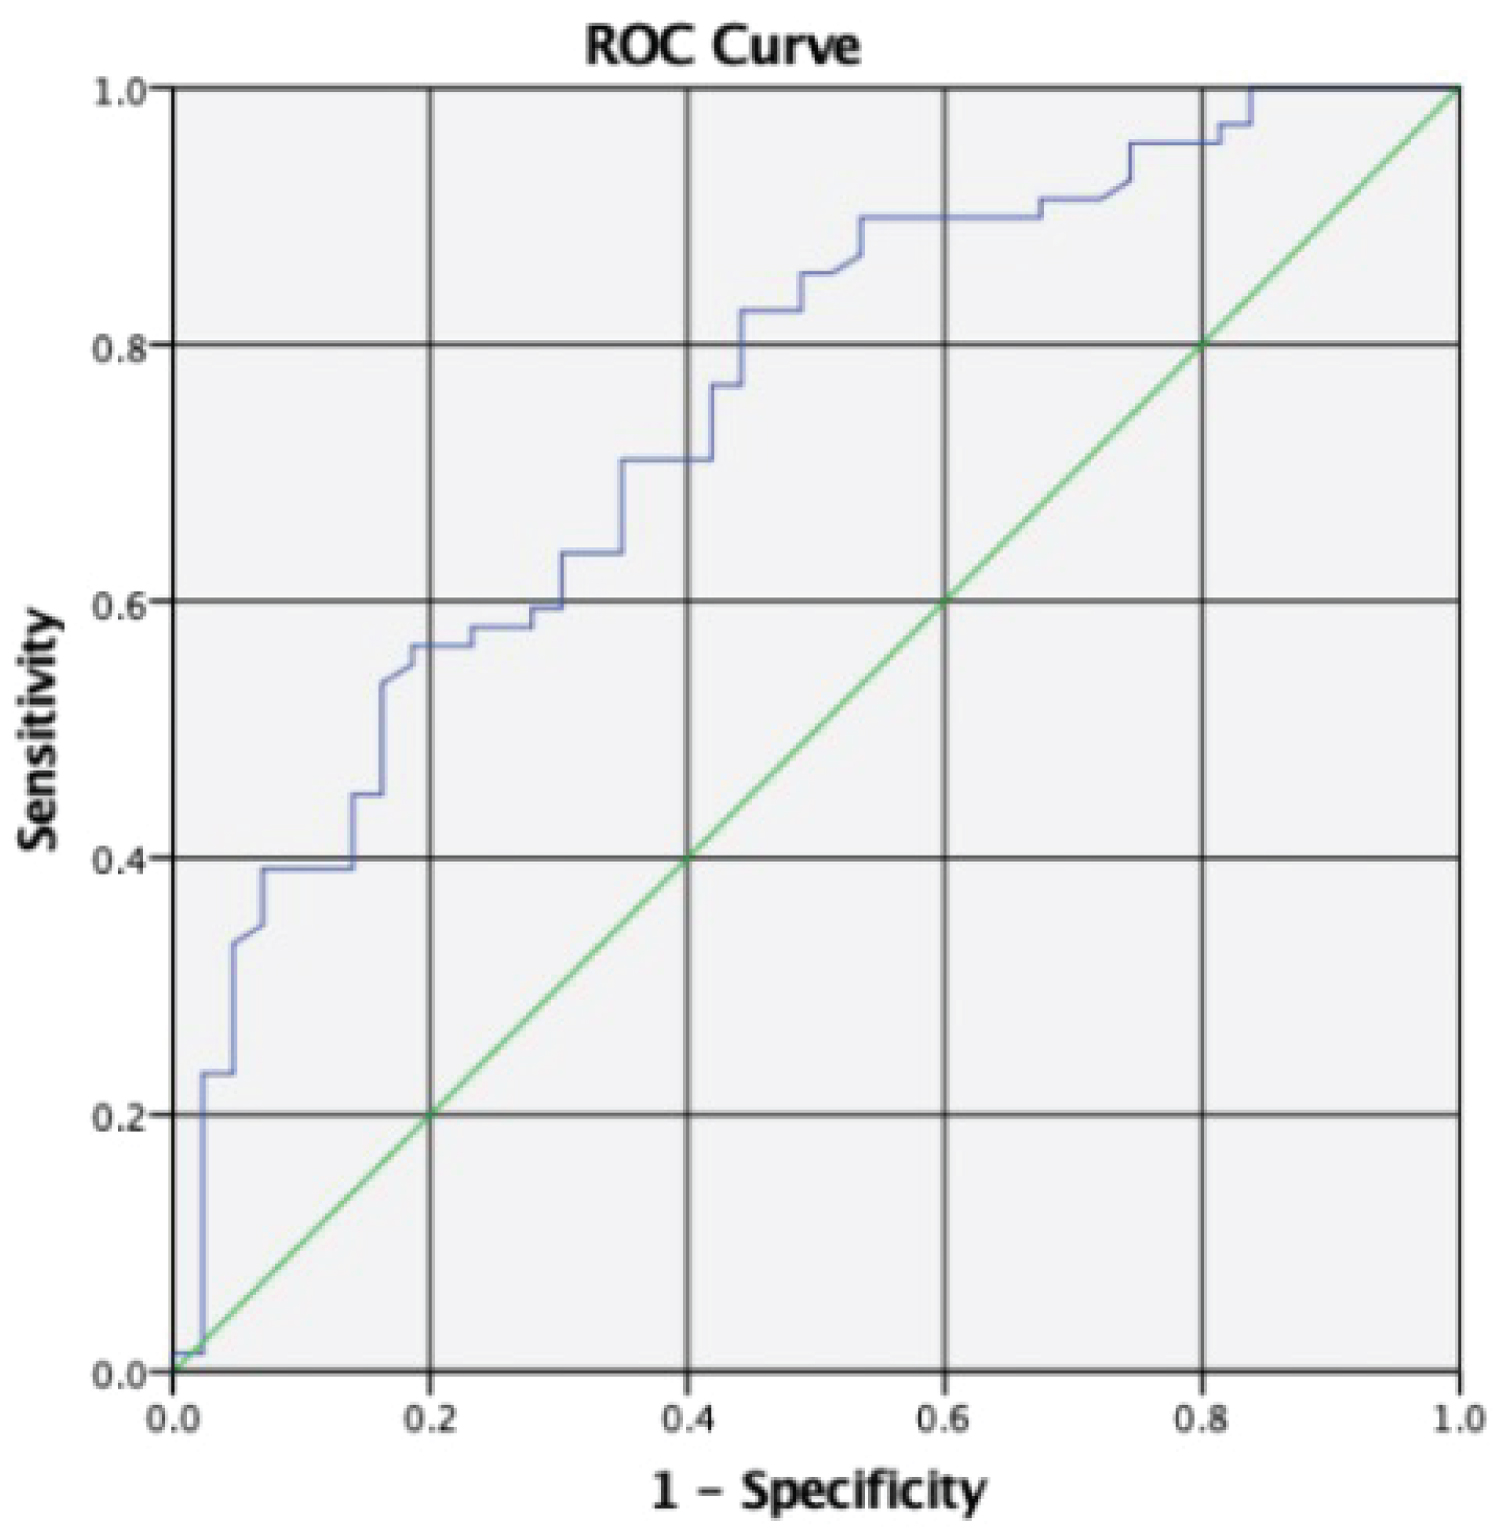 Figure 3: ROC analysis indicates various cut-off values and their level of sensitivity and specificity to differentiate patients with normal liver or impaired liver function by mean of relative liver enhancement.
View Figure 3
Figure 3: ROC analysis indicates various cut-off values and their level of sensitivity and specificity to differentiate patients with normal liver or impaired liver function by mean of relative liver enhancement.
View Figure 3
There are proven studies showing hepatic uptake of Gd-EOB-DTPA is influenced by residual liver function [1-5]. Therefore, the residual liver function can be deduced from the hepatic uptake of Gd-EOB-DTPA during the hepatobiliary phase of MRI Liver [1]. iCG test still remains gold standard in assessing residual function of the liver. There are few studies which were conducted to show correlation between ICG test and contrast-enhanced MRI liver.
There has been study conducted to prove relationship between relative liver enhancement and MELD score [1], however to date there is still no study done to prove any relationship between MELD-Na score and liver enhancement. MELD-Na score was proposed by Organ Procurement and Transplantation Network for current use as it includes sodium in calculation for better estimation of mortality rate in cirrhotic patients. MELD-Na score can increase the predictive value of the mortality in the patient with liver disease, especially in patients with ascites [14]. As such, both MELD score and serum sodium concentration are both vital in predicting the mortality and morbidity rate among patients included in liver transplant program [15].
We found that there is significant correlation between MELD score with relative liver enhancement with correlation coefficient of -0.37 and p < 0.05. Similar statistically significant result also seen in MELD-Na score with relative liver enhancement, correlation coefficient of -0.212. Though both results show moderate and small correlation coefficient, but in view of big sample size was used (N > 100), therefore the results actually show a statistically significant relationship between relative liver enhancement and MELD/MELD-Na score. This study was further established by Dahlqvist Leinhard O, et al. and Tamada T, et al. which showed hepatic enhancement is influenced by impaired hepatobiliary function and severity of cirrhosis respectively [7,10].
Due to the fact that relative enhancement of liver has negative correlation with MELD scores, as liver dysfunction may lead to reduced hepatic uptake of the Gd-EOB-DTPA [16], a cut off value between normal and impaired liver can be determined. Whereby, our current study concluded that a cut off value of 0.5994 (relative enhancement) with a sensitivity of 71% and specificity of 65.1% with AUC 0.748. The low sensitivity and specificity of this value thus constraint the usability of relative enhancement alone to determine liver dysfunction. Histology or ICG test are still the gold standards to assess liver dysfunction.
This study is being limited by its retrospective nature. MELD/MELD-Na scores were determined by the biochemical markers which were collected in a single reading within 3 months from the date of MRI. Therefore, the biochemical markers might not be representative of the liver function of the patients on the same day of MRI being done. Our data for MELD scores mainly contributed by those scores of 29 and below with limited data available from those MELD scores of 30 and above. We think this might have contributed to our low sensitivity and specificity of the cut off value for relative liver enhancement. Furthermore, ICG test is not available in our country to validate our study, which in an ideal situation we should have more than one method to validate the usage of MRI liver enhancement to determine liver dysfunction.
In conclusion, within the limitation of the study, the residual function of the liver can be deduced by calculating the relative liver Gd-EOB-DTPA enhancement which has significant negative correlation with MELD/MELD-Na score. There will be reduction of Gd-EOB-DTPA uptake in liver impairment, therefore helps us to differentiate between normal liver and diseased liver. However, in order to improve the sensitivity and specificity of the study, a study between the gold standard ICG testing with relative enhancement liver in Gd-EOB-DTPA study is highly recommended.