Multiple Sclerosis (MS) is defined as a chronic, inflammatory demyelinating disease of the central nervous system. It has a multifactorial origin and it is characterized by disabling inflammatory attacks in the central nervous system. It affects any functional system (visual, motor, sensory, coordination, language and sphincter control) and it is considered as more disabling not traumatic disease of young population in the world.
Describe brain anatomic changes in a group of MS patients through post-processing image techniques and correlate it with clinic abnormalities.
Thirty patients with relapsing-remitting form of MS and thirty healthy subjects were recruited, they were paired in age and sex. T1 and T2 weighted, FLAIR and DTI 3T MRI scans were acquired. Tractography, Voxel Based Morphometry (VBM) and cortical thickness processing analysis were done.
In relation of MS patients, tractography revealed that corticospinal tract and optic radiation number of fibres were lower than healthy subjects (p = 0.02), (p = 0.00). The number of fibres of evaluated tracts does not diminish significantly when disease duration increasing (p = 0.66), (p = 0.07), (p = 0.32). VBM revealed brain atrophy on subcortical areas of frontal and parietal lobes, occipital lobe, periventricular areas, brainstem, pulvinar thalamus and hippocampus; external capsule, extreme capsule, optic radiation, caudal fibres, arcuate fasciculus, fornix, frontal inferior gyrus, corona radiata, subcortical areas of parieto-temporo-occipital lobes, corpus callosum head, white matter of pons and medulla oblongata and cingulate gyrus of MS patients. Cortical thickness analysis did not show significantly differences between MS and healthy subjects (p = 0.26). However, it diminished when disease duration increased (p = 0.03).
In our MS patient’s series was demonstrated morphologic abnormalities of grey and white mater, principally of subcortical and brainstem structures. These abnormalities increase when some clinical aspects get worse.
Multiple sclerosis, MS, Tractography, Voxel based morphometry, Cortical thickness
According to the International Classification of Diseases eleven edition (ICD11), Multiple Sclerosis (MS, code: 8A40) is defined as a chronic, inflammatory demyelinating disease of the central nervous system [1]. It has a multifactorial origin and it is characterized by disabling inflammatory attacks in the central nervous system [2]. Three categories of multiple sclerosis have been outlined: Relapsing-remitting, secondary progressive and primary progressive multiple sclerosis [1].
It affects any functional system (visual, motor, sensory, coordination, language and sphincter control). It is considered as more disabling not traumatic disease of young population in the world. In recent years there have been a general increase of the disease worldwide [2].
On 2016, prevalence had been reported as 2221 thousands, death 19 thousand and disability adjusted life years (DALYs) 1151 thousands, with male/female ratio of 0.48, worldwide [3].
Mean prevalence in Latin America have been reported as 10.1 cases per 100.000 inhabitants; with range of 0.9 to 77.7 On 2017, in Costa Rica the MS incidence reported was of 8.3 per million [2].
Diagnosis is based on McDonald criteria and it is supported by clinic aspects, MRI and cerebrospinal fluid analysis [4].
Conventional T2-weighted images are highly sensitive in depicting focal demyelinating lesions but lack histopathologic specificity, such as inflammation, oedema, gliosis, and axonal loss, which are all represented as areas of high signal intensity. Because of this lack of specificity, T2-weighted imaging does not provide information that can be reliably associated with the pathologic substrate and clinical status of the patient [5].
In MS research, new post-processing MRI techniques have demonstrated a high degree of specificity and sensitivity in detecting pathological tissue damage. These techniques include diffusion-weighted imaging (DWI), which plays an important role in highlighting brain microstructural damage not visible when conventional sequences are used [6].
An important clinical application for DWI in demyelinating disease is in establishing a differential diagnosis with other pathologies. In some circumstances, tumefactive inflammatory lesions may mimic a cerebral neoplasm, infectious abscess, or vascular ischemia. And in some specific and rare situations, restricted diffusion can be the first marker for a demyelinating lesion, preceding contrast enhancement and associated with subtle T2-weighted image alterations, in the course of disease [5].
Diffusion tensor imaging (DTI) is a powerful non-invasive technique that can be used to investigate white mater (WM) microstructures. When applied to the brain, this technique has the potential to map the WM integrity and the structural connectivity in vivo . In recent years, DTI has been increasingly applied to the brain WM studies in MS [7].
For another hand, other post-processing techniques as voxel based morphometry (VBM), cortical thickness, volumetric analysis, and others have showed interesting changes in brain structures of MS patients [6].
With this research we purpose describe structural changes that characterize brain in a group of MS patients, through post-processing MRI studies.
A total of 30 consecutive relapsing-remitting MS patients were recruited, according to modified McDonald criteria [7]. The control group consisted of 30 healthy subjects.
The study protocol was approved by Ethical Committee of Cuban Neuroscience Centre and all of patients and healthy subjects were agree with the evaluation and signed informed consent. All procedures of the study were in accordance with the ethical standards of the institution and with the 1964 Helsinki declaration.
• Meet the modified McDonald criteria for MS [7].
• Relapsing-remitting form.
• Age upper 20-years-old.
• Both sexes.
• Any race.
• No evidence of other neurologic disease.
• Any disease duration.
• No antecedent of disease.
• Age similar to MS group.
• Both sexes.
• Any race.
• Patients with contraindication for MRI.
• Patients that deny participating on the research.
MRI was carried out using a 3T Allegra system scanner (Siemens) device with a standard quadrature head coil.
High-resolution three-dimensional whole-brain T1-weighted MRI scans were acquired using a volumetric three-dimensional spoiled fast gradient echo with the following parameters: repetition time (TR ) = 2000 ms, echo time (TE) = 2.6 ms, inversion time (TI) = 900ms, slice thickness = 1.0 mm; flip angle = 9 Ê, field of view (FOV) = 230 × 230 mm, 1 × 1 × 1 mm 3 voxel size. The volume consisted of 192 contiguous coronal sections covering the entire brain, acquisition matrix: 256 × 256, slice thickness: 1.
T2-weighted MRI scans were acquired with TR = 3500 ms, TE = 354 ms.
FLAIR MRI scans were acquired with TR = 5000 ms, TE = 353 ms, TI = 1800 ms.
DWI data were acquired using a diffusion weighted spin echo imaging sequence with the following parameters: 80 volumes, slice thickness 2.0 mm, representing 80 gradient directions, FOV = 230 mm, TR = 86 ms, TE = 8000 ms, slice thickness = 2.0 mm; flip angle = 90, b = 1000 s/mm 2 and two scan with gradient 0 (b = 0), resolution was 1 × 1 × 1.
DICOM to nifty image format was convert with dcm2nii tool, Chris Rorden's dcm2nii: 4AUGUST2014 32bit ( https://www.nitrc.org/projects/dcm2nii/ ).
DTI processing: DTI images were processed using DSI Studio software tool ( https://dsi-studio.labsolver.org/ ).
Images were reoriented into oblique axial, slices were aligned parallel to the anterior-posterior commissural axis with the origin set to the anterior commissure, Eddy currents distortions were corrected, diffusion tensor was estimated, scalar maps were constructed, fibre tracking was done, tensor were visualized and tractography based analysis (automatic) was done.
Based on Montreal neurologic Institute (MNI) maps, ROIs was placed at left (cortico spinal tract, arcuate fascicle and optic radiation) with a volume size of 2.7e+04 mm cubic. An ROI was placed at right (cortico spinal tract, arcuate fascicle and optic radiation) with a volume size of 2.9e+04 mm cubic. A seeding region was placed at whole brain. The anisotropy threshold was randomly selected. The change threshold was 20%. The angular threshold was randomly selected from 15 degrees to 90 degrees. The step size was randomly selected from 0.5 voxel to 1.5 voxels. Tracks with length shorter than 26.9531 or longer than 269.531 mm were discarded. A total of 50000 seeds were placed.
Once tracts were constructed, the following quantitative metrics were calculated automatically:
Number of tracts (called too number of fibres or count of fibres): It is the number of streamlines generated by the algorithm (n).
Tract length or mean longitude: It was calculated by multiplying number of coordinates in the streamlines with the distance between the coordinates. It was calculated trough the following equation:
n is the total number of tracks, vi(t) is a sequence of 3D coordinates representing the trajectory of a track, t is a discrete variable from 1 to mi, where mi is the number of the coordinates.
Tracts volume (in mm cubic): It was calculated by multiplying number of voxels passed by all streamlines with the voxel size (N × voxel volume),
N is the total number.
Diameter (in mm): It was calculated trough the following equation:
Total surf a ce area = N s × voxe l spacing 2 , N s is number of surface voxels.
Irregularity: Is conceptually similar to convexity and concavity. It is the opposite of compactness or roundness defined in computer vision. It was calculated trough the following equation:
Fractional Anisotropy (FA): It is a scalar measure of the preferential axis of diffusion motion. It is related to the integrity of the myelin, the density and the parallelism of the fibres, it has a value ranged from 0 (isotropic) to 1 (totally anisotropic).
Mean Diffusivity (MD): It is the average displacement of water within a voxel in the main axes.
Axial Diffusivity (AD): It quantifies how fast water diffuses along the axonal fibres. It is low on axonal damage.
Radial Diffusivity (RD): It evaluates the perpendicular component of water diffusion to axons [8].
VBM was a fully automated, whole-brain technique that enables measurement of regional brain volumes based on voxel-wise comparison of grey and white matter volumes using Statistical Parametric Mapping (SPM8,Welcome Department of Imaging Neuroscience, London, United Kingdom) software, running on Matlab 2017a and the DARTEL registration method. Briefly, the process was as follows: T1-weighted images were segmented by using VBM8 toolbox of SPM, the images were imported in DARTEL, rigidly aligned, and segmented into grey and white matter, the grey and white matter segments were co-registered simultaneously by using the fast diffeomorphic image registration algorithm and the flow fields were created, the flow fields were then applied to the rigidly aligned segments to warp them to the common DARTEL space and then were modulated by using the Jacobian determinants, the modulated images from DARTEL were normalized to the MNI template by using an affine transformation estimated from the DARTEL grey matter template and the a priori grey matter probability map without resampling, before the statistical computations, the images were smoothed with an 10-mm FWHM Gaussian filter.
Grey and white matter of MS patients and healthy subjects were compared using t-test statistical analysis, with p < 0.05.
Computational Anatomy Toolbox (CAT), version CAT12.6-rc1 (1430) was used for cortical thickness processing, it runs within SPM12. This software tools are freely available at http://dbm.neuro.uni-jena.de/cat/ .
For pre-processing: T1 images were normalized to a template space and segmented into grey matter (GM), white matter (WM) and cerebrospinal fluid (CSF), after the pre-processing is finished, a quality check was done, after that image data were smoothed and finally the GM images were entering into a statistical model.
Processing: CAT uses a fully automated method that allows the measurement of cortical thickness and reconstruction of the central surface in one step. It uses a tissue segmentation to estimate the white matter (WM) distance and then projects the local maxima (which is equal to the cortical thickness) onto other grey matter voxels using a neighbouring relationship described by the WMdistance. This projection-based thickness (PBT method) allows the handling of partial volume information, sulcal blurring, and sulcal asymmetries without explicit sulcus reconstruction [9,10].
Descriptive statistical measures were applied.
Between groups mean comparison (t-test) was done to compare mean parameters of tractography of MS and healthy subjects.
Regression analysis was done in order to evaluate the relation of number of fibres of all of analysed tracts and cortical thickness value with disease duration.
By group automated analysis (based on t-test) was done for VBM and cortical thickness, maps of signification were construed.
We applied a statistical threshold of p < 0.05 in all statistical analysis.
Clinics aspects of all of participants are described in Table 1.
Table 1: Clinic characteristics of MS patients and healthy subjects. View Table 1
Table 2 shows more frequent sites of localization of hyperintense lesions on T2 weight and FLAIR images in our MS cases series.
Table 2: Localization of hyperintense image on T2 weight and FLAIR MRI in MS group of patients. View Table 2
Tractography revealed that corticospinal tract and optic radiation volume of MS patients is lower than healthy subjects (See Figure 1).
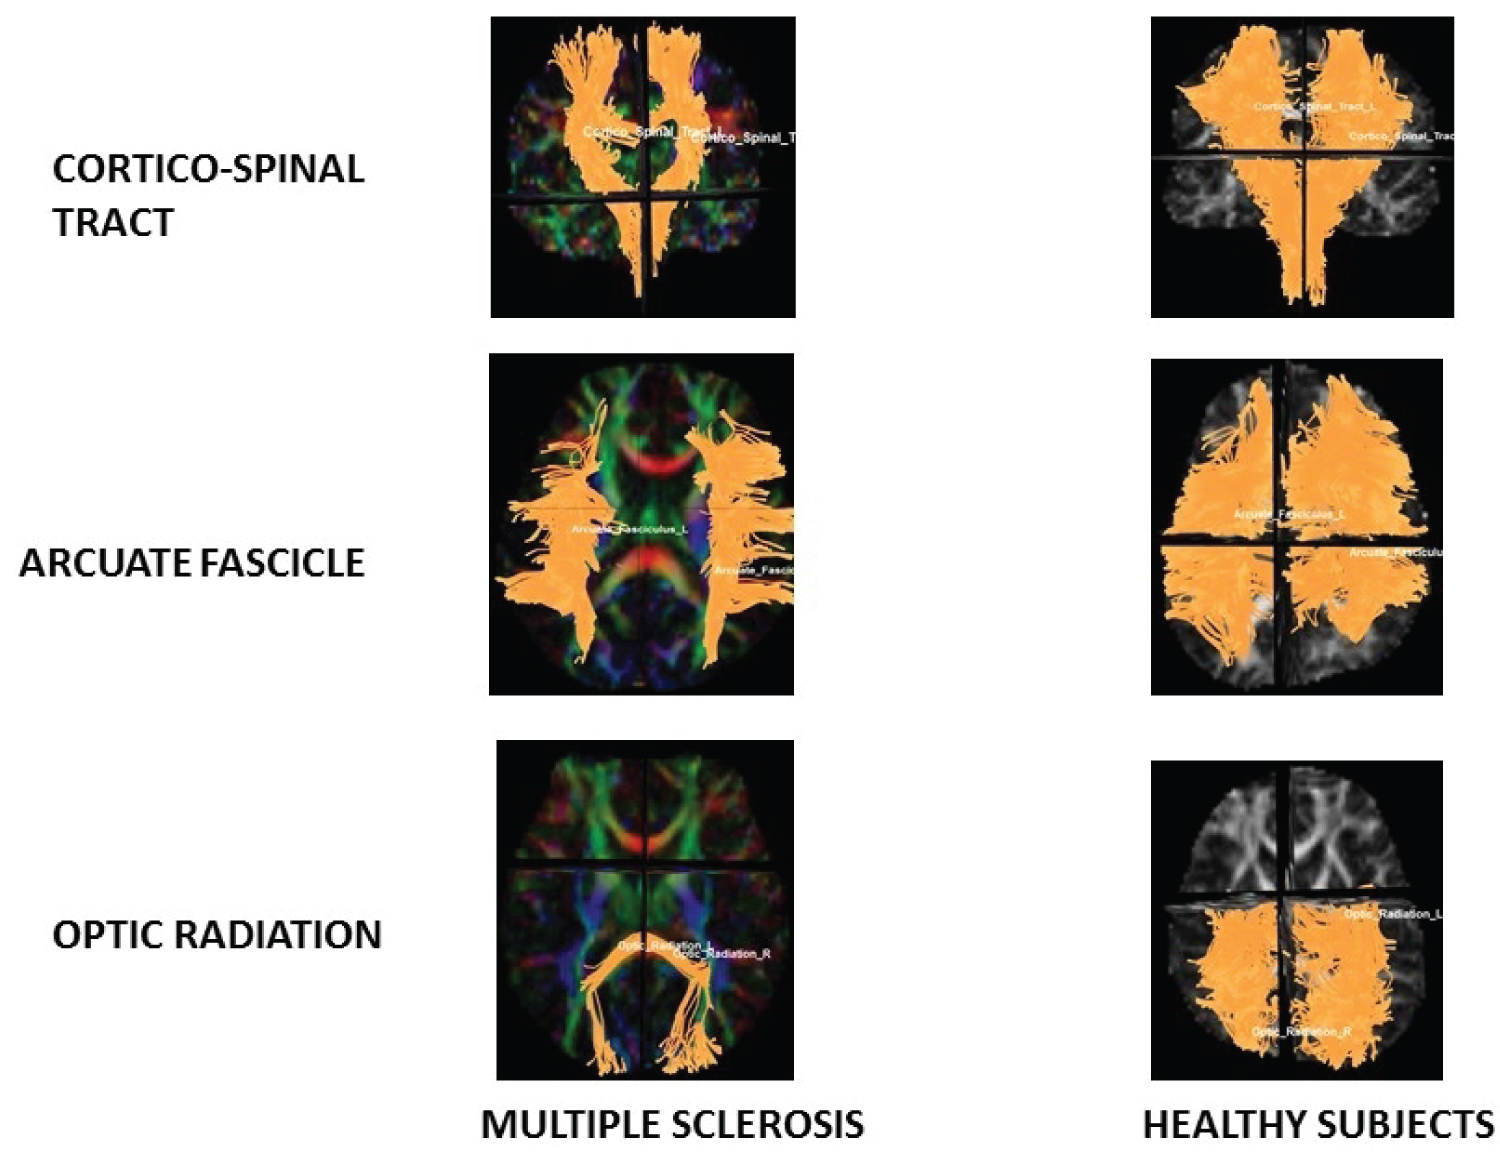 Figure 1: Tractography.
Note diminishes of fibres on CST and OR in MS patients in relation with Healthy subjects.
View Figure 1
Comparison of tractography parameters between groups (MS patients and healthy subjects):
Corticospinal Tract (CST) statistical analysis: It showed diminish of mean number of tracts (p = 0.02), diameter (p = 0.01), volume (p = 0.02) and area (p = 0.02) of MS patients in relation with healthy subjects (See Table 3).
Table 3: Mean comparison of CST parameters between healthy subjects and MS patients. View Table 3
Arcuate Fascicle (AF) statistical analysis: It showed diminish of area (p = 0.04) of MS patients in relation with healthy subjects (See Table 3).
Optic Radiation (OR) statistical analysis: It showed diminish of mean number of tracts (p = 0.00) area (p = 0.00), volume (p = 0.01), diameter (p = 0.03) and irregularity (p = 0.03) of MS patients in relation with healthy subjects. And it also showed increase of MD (p = 0.02) and AD (p = 0.03) of MS patients in relation with healthy subjects (See Table 4).
Table 4: Mean comparison of arcuate fascicle parameters between healthy subjects and MS patients. View Table 4
Regression analysis
Analysis of number of tracts in relation with disease duration: It showed that any parameters of tractography were significant in relation with the increase of the disease duration.
Patterns of brain atrophy in grey matter: We observed reduced grey matter density in MS patients in relation with healthy subjects on subcortical areas of frontal and parietal lobes, occipital lobe, periventricular areas, brainstem, pulvinar thalamus and hippocampus (Figure 2); p < 0.05 was considered statistically significant.
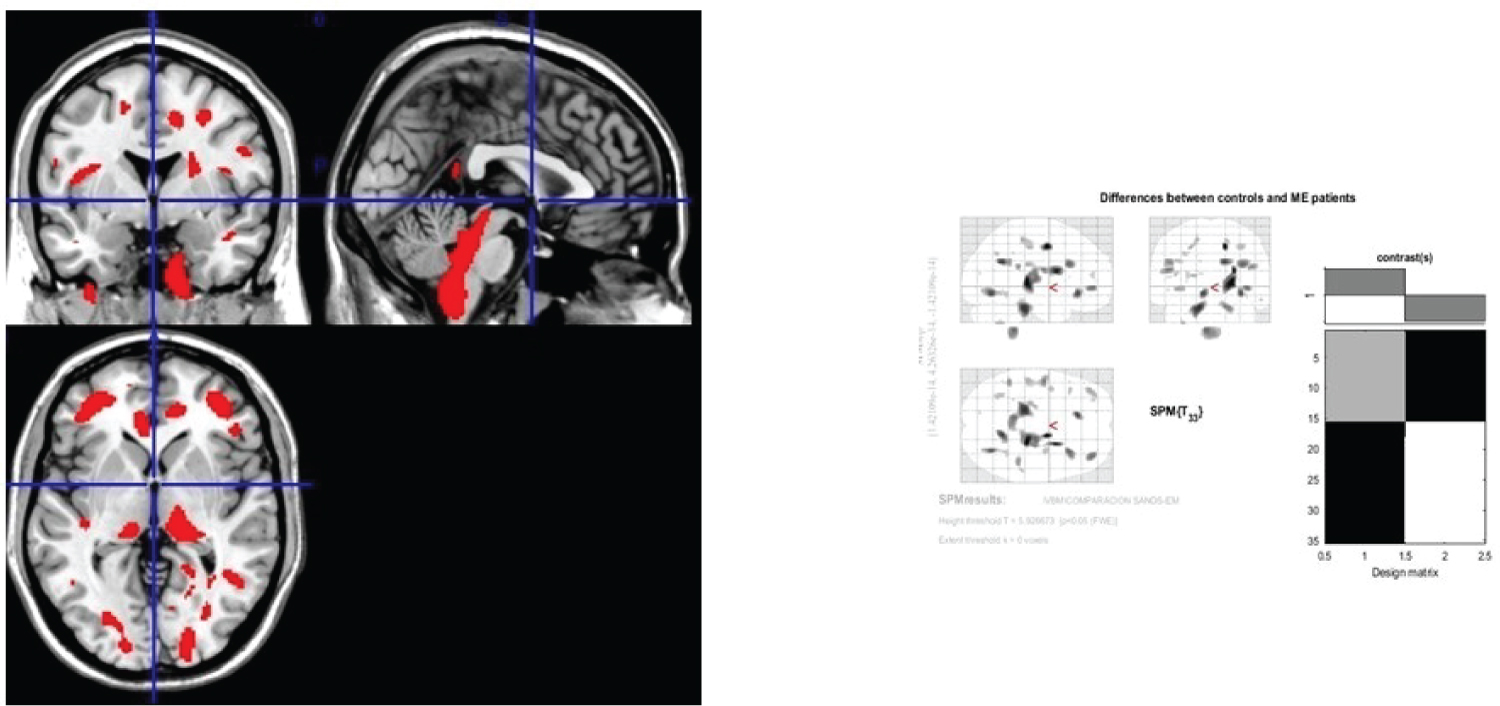 Figure 2: Generic MRI brain slices with superimposed areas showing statistically significant regions of grey matter atrophy (p < 0.05, corrected for multiple comparisons) in a group of 30 MS patients compared with 30 healthy age matched subjects using voxel-based morphometry.
It shows grey matter atrophy on subcortical areas of frontal and parietal lobes, occipital lobe, periventricular areas, brainstem, pulvinar thalamus and hypocamppus. The coloured bar represents the T score.
View Figure 2
Patterns of brain atrophy in white matter
We observed reduced white matter density in MS patients in relation with healthy subjects on external capsule, extreme capsule, optic radiation, caudal fibres, arcuate fasciculus, fornix, frontal inferior gyrus, corona radiata, subcortical areas of parieto-temporo-occipital lobes, corpus callosum head, white matter of pons and medulla oblongata, cingulate gyrus (See Figure 3); p < 0.05 was considered statistically significant.
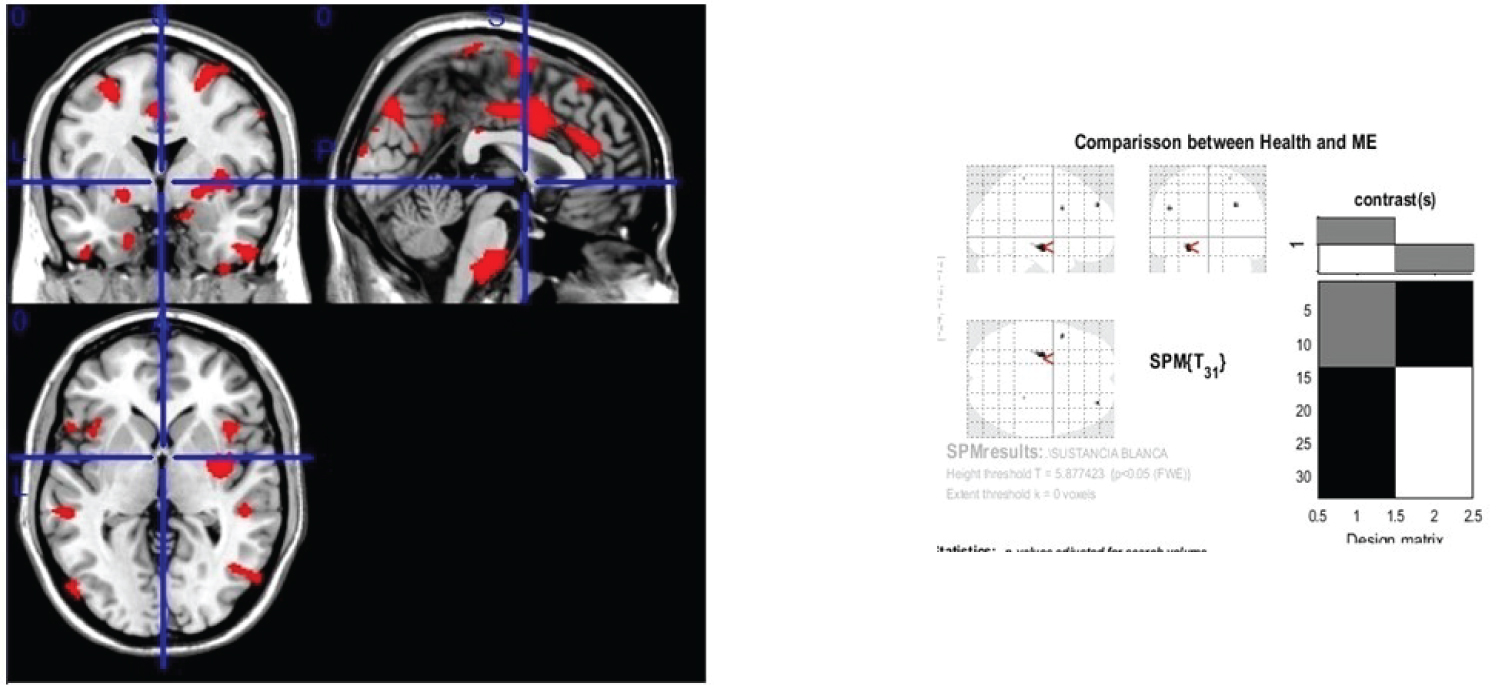 Figure 3: Generic MRI brain slices with superimposed areas showing statistically significant regions of white matter atrophy (p < 0.05, corrected for multiple comparisons) in a group of 30 MS patients compared with 30 healthy age matched subjects using voxel-based morphometry.
It shows white matter atrophy on external capsule, extreme capsule, optic radiation, caudal fibers, arcuate fasciculus, fornix, frontal interior gyrus, corona radiata, subcortical areas of parieto-temporo-occipital lobes, corpus callosum head, white matter of pons and medulla oblongata and cingulate gyrus. The coloured bar represents the T score.
View Figure 3
Comparison between groups (MS patients and healthy subjects): In relation with comparison of mean cortical thickness of MS patients and healthy subject. There were not statistic significate areas (p = 0.26) (See Figure 4).
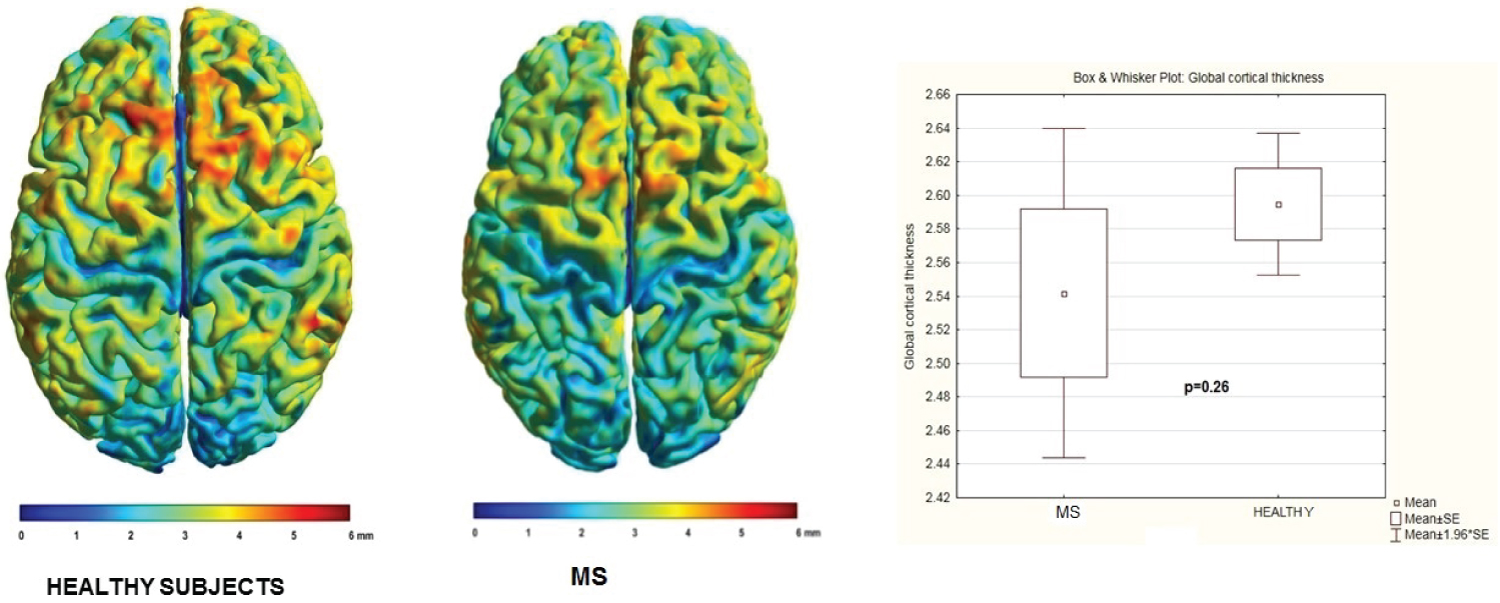 Figure 4: Comparison of individual mean cortical thickness between healthy subjects and MS patients.
Notice they are not significate differences.
View Figure 4
Group statistical analysis of cortical thickness did not show group differences between MS and healthy subjects, p < 0.05 was considered statistically significant and surface-based statistical maps not showing clusters of significant (See Figure 5).
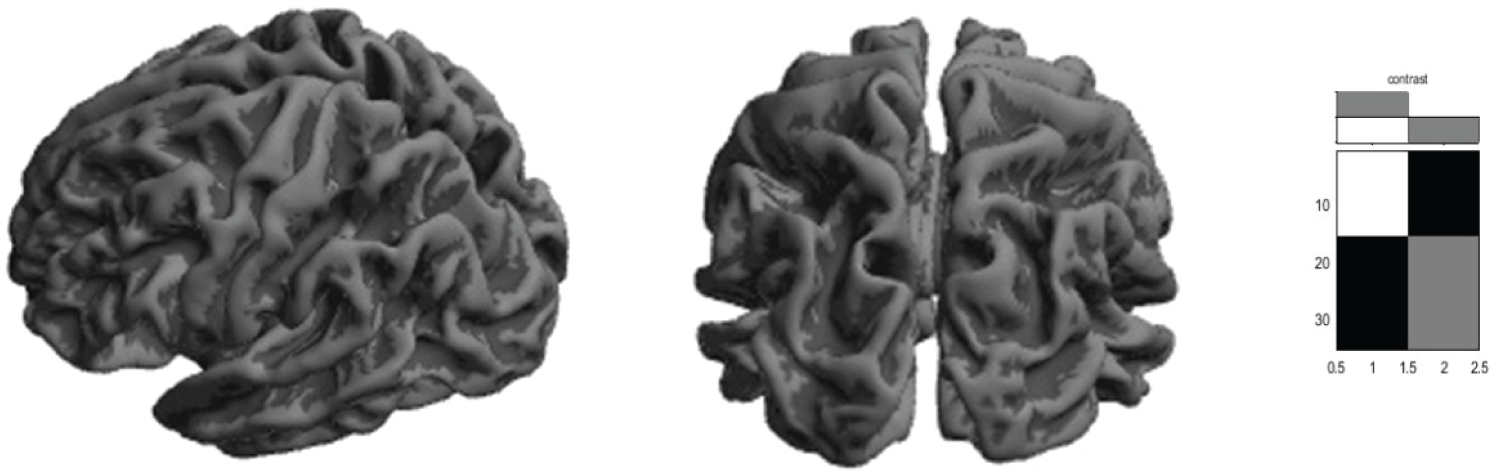 Figure 5: Cortical thickness group differences between MS and healthy subjects, p < 0.05.
Surface-based statistical maps showing that there are not significant clusters.
View Figure 5
Regression analysis: Analysis of cortical thickness in relation with disease duration.
It showed that cortical thickness diminishes when disease duration increasing (p = 0.03) (See Table 5, Table 6 and Figure 6).
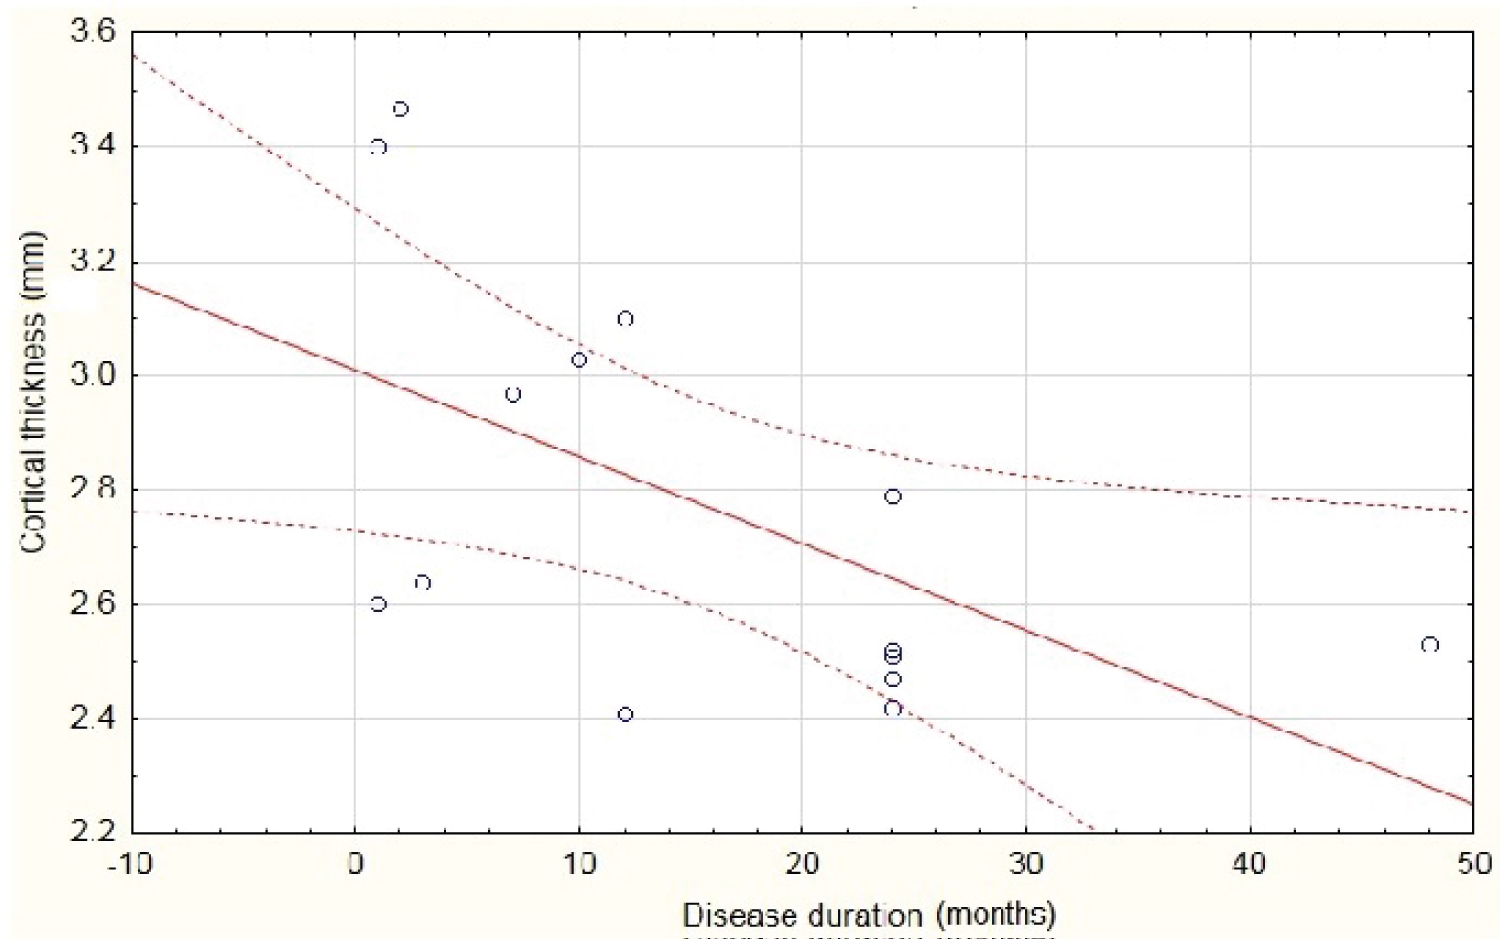 Figure 6: Scatterplot of cortical thickness against disease duration. P < 0.03.
Notice it diminishes as disease duration increase.
View Figure 6
Table 5: Mean comparison of optic radiation parameters between healthy subjects and MS patients. View Table 5
Table 6: Regression summary for dependent variable: Cortical thickness on MS patients in relation with disease duration. View Table 6
Great number of studies have reported abnormalities of brain of MS patients. Majorities of them on white matter due to MS are considered a primary demyelinating disease. However, in the last decades some researches has described abnormalities on grey matter and cortical areas in MS patients; demonstrating secondary degeneration of brain structures [11].
In relation of tractography our cases series showed that most affected tract was OR and in second order CST. It is according with abnormalities of visual system on MS patients, which could be sub-clinically.
Fox reported a progressive increase of MD with AD unchanged in a group of relapsing remitting MS patients prior to gadolinium enhancement, it provided evidence for impaired myelin integrity at the initial stage of MS [11].
Kolbe showed progressive decrease of FA trough optic radiation and near cortex, it was in relation with amplitude decreased and latency prolongation of multimodal evoked potential [12]. Lower values of FA and MD of CST were observed on MS patients in relation with healthy subject in a study carried out for El-Sourgy and col on 2015 [13].
Elshafey demonstrated decrease of FA with MD increase on corpus callosal regions, periventricular areas, frontal and occipital lobes of MS patients in relation with healthy subjects. The statistical analysis showed more significance of MD in the detection of lesions. Thus being demonstrated that DTI quantitative parameters are good predictors of brain tissue damage [14,15].
DTI parameters have been demonstrated very useful not only inside of MS lesions regions, but also around the lesions, this suggests the existence of an extension of the disease invisible in conventional MRI study [16-21].
Some authors affirm that DTI is able to measure the degree of diseased white matter more accurately than T2 weight imaging and may also detect abnormalities earlier than T2. It may represent an important indicator of neuronal structure and its loss in patients with MS [21].
In our case series, the most affected tract was OR. MD was higher in comparison with healthy subject. It is agreeing with Cheng results; it suggests that OR has an increase of diffusivity, indicating axonal damage [22]. We didn’t find significative FA abnormalities between MS patients and healthy subjects.
Gajamange, et al. published their results in relation with optic nerve and tract evaluation: Reduced fibre density and amplitude associated with reduced of FD in MS patients compared to healthy subjects, and they proposed it as a potential early marker of clinical disability in MS [23].
In relation with our findings on VBM, some authors have supported grey and white matter loss on MS patients in vivo and also in post-mortem studies. Trapp demonstrated cortical atrophy on early states of MS and this phenomenon can be detected on patients with very low brain white matter lesions. He showed in a post-mortem study that MS patients had significantly decrease of cortical neuronal density, specifically on V layer [24].
Sbardella, et al. on 2013 demonstrated in a VBM analysis done reduced GM volume in patients with respect to healthy subject in the cerebellum, thalamus, subgenual gyrus and middle cingulate cortex, superior frontal gyrus, occipital and temporal cortices bilaterally, it could be in relation with cognitive or motor disability [25].
Rothstein published cortical diminish of grey matter on forebrain parenchyma, thalamus, and hippocampal area. Same abnormalities have been showed in post-mortem studies, cortical atrophy appeared to be unrelated to the degree of myelin loss [26].
Prinster, et al. on 2010 showed significantly decreased of grey and white matter volume in a group of remitting relapsing MS group of patients, it involved preferentially the left fronto-temporal cortex and precuneus, as well as the anterior cingulate gyrus and the caudate nuclei bilaterally, and to a minor extent the right frontotemporal cortex and right parietal lobule. The VBM analysis of white matter indicated preferential areas on bilaterally periventricular regions in the temporal lobes, juxtacortical insular regions, extending posteriorly through the internal capsule to the thalami, and to the splenium of the corpus callosum.
They confirmed a direct correlation between disease severity and brain tissue loss (both grey and white matter) in the motor system, while lesion load correlated of brain tissue loss mainly affects highly interconnected subcortical structures, including the caudate nuclei and thalami [27].
VBM is an automated technique for assessing brain structural changes. It detects changes in brain morphology caused by small lesions, quantifies changes in the volume and density of brain tissue. Other VBM analysis have showed grey matter volumes were decreased in the right frontal lobe (superior frontal, middle frontal, precentral, and orbital gyri), right parietal lobe (postcentral and inferior parietal gyri), right temporal lobe (caudate nucleus), right occipital lobe (middle occipital gyrus), right insula, right parahippocampal gyrus, and left cingulate gyrus of MS patients in comparison with healthy subject [28]. Hippocampal areas are common mentioned as affected on VBM analysis for different authors and it has been frequently associated with memory deficits in MS patients [29,30].
In relation with cortical thickness we did not find any significant difference between MS patients and healthy subjects, however the findings are controversial. Some authors have showed significant mean global cortical thickness was reduced in multiple sclerosis patients compared to healthy subjects [31-37] and also local cortical thickness was reduced in some areas: Left and right frontal lobe, left and right parietal lobe, precentral, paracentral, postcentral and posterior cingulate cortices in both hemispheres, entorhinal, parahippocampal areas, pars opercularis, pars orbitalis [32-39]. Others authors have also reported diminish of cortical thickness on visual areas [37].
Sailer, et al. reported that there was a highly significant main effect of disease duration [F (2,59) = 11.51, P = 0.002] over cortical thickness, it is in accordance with our results. They observed that patients with disease duration of < 3 years did not exhibit any significant focal cortical thinning compared with normal control subjects. In patients with disease duration up to 5 years, they observed significant focal atrophy that mainly involved the left and right temporal superior gyrus and sulcus as well as the left and right frontal superior gyrus and sulcus. Patients whose disease duration was > 5 years exhibited pronounced focal atrophy beside the temporal and frontal areas, in the motor cortex of the left and right hemisphere [38,39].
Damjanovic, et al. and other authors have showed a significant reduction of all brain volumes, atrophy of cortical grey and white matter, thalamus and basal gangliain MS patients in relation with healthy subject and they have thought it would be in relation with cognitive impairment [40-43].
Some of these researches have correlationed atrophy of cortical grey matter with cognitive dysfunction in MS patients [40,43,44].
Post-mortem studies have confirmed MRI findings. They are revealed decrease of global cortical thickness, diffuse changes in myelination occurring in non-lesional, apparently normal white and grey matter at the early stages of disease and also extensive axonal damage in acute white matter lesions and normal appearing white matter in the progressive stage of MS [45,46].
Carassiti demonstrated that the total neocortical neurons were 14.9 ± 1.9 billion vs. 24.4 ± 2.4 billion in controls (mean ± SD) showing that there were 39% fewer neurons in the neocortex of MS than in controls and also he described that the non-adjusted mean proportion of demyelinated cortex in MS patients was 40 ± 13%, occipital cortex (p < 0.001) which was the most severely affected. No association was detected either between the number of cortical neurons and white matter lesion volume (p = 0.11) [45].
In the study done by Boaventure, et al. on 2022 they suggested that the pathological abnormalities affecting lesions consist of major demyelination and severe tissue destruction; in contrast, abnormalities affecting normal appearing tissue mainly consist of axonaldamage and loss and microglial activation, but do not include major demyelination [47].
Undoubtedly those morphologic aspects support physiologic abnormalities that can be observed in MS. In the initial stages of MS, many different components of the adaptive and the innate immunity induce demyelination and neuronal loss. Demyelinating focal plaques of white matter produce focal tissue loss and it is the major contributor to brain atrophy, inflammation may be an important contributor to global tissue loss in early disease stages, as the disease progresses additional mechanisms emerge: Such as microglia activation, meningeal inflammation, iron deposition, oxidative stress and diffuse axonal damage in normal appearing white matter [48,49].
Whole brain atrophy has a significant imaging association with physical disability as measured by Expanded Disability Status Scale (EDSS) score, cortical and thalamic atrophy have been the best predictor of poor cognitive functioning, even when mild impairment was detected, cortical atrophy has been relationed with other symptoms in MS: euphoria, disinhibition, aggression, major depressive disorder, autonomic dysfunction and sexual disorders. Fatigue has been reported to be associated with grey matter atrophy in frontal regions and depressed patients were found to present selective cortical thinning in the fronto-temporal regions, while the frontal thinning was found to be the best predictor for depression in MS patients [48].
The most recently connectivity studies have supports MRI and anatomo-pathologic findings in MS. They have demonstrated disrupted principal network organisation in thalamic, deep nuclei networks and it shows a higher correlation with clinical scores disability. The whole brain white matter network was characterized by reduced total strength, global efficiency and local efficiency in MS compared with healthy subject [50-52].
In our analysis different brain structures were observed affected in ME patients:
Grey matter: Subcortical areas of fronto-parieto-occipital lobes, hypocampus, periventricular areas, pulvinar, thalami and brainstem.
White matter: Optic radiation, corticospinal tract, arcuate fascicle, external and extreme capsule, fornix, white matter of frontal inferior and cingulate gyrus, corona radiate, subcortical areas of parieto-temporo-occipital lobes, corpus callosum head, white matter of pons and medulla oblongata, cingulate gyrus.
Axonal degeneration seems to be the primary abnormality of principal’s tracts, they show diminish of fibre numbers, diameter, volume, total area, increase of RD and MD. The most affected tract was optic radiation, followed by corticospinal tract.
Cortical thickness appears not affected in ME patients, at least in the first three years of diseases duration, but it diminishes with the disease duration increase.
Advanced methods of MRI provide new insight into pathophysiology of this disease and may serve as an additional prospective marker of disease progression.
In our MS patient’s series was demonstrated morphologic abnormalities of grey and white mater of subcortical structures and brainstem.
The authors report no conflicts of interest.
The author reports there are no competing interests to declare.