The perfusion system provides simulated systolic and diastolic waves to the hepatic artery HA and continuous pressure to the portal vein PV.
Ten porcine livers were perfused at 15 °C and 30 °C over consecutive two-hour periods. HA, PV and HV flow rates and liver temperature were continuously measured.
The cardio-emulated systolic and diastolic pressure waves in the HA were transmitted across the sinusoidal walls to the PV.
The flow at 15 °C in the HA, 630.1 ± 239.9 ml/min; M ± SD was significantly greater than that in the PV, 316.2 ± 90; p < 0.004. Flow in the HV, 904 ± 292.8 equaled the sum of the HA and PV flows. Increasing the temperature of the perfusate to 30 °C acutely increased flow in HA, 761.5 ± 220; p < 0.014 and HV, 1016.1 ± 302.4; p < 0.007, but not PV 367 ± 39 ml/min; p < 0.09.
The gradual increase in HA flow during temperature equilibration to 15 °C was associated with an inverse flow reduction in PV, indicating an intact Hepatic artery buffer response.
Substitution of Histidine-Tryptophan-Ketoglutarate for PBS was associated with significantly reduced flows in PV implying possible venoconstriction.
On reducing the temperature back from 30 °C to 15 °C, flows returned to baseline implying a reversible response to temperature.
In summary, physiological control of flow in response to temperature change is maintained in this ex vivo perfused liver.
HA: Hepatic Artery; PV: Portal Vein; HV: Hepatic Vein; PBS: Phosphate Buffered Saline
The liver is unique in possessing a dual blood supply. It receives approximately 80 percent of flow from the portal vein and the rest from the hepatic artery. Thus, the hepatic microvasculature receives blood from two types of afferent vessels: Portal venules and hepatic arterioles.
The portal venules directly connect with the sinusoids to supply the liver parenchyma with blood rich in nutrients, but at low oxygen tension. The hepatic arterial system is not just supplementary to the portal vein. It is the primary oxygen supply to sinusoidal blood. It also supplies the bile ducts, portal venules and nerves in the portal tract [1-3].
Unlike arterioles, terminal venules are not considered to possess vascular reactive elements [4]. However, intravital and scanning electron microcopies have demonstrated potent vasoconstrictor endothelin (ET)-1 induced contractions of the sinusoidal endothelial fenestrae (SEF) via the ET_B receptors. Significant contractions of the terminal portions of the portal venules can also be induced by endothelin-1.
Endothelial nitric oxide synthase (eNOS) is present in the plasma membrane of the SEF. Regulation of NO synthesis might also contribute to the local control of hepatic sinusoidal blood flow. These data suggest that alternative mechanisms, including the juxta-sinusoidal terminal portal venules could serve to regulate hepatic sinusoidal blood flow [3,5-9].
The CaVESWave® cardio-emulation perfusion pump system provides simulated systolic and diastolic pressure waves to the hepatic artery HA, as well as variable pressure to the portal vein PV, replicating in vivo hepatic perfusion conditions. This allows an opportunity to study the interaction between HA and PV flow patterns in the autoregulation of hepatic blood flow. The model excludes artefacts generated in vivo by respiration and cardiac pulsations.
Increased body temperature is associated with increased liver blood flow. This effect, in the intact animal may be indirect, through changes in cardiac output or splanchnic blood flow [10]. However, in this ex vivo model, the effect of temperature change on blood flow in the HA, portal vein and hepatic veins can be directly investigated.
Each liver was flushed, within five minutes of procurement with a total of 4L of phosphate-buffered saline (PBS), in two stages. The outlets (the two vena-cava connectors) were closed for each flush, allowing the back pressure to achieve sufficient pressure to open and flush capillaries and sinusoids, using hydrostatic pressure at a height of 0.65 meter, or approximately 120 mmHg.
The liver was then placed on ice and transported to the laboratory, with a cold ischemia time of around 90 minutes. At the laboratory, each liver was flushed with an additional 4L of PBS, also in two stages and then connected to the CaVESWave® system (with an additional cold ischemia of 30 minutes).
For livers 1-4, perfusion was initiated (with PBS as perfusate) initially at a temperature set at 15 °C and maintained for two hours. Flow measurements and IR images were collected. After two hours of perfusion, the temperature of the perfusate was increased to 30 °C and run for another two hours.
For livers 5-7, the experiment was extended after the two-hour run at 30 °C, for an additional two hours at a temperature of 15 °C to test the reversibility of the model.
For Livers 8-10, the same 4-hour perfusion protocol was used. However, Custodiol® -HTK, Histidine-Tryptophan-Ketoglutarate solution (Essential Pharmaceuticals, Ewing, NJ) was used, in place of PBS. Custodiol-HTK is an organ preservation perfusate devoid of colloid, with a low viscosity of 1.8 cP. It is an extracellular solution consisting of histidine as buffer, tryptophan as membrane stabilizer and ketoglutarate as the energy substrate [11].
The distribution of perfusate was documented using IR thermography, which measured surface liver temperature to a depth of 3 mm. The flow rates in the hepatic artery, portal vein and hepatic vein were captured with flow sensors in the perfusion circuit of the CaVESWave® system, mathematically transformed using specifically designed software that transformed the raw data to actual flow rates by use of a computational algorithm.
Sensing data collected during perfusion consisted of pH, DO (dissolved oxygen), conductivity, pressures on all vascular channels (hepatic artery, portal vein, hepatic vein), temperature, and flow rates on all three vascular channels.
The initial flushes for livers 8-10 were performed with PBS. The actual liver temperature stabilized at approximately 17 °C for the 15 °C target and 28 °C for the 30 °C target due to heat exchange from the tubing and components to the ambient environment.
Ten livers were divided into three groups: Group A (Livers 1-4) were perfused with PBS for four hours; Group B (Livers 5-7) with PBS for six hours; and group C (Livers 8-10) perfused with custodial for four hours. We describe a representative from each group, below:
Liver 1 is representative of group A, four livers that were perfused with PBS at two temperatures. The flow rates for the three vascular channels, HA, PV and HV are illustrated below (Figure 1a). The fluctuations in flow are due to the systolic/diastolic waves, generated by the unique CaVESWave® cardio-emulation organ perfusion pump system.
Over the first two hours, the HA flow increased gradually as it equilibrated with that of the PBS perfusate at 15 °C and then stabilized thereafter, averaging 587 mL/min. There was an almost immediate increase in flow rate, when the temperature was increased to 30 °C at 7200 secs (two hours). Flow rate was maintained at a relatively stable 748 mL/min at 30 °C, an increase of approximately 27.4 percent during the two hours of perfusion (Figure 1a).
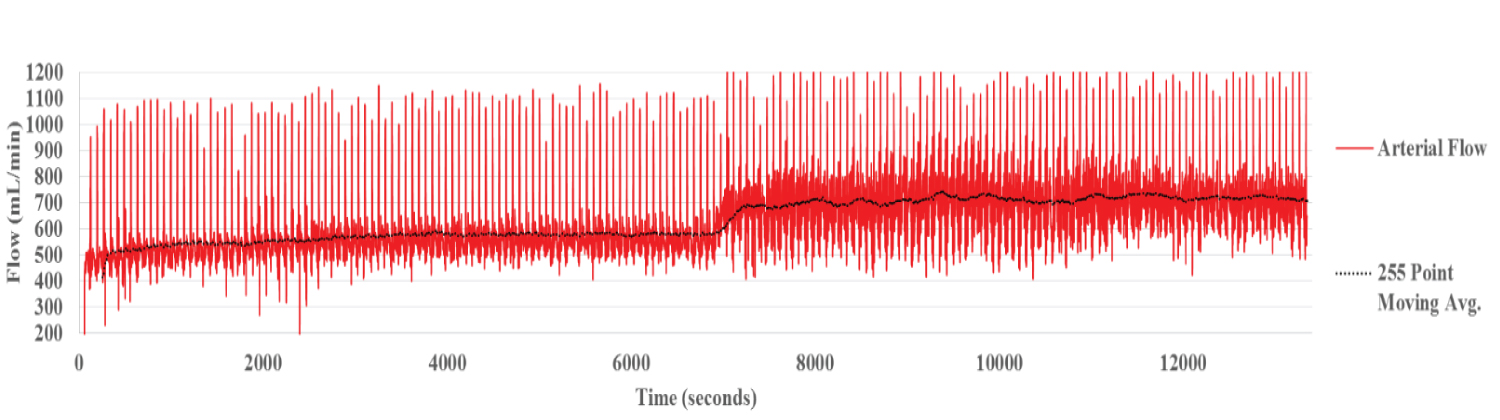 Figure 1a: Hepatic Arterial Flow Liver 1. The raw data shows the fluctuation of flow due to the pulsatile nature of the systolic/diastolic waves.
View Figure 1a
Figure 1a: Hepatic Arterial Flow Liver 1. The raw data shows the fluctuation of flow due to the pulsatile nature of the systolic/diastolic waves.
View Figure 1a
Pulsatile flow waves in the PV showed a similar, but slightly more attenuated pattern to that in the HA. The source of the pulsation appears to be direct transmission from the HA across the sinusoids.
Flow rate in the PV was stably maintained during perfusion at 15 °C at 367 mL/min (Figure 1b). On raising the temperature of the perfusate to 30 °C, a slight increase in flow rate to 396 mL/min was noted. This increase was maintained over the two hours of perfusion.
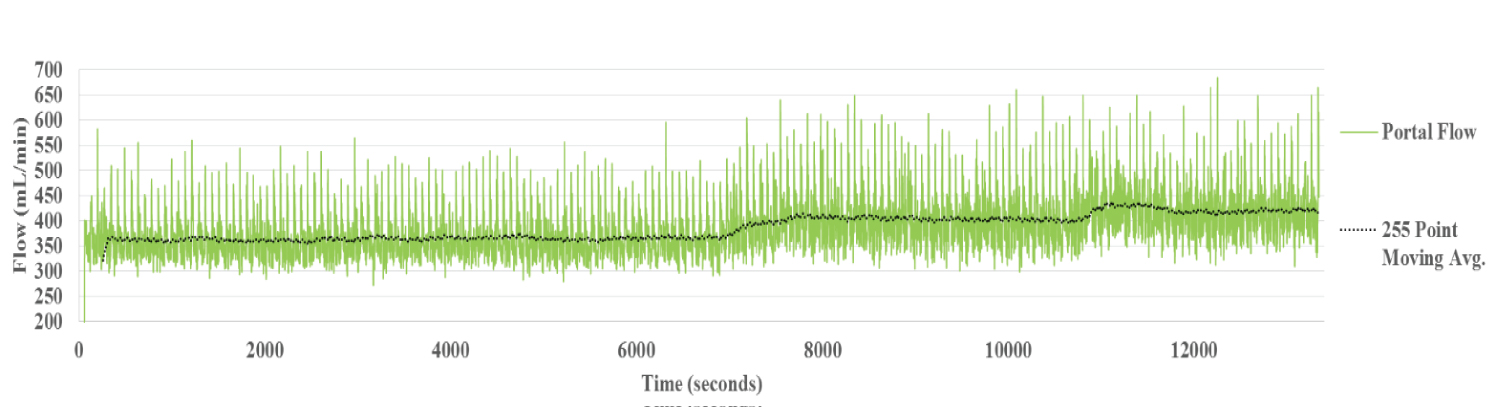 Figure 1b: Portal Vein Flow Liver 1. Similar systolic/diastolic pulsations generated in the HA circuit are seen in the PV. The portal vein flow with the perfusate temperature set to 15 °C was stable.
View Figure 1b
Figure 1b: Portal Vein Flow Liver 1. Similar systolic/diastolic pulsations generated in the HA circuit are seen in the PV. The portal vein flow with the perfusate temperature set to 15 °C was stable.
View Figure 1b
The systolic/diastolic fluctuations present in the HA and PV circuits are absent in the HV. Presumably these are attenuated in the hepatic sinusoids.
The hepatic venous flow rate averaged 635 mL/min during perfusion at 15 °C (Figure 1c). Simultaneous with the rise in temperature to 30 °C, flow rate increased significantly to 736 mL/min (15.9 per cent). A transient 'bump', similar to that observed in PV flow was noted around 11000 secs and is likely artefactual.
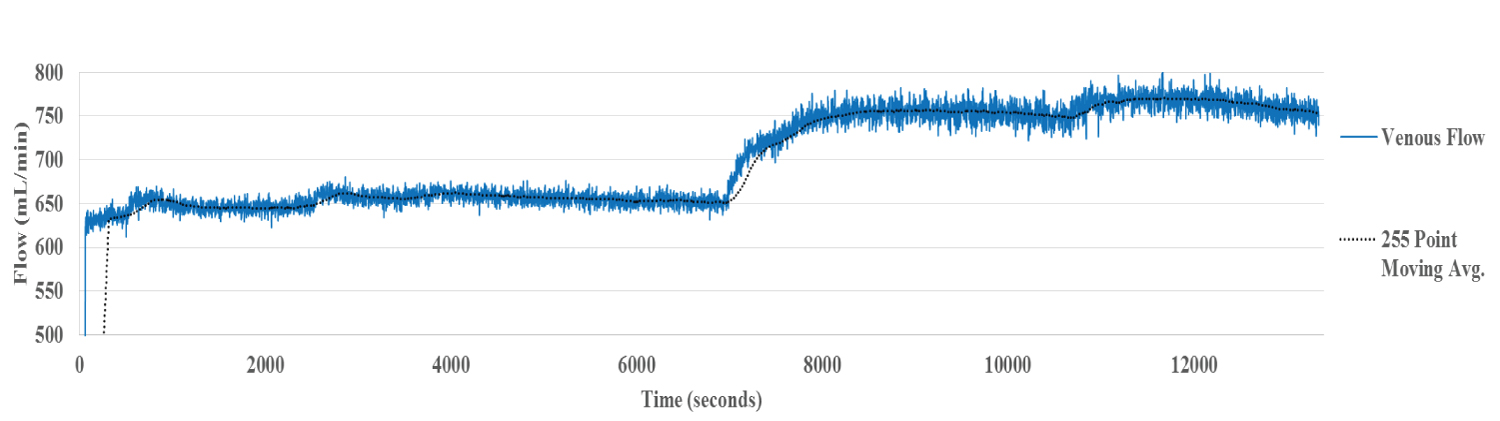 Figure 1c: Hepatic Venous Flow Liver 1. The systolic/diastolic fluctuations present in the inflow circuit are absent, presumably after attenuation in the hepatic sinusoids. A significant increase in flow is noted with the increase in perfusate temperature.
View Figure 1c
Figure 1c: Hepatic Venous Flow Liver 1. The systolic/diastolic fluctuations present in the inflow circuit are absent, presumably after attenuation in the hepatic sinusoids. A significant increase in flow is noted with the increase in perfusate temperature.
View Figure 1c
CaVESWave® emulates systolic and diastolic waveforms that appear as HA pulsations. Similar, but slightly attenuated pulsations are also present in the PV. They are presumed to be directly transmitted from the HA to the PV across the sinusoids. By contrast, pulsations are not observed in the HV.
Flow rates in all three circuits HA, PV and HV were stable during the entire period of perfusion at 15 °C. Almost immediately after the perfusate temperature was increased to 30 °C, the flow in all three vessels, HA, PV and HV increased.
Liver 6 is representative of group B (Figure 2a, Figure 2b and Figure 2c). In this group, perfusion with PBS was extended for two hours at the reduced temperature of 15 °C, in order to determine the reversibility of the vascular changes. The average flow is illustrated by the black line. The temperature of the liver, measured to a depth of three millimeters by IR thermography is also shown (yellow line).
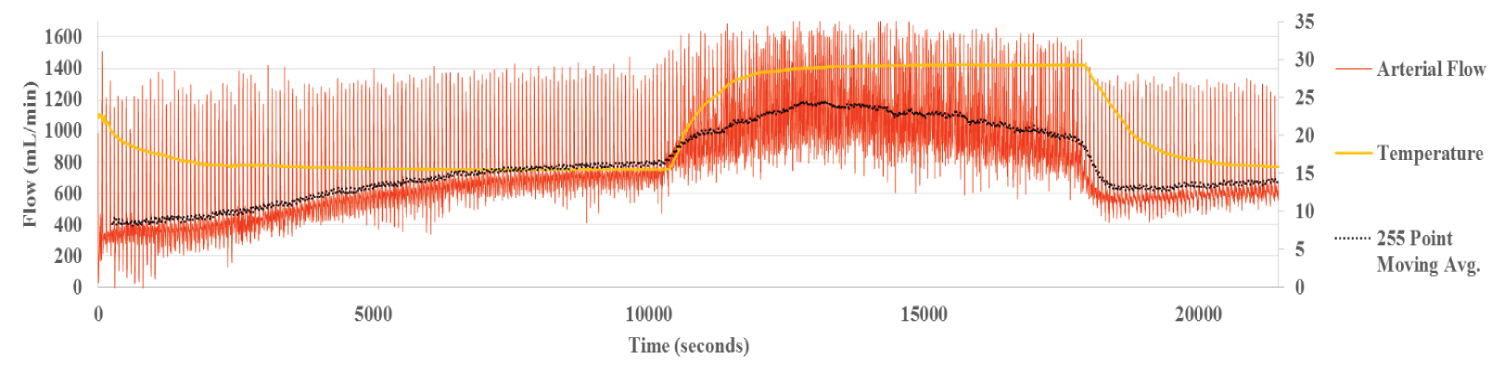 Figure 2a: Hepatic Arterial Flow Liver 6. The black line represents the average flow and the yellow line, the temperature of the liver as measured by IR thermography. Smooth flows and transitions are seen for each temperature change.
View Figure 2a
Figure 2a: Hepatic Arterial Flow Liver 6. The black line represents the average flow and the yellow line, the temperature of the liver as measured by IR thermography. Smooth flows and transitions are seen for each temperature change.
View Figure 2a
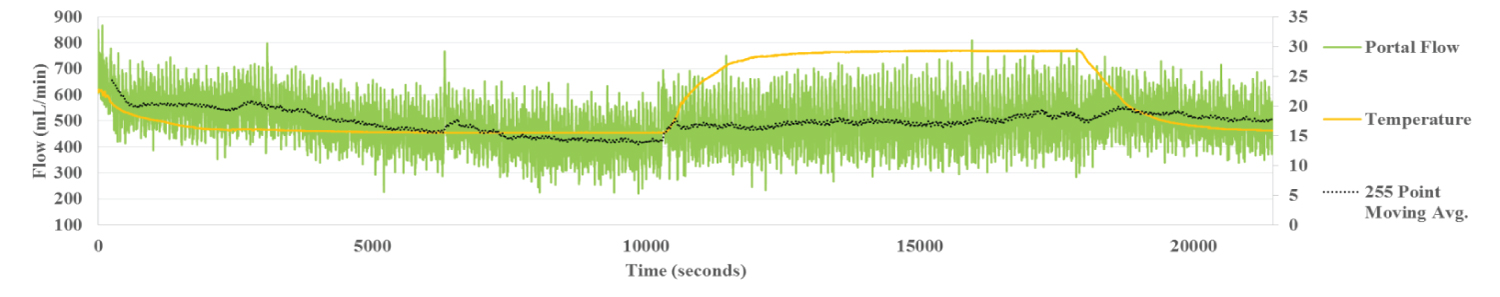 Figure 2b: Portal Flow Liver 6. Portal flow shows little variation with temperature change.
View Figure 2b
Figure 2b: Portal Flow Liver 6. Portal flow shows little variation with temperature change.
View Figure 2b
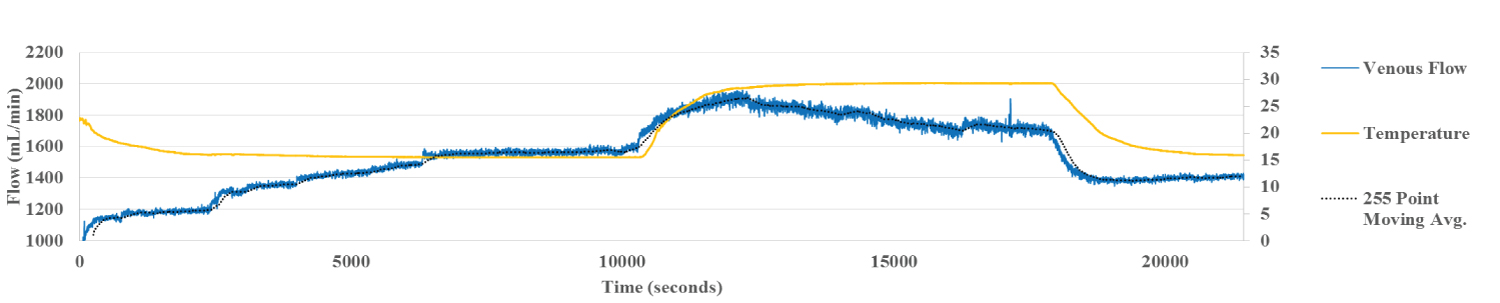 Figure 2c: Hepatic Vein Flow Liver 6. Venous flow shows behavior similar to arterial flow although not as smooth.
View Figure 2c
Figure 2c: Hepatic Vein Flow Liver 6. Venous flow shows behavior similar to arterial flow although not as smooth.
View Figure 2c
During perfusion at 15 °C, the temperature of the liver as measured by IR thermography stabilized within 30 min. By contrast, the HA flow rate increased more gradually, taking over 100 min to reach steady state temperature, allowing for dynamic correlation between flow and temperature (Figure 2a). The flow within the portal vein, recorded at the same time, correlated inversely with the HA flow, reaching steady state around the same time (Figure 2b). Flow in the HV followed the pattern of the HA (Figure 2c). The inverse relationship between HA and PV is clear demonstration of the hepatic artery buffering response, HABR where arterial flow compensates for changes in PV flow.
The rise in IR thermography measured temperature to 30 °C was associated with an almost simultaneous increase in HA flow. Similarly, with the abrupt lowering of liver temperature back to 15 °C, HA flow declined abruptly and in parallel (Figure 2a). At stabilization, the mean HA flow at 15 °C was 780 mL/min. At 30 °C, it rose to 1061 mL/min, an increase in flow rate of 36 per cent and returned to 662 mL/min, when the temperature of the liver was lowered back to 15 °C. Thus, changes in HA blood flow, in response to temperature changes occur rapidly and are reversible.
By contrast, there was only a minor increase in PV flow with the rise in temperature of the liver to 30 °C. Flow rate remained stable and did not change when the liver temperature was reduced back to 15 °C. Flow rate in the PV stabilized at 426 mL/min at the liver temperature of 15 °C. It then rose slightly with the temperature increase to 30 °C, but was little changed, 511 ml/min, when perfusate temperature and liver temperature was brought back down to 15 °C (Figure 2b).
HV flow, which is a composite of HA and PV flow, mirrored the HA flow. It rose abruptly with the change in temperature to 30 °C and then dropped with the fall in temperature to 15 °C at the end of the experiment.
Livers 8-10 (group C), followed the basic protocol, except that Custodial was substituted for PBS. Liver 8 is representative of the flow rates for the three vascular channels, illustrated below. Custodiol-N is a low viscosity preservation solution specifically designed to prevent free radical-induced tissue alterations and to protect vascular integrity of organ grafts [11].
As with Custodiol, a slow, consistent increase in flow rate was observed in the HA as the liver warmed up to 15 °C (Figure 3a). By contrast, flow rate in the PV fell (Figure 3b), once again demonstrating the principle of hepatic artery buffering response, HABR.
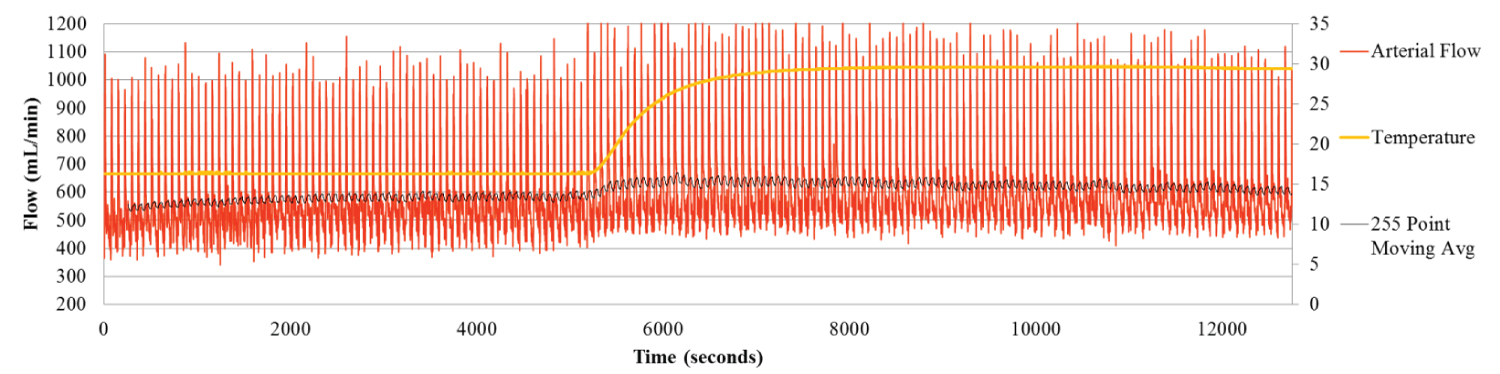 Figure 3a: Hepatic Arterial Flow for Liver 8. The Hepatic arterial flow gradually increases during the first two hours as the liver warms to 15 °C. As the Arterial flow increases the Portal flow slowly decreases.
View Figure 3a
Figure 3a: Hepatic Arterial Flow for Liver 8. The Hepatic arterial flow gradually increases during the first two hours as the liver warms to 15 °C. As the Arterial flow increases the Portal flow slowly decreases.
View Figure 3a
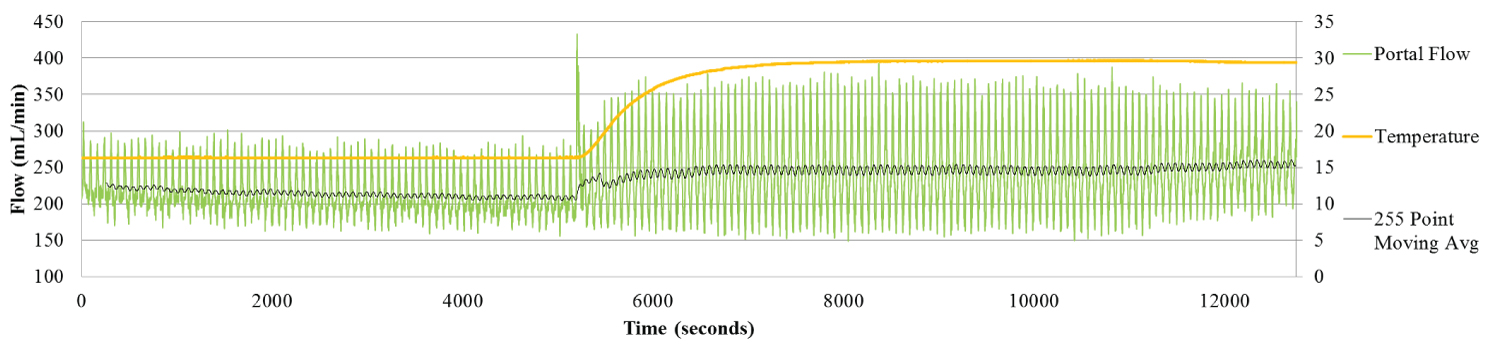 Figure 3b: Portal Flow for Liver 8. The Portal flow shows the inverse relation between the Arterial and Portal flow, specifically during the first two hours as the liver warms to 15 °C. As the Arterial flow increases the Portal flow slowly decreases.
View Figure 3b
Figure 3b: Portal Flow for Liver 8. The Portal flow shows the inverse relation between the Arterial and Portal flow, specifically during the first two hours as the liver warms to 15 °C. As the Arterial flow increases the Portal flow slowly decreases.
View Figure 3b
With the increase in organ temperature from 15 °C to 30 °C, a simultaneous increase in HA flow rate from 584.6 mL/min, to 613.5 mL/min. was observed.
Increasing the liver temperature to 30 °C was also associated with an increase in PV flow, from 208.9 ml/min to 251.7 ml/min (Figure 3c).
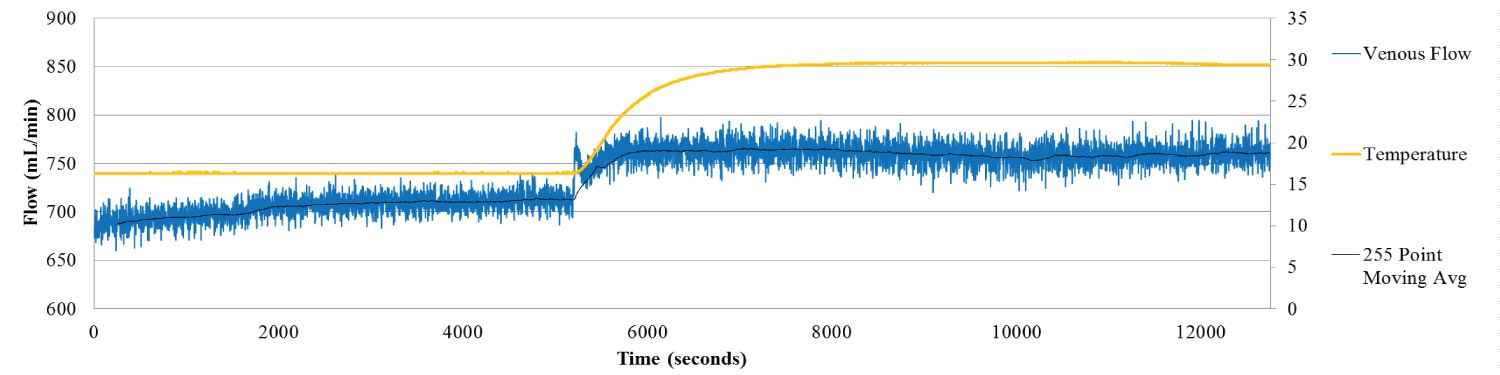 Figure 3c: Hepatic Venous Flow for Liver 8. Venous flow shows the expected trend- flow increases with temperature increase.
View Figure 3c
Figure 3c: Hepatic Venous Flow for Liver 8. Venous flow shows the expected trend- flow increases with temperature increase.
View Figure 3c
The flow measurement data derived from perfusion of all 10 livers are summarized in Table 1. Mean HA flow at 15 °C, 758 ± 258 ml/min was twice that of the PV flow, 319 ± 34 ml/min. As expected, HV flow 903 ± 182 approximated the sum of both HA and PV inflow. Increasing the temperature of the liver from 15 °C to 30 °C was associated with a significant increase in HA flow, from 758 ± 258 ml/min to 876 ± 237 ml/min, p < 0.03. The increase in HV flow from 903 ± 182 ml/min to 979 ± 154 ml/min was also significant, p < 0.014. By contrast, the increase in PV flow from 319 ± 34 ml/min to 367 ± 39 ml/min was not significant, p < 0.09.
The reversibility of the model was tested by reducing the temperature of the perfusate back to 15 °C from 30 °C (Livers 5-7; Table 1). This was associated with a reduction in flow, to the original levels. HA, PV and HV flow rates were 501.7 ± 225 ml/min, 420 ± 20.8 ml/min and HV 1074 ± 407.1 ml/min respectively. At the end of the experiment, flows were 388.3 ± 203 ml/min, 496.3 ± 105 ml/min and 930 ± 335.6 ml/min. There was no significant difference between any of the three flow rates, p = 0.45, 0.33 and 0.34, respectively. These data suggest that the vascular response to the temperature change might be related to active changes in the blood vessels, rather than temperature related passive damage.
Table 1: Flow rates before and after temperature change (Arterial = hepatic artery HA flow; Portal = portal vein PV flow; Venous = hepatic vein HV flow): The differences between HA flow and HV flow at 15 °C and 30 °C were significant, *p < 0.03 and **p < 0.014 respectively. PV flow rates at 15 °C and 30 °C did not differ significantly, p < 0.09. View Table 1
Custodiol, hydroxytryptophan ketoglutarate (HTK) solution, was originally developed as a cardioplegic solution. It has been shown to be effective for kidney and liver preservation. HTK is an extracellular solution comprising histidine as the buffer, tryptophan as a membrane stabilizer and ketoglutarate as the energy substrate.
Substitution of Custodiol in place of PBS was associated with lower flow rates in the PV. At 15 °C, the mean flow in the PV with Custodiol was 207.7 ± 21 ml/min, compared to 362.7 ± 60.6 with PBS (p < 0.003). At the higher temperature of 30 °C, PV flow was 246.7 ± 23.5 with Custodiol compared to 430.3 ± 130.6 ml/min (p < 0.047) with PBS. Flow rates in the HA and HV were not significantly different between livers perfused with PBS and Custodiol.
The Sensirion flow sensors (Sensirion Model SLQ-QT500, Switzerland) accurately and reproducibly detect and record the flow rates in HA, PV and HV in porcine livers, under the conditions of our experiments. For the most part, the sensors record stable and reproducibly accurate measurements.
As expected, flow in the HA was pulsatile, reflecting the cardio-emulated waveform generated by Caves Wave. The demonstration of pulsatile flow in the PV, on the other hand was unexpected.
Pulsatile portal vein flow has been described in the mini-pig. However, attempts to define the source of the pulsations in the intact animal pig did not prove feasible [12,13], given the presence of cardiac and respiratory motions in the intact animal.
Doppler sonography shows pulsatile portal venous waves in healthy human adults. The pulsations decrease during sitting and with deep inspiration. The pulsations also show an inverse correlation to body mass index [14]. Given the potential impact of respiratory activity or cardiac activity transmitted directly or indirectly through the liver or inferior vena cava, the origin of these pulsations cannot be clearly identified.
The ex vivo perfused porcine liver model is devoid of cardiac or respiratory artefacts. In this setup, systolic and diastolic waves are derived from the cardio-emulation CavesWave perfusion pump, directly connected to the hepatic artery. No other possible source of pulsation is present in this system. Our results demonstrate, for the first time that pulsations in the portal vein may be unrelated to respiratory or cardiac activity. In our model, pulsations observed in the portal vein can only reflect transmission from the hepatic artery across the sinusoidal walls.
Blood flow to individual organs in mammals is usually via arteries and arterioles. The latter feed capillaries and organs with oxygen and nutrient rich blood. The capillaries coalesce into veins that return blood back to the heart. Autoregulation of blood flow through organs is generally via arterioles that can alter their caliber through mechanisms that respond to neurogenic or chemical stimuli. The liver is unique in possessing a dual blood supply from both portal vein and hepatic artery and unlike arterioles, terminal venules are not considered capable of actively controlling vessel caliber [4]. It is therefore, not clear what role, if any terminal venules play in regulating blood flow through the liver.
The portal venous system contains significant potential regulators of hepatic sinusoidal blood flow. Studies using intravital and scanning electron microscopy show that a potent vasoconstrictor endothelin (ET)-1 causes a contraction of the sinusoidal endothelial fenestrae (SEF) via the ET_B receptors. ET-1 also induces significant contraction of the portal venules and terminal portal venules. The endothelial cell linings along the hepatic sinusoids are characterized by the presence of a large number of sieve plate-like pores, 100 nm in diameter, the sinusoidal endothelial fenestrae (SEF). The SEF are dynamic structures, forming the racemose invaginations of the endothelial plasma membrane across the endothelium, and regulating not only the permeability of hepatic sinusoids, but also the sinusoidal blood flow by the calcium-actomyosin-mediated contraction and dilatation of the SEF.
Caveolin-1, the principal structural protein of caveolae, and endothelial nitric oxide synthase (eNOS) co-exist in the plasma membrane of the SEF. This implies that the SEF may correspond to a permanent (stationary) type of fused and interconnected caveolae, that may contribute to the local control of hepatic sinusoidal blood flow by the regulation of NO synthesis [5-7].
Flow rates in the hepatic artery, portal vein and hepatic artery were measured at two temperatures, 15 °C and 30 °C. Mean hepatic artery flow increased significantly from 758 ± 258 ml/min to 876 ± 237 ml/min. Similarly, hepatic vein outflow increased significantly from 903 ± 182 ml/min to 979 ± 154 ml/min. By contrast, the increase in PV flow from 319 ± 34 ml/min to 367 ± 39 ml/min was not significant. These data do not suggest a major role for the portal vein in regulating liver blood flow, at least in response to temperature changes between 15 °C to 30 °C. However, in several individual instances, there was a suggestion of slightly increased PV flows at the higher temperature. Thus, our data do not completely rule out a limited potential for portal vein, to regulate hepatic blood flow in response to temperature change.
A prime role of the hepatic artery is to supply oxygen to sinusoidal blood, as well as to the bile ducts, portal venules and nerves in the portal tract [7]. However, it is unclear, whether hepatic blood flow regulation is the sole function of the arterioles or whether the terminal venules might play a role. Accumulating evidence suggests a complex interaction between terminal portal venules and terminal hepatic arterioles.
In several instances, we observed an inverse relationship between portal vein and hepatic artery flow at the start of the perfusion, as the liver temperature equilibrated with that of the perfusate. Two examples are illustrated below (Figure 2a, Figure 2b, Figure 3a and Figure 3b). In both examples, it can be seen that as the temperature of the liver equilibrated with that of the perfusate, hepatic artery flow gradually increased; at the same time, the portal vein flow decreased. This likely reflects the hepatic artery buffer response mechanism, where the arterial flow compensates for any reduction in portal flow [15-17].
In general, the arterial flow to tissues changes in response to altered metabolic and other homeostatic demands. However, it is not clear, how this applies to the liver, with its dual blood supply. The artery supplies oxygen rich blood and the portal vein is rich in nutrients. There is a lack of expected vascular changes with altered oxygen content of blood, altered metabolic activity induced by enzyme induction or enzyme inhibition, and altered oxygen uptake or biliary secretion [18,19].
As discussed about, increasing the temperature of the liver from 15 °C to 30 °C was associated with a significant increase in HA but not PV flow. The increase in HV outflow, a composite of HA and PV is not unexpected. Reducing the temperature of the perfusate back to 15 °C from 30 °C was associated with a reduction in HA flow back to the initial levels. These data suggest that active mechanisms control the response of HA flow to temperature changes.
A final and unexplained observation is the effect of substituting PBS perfusion with Custodiol, a solution used for organ preservation, on PV flow in our model. At both lower and higher temperatures, the flow rate within the PV, but not the HA is significantly lower with Custodiol than with PBS. Custodiol is a low viscosity solution and thus might be expected to increase flow. Thus, viscosity alone does not explain our findings. The possibility that Custodiol-HTK influences the reactivity and subsequent radius of the terminal venules cannot be ruled out.
In conclusion, our liver explant model demonstrates effective physiological responses, both in terms of hepatic artery buffering response, as well as regulation of hepatic blood flow in response to temperature change in the liver. These data strongly suggest that the porcine liver explant and by extension, the explanted human liver may be excellent models for the study of blood flow in the normal and cirrhotic state. The model also offers an opportunity for testing the effect of drugs on blood flow in normal and cirrhotic livers, uniquely perfused using cardio-emulated arterial waveforms.
This work was supported by an investigator initiated grant IIR 15038 from Intercept Pharmaceuticals.