A simple model is developed for spread of a pandemic disease. The model is based on simple, uninhibited population growth except that the rate of infection is assumed to be proportional to the existing infected population. The model is in agreement with the CDC data on COVID-19 for the United States in 2020.
Coronavirus, Pandemic, Model, COVID-19
Ever since humans have walked on the face of Earth, they have been afflicted by various diseases, some of which have wiped out large fractions of their population. Infectious diseases such as malaria and tuberculosis affected the population of Egypt thousands of years ago. In the early Medieval Period, the Plague of Justinian killed nearly a quarter of the world's 200 million population. During 1918-1919, the Spanish flu (H1N1 virus) infected about one-third of the world's population and killed 20-50 million people. In the period of 1956-1958, the Asian flu (H2N2 virus) pandemic caused about 2 million deaths worldwide, 69800 of which was in the United States alone. The flu pandemic of 1968 (H3N2 virus) caused approximately 1 million deaths. The 2009 H1N1 pandemic (H1N1pdm09 virus) started in the Unites State and spread around the world. The flu caused 12470 deaths in the Unites States. Finally, the longest lasting pandemic HIV/AIDS, with its peak during 2005-2012, has killed more than 36 million people worldwide since 1981 [1,2].
Today the world is facing yet another pandemic, the coronavirus disease of 2019 (COVID-19) which as of December 2020 has infected nearly 79 million people worldwide and killed over 1.73 million [3]. This has generated a great number of investigations trying to understand the dynamics of the spread of the disease and to predict its future evolution [4-8].
The purpose of this article is not to suggest any preventive measures for COVID-19, but to propose a different yet simple model for the dynamics of the spread of the disease. The goal is to test an ab initio assumption that results in the spread of not just COVID-19 but any pandemic.
Let us first consider the problem of normal uninhibited population growth. At any time t, the rate of population growth is proportional to the existing population,
Where the growth constant k is a positive number, which is the probability per unit time of a member of the population to double. This equation integrates to
where is the initial population. We may also include the death rate in this problem by using , where and are, respectively, the birth and death constants.
In the population growth model, the parameter k is constant. In the spread of a pandemic disease, on the other hand, the growth parameter is not a constant. In fact, in a given population, the probability with which a contagious disease spreads increases with the fraction of the infected population. If we assume that this probability is proportional to the fraction of the infected population,
where k is a constant, n is the infected population, and N is the total population, then we have
in which is the remaining healthy population at time t. Dividing both sides of this equation by N and denoting by (the fraction of the infected population), we get
integration of which gives
Where A is related to the integration constant. Using the initial condition , we get
and therefore,
which gives the fraction of the infected population as a function of time. However, since in a real pandemic outbreak normally << 1, this equation reduces to
Also, since and , we can also write
where is the initial infected population. Note that the functional form of Eq. (10) is quite different from that of simple exponential population growth Eq. (2). In fact, the graph of Eq. (10), shown in Figure 1, is generally known as the logistic growth curve [9].
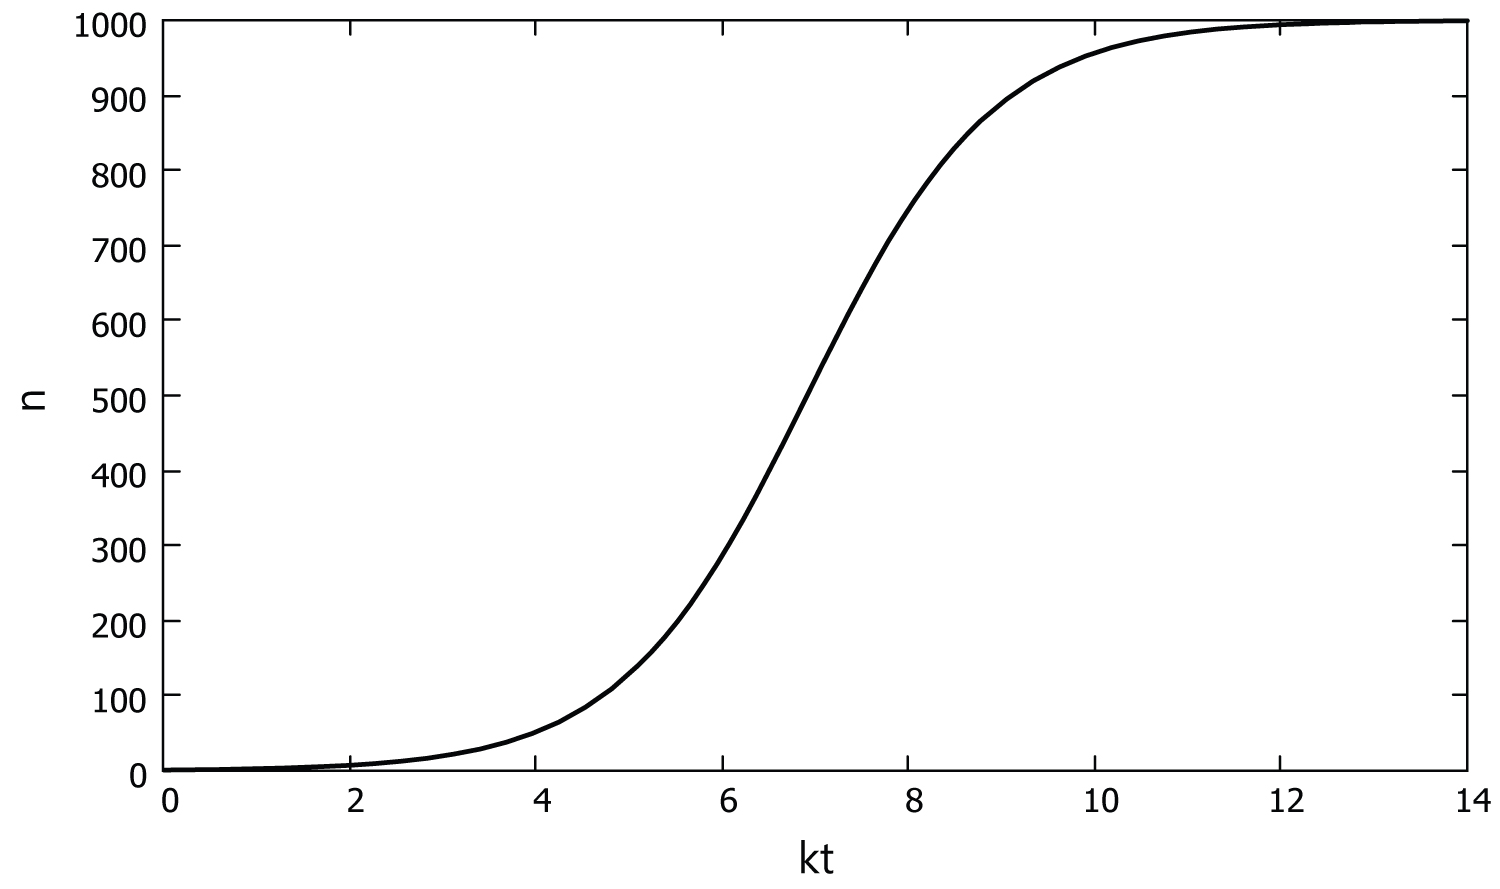 Figure 1: A graph of Eq. (10) with = 1 and = 1000.
View Figure 1
Figure 1: A graph of Eq. (10) with = 1 and = 1000.
View Figure 1
To check the validity of our model, we have compared it to the COVID-19 data provided by CDC (Centers for Diseases Control and Prevention) for the United States in the period of January 22, 2020 to January 25, 2021 [10], shown in Table 1. We have used the data in 5-day steps. Thus, in Table 1, Day 0 corresponds to January 22, 2020 and Day 370 corresponds to January 25, 2021.
Table 1: Total number of COVID-19 cases in the United States from January 22, 2020 to January 25, 2021. The values are as of January 27, 2021 as they are continuously revised up by CDC due to new data coming in. View Table 1
In equation (10), for the total population we used the current population of the United States, 331 million. In this equation, k is an adjustable parameter that has to be fitted to the data. In addition, the initial data is highly uncertain as very few people were tested for the virus in the early stages of the pandemic. This is further evidenced by the fact that even the more recent CDC data are continuously revised up as more data come in. Therefore, we allowed the initial number of the infected population to be an adjustable parameter as well. Consequently, we performed a nonlinear least-squares analysis and fitted Eq. (10) with N = 3.31 × 10⁸ to the CDC data via the parameters and k. For the best fit, we obtained the following values for these parameters to three significant figures,
= 414000 ± 22600 and k = 0.0114 ± 0.0002 day-1 (11)
Figure 2 shows the graph of Eq. (10) with these parameters as well as the CDC data for the COVID-19 pandemic in the United States.
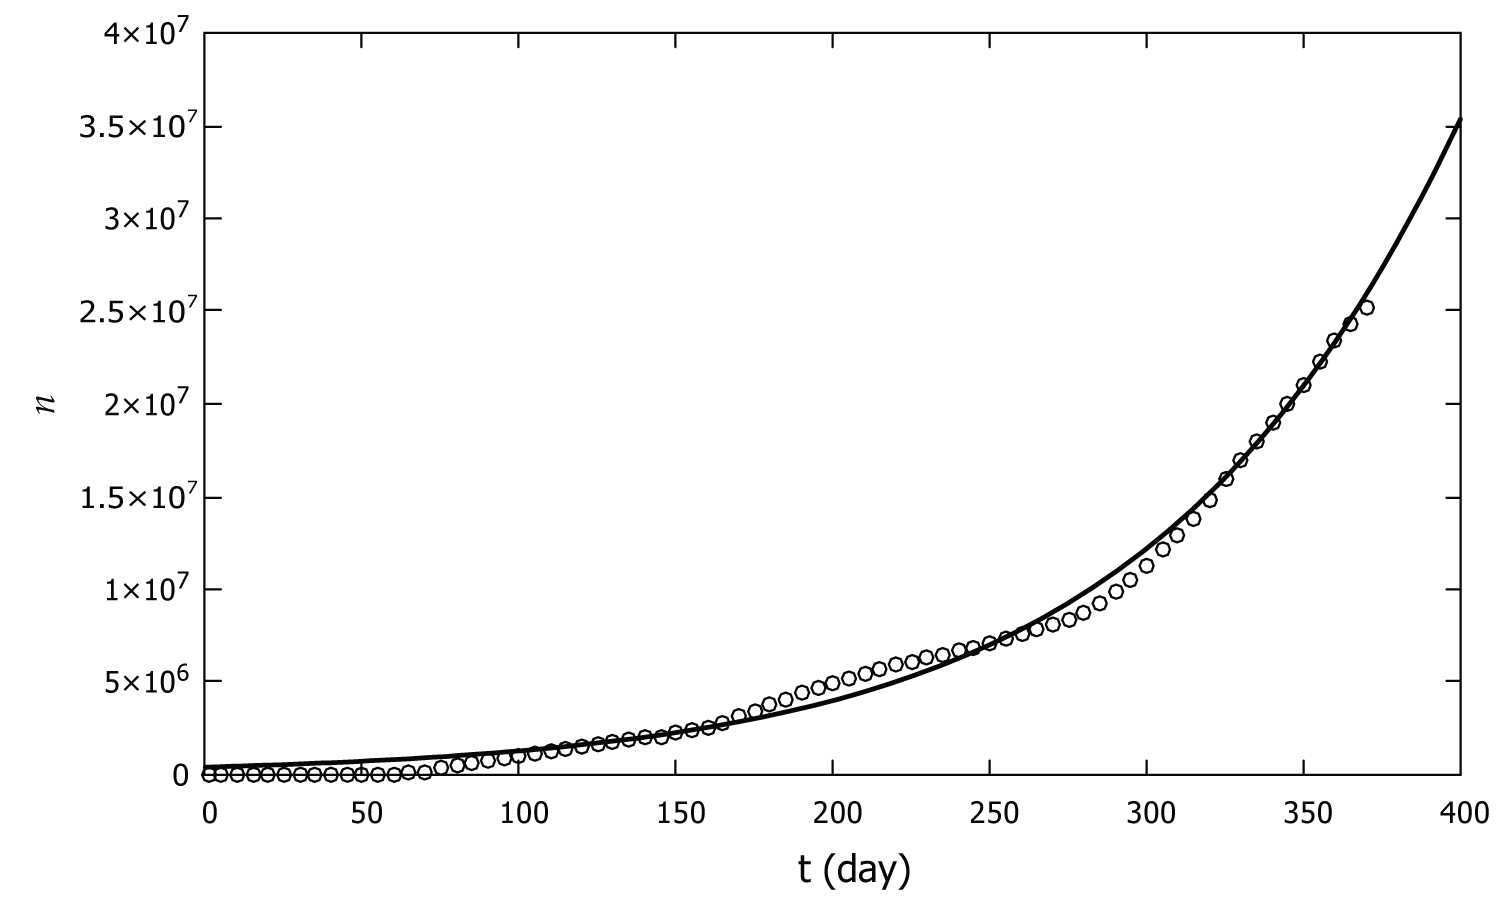 Figure 2: Number of COVID-19 cases in the United States as a function of time from January 22 of 2020 to January 25 of 2021. The CDC data are represented by circles and the model developed in this work is shown by the solid line.
View Figure 2
Figure 2: Number of COVID-19 cases in the United States as a function of time from January 22 of 2020 to January 25 of 2021. The CDC data are represented by circles and the model developed in this work is shown by the solid line.
View Figure 2
Figure 2 shows that the model presented here agrees with the coronavirus data of 2020 in the United States. The model is quite simple and only assumes the probability of infection is proportional to the fraction of the infected population. The model involves only two adjustable parameters which are obtained by fitting the data. This is in contrast to other models which involve several adjustable parameters. For example, the model developed by Kaxiras and Neofotistos for the COVID-19 pandemic involves 5 adjustable parameters.
As can be seen from Figure 2, the pandemic data shows small variations in the slope at days number 50, 150, and 250. These are attributed to small changes in the parameters of the pandemic dynamics as a result of behavioral changes of the people such as wearing masks, social distancing, etc. However, the overall spread of the disease closely follows the logistic growth curve (10).
Based on Figure 2 and the agreement of Eq. 10 with the CDC data, we conclude that the assumption of probability of disease spread being proportional to fraction of the infected population is quite reasonable.
This work was supported in part by a URAP grant from the University of Wisconsin-Parkside.