Universal to all cell therapies (CT) is the need to determine the number of cells at each step of the manufacturing process as they are processed in different unit operations and developed into clinically relevant final CT products. Identifying a precise and accurate cell counting method considering the cell type and application is crucial for the development of robust and reliable manufacturing processes, product characterization, and eventually commercialization of the cell therapies. In this study, accuracy, precision and specificity of cell count and viability (CCV) measurements were assessed for Mesenchymal Stem Cells (MSC), T-cells and Induced Pluripotent Stem Cells (iPSC) using two automated platforms (Vi-CellTM XR cell analyzer and NucleoCounter® NC-200TM) and compared with manual hemocytometer-based cell staining approaches (Trypan blue and AO/PI staining). Our data shows that NucleoCounter® NC-200TM may be relatively more suitable platform for manufacturing of T-cells (with ≤ 12% CV) while Vi-CellTM XR is more appropriate for iPSCs (with ≤ 12% CV). Both NucleoCounter® NC-200TM and Vi-CellTM XR seem to be suitable platforms for MSC CCV measurement with of ≤ 12% and ≤ 14% CV, respectively. These results demonstrate that there may be no "one size fits all" solution for cell counting as the suitability of the automated cell count methods varied with different cell types. Importantly, automated CCV platforms resulted in significantly more reliable and less variable measurements, which can be a major step forward towards characterization and commercialization of CT manufacturing processes.
Cell count and Viability, Automated cell counting, Mesenchymal stem cells, Induced pluripotent stem cells, T-cells, Accuracy, Precision, Specificity
Cell count and viability (CCV) measurement is perhaps the most fundamental analytical method used in development and execution of manufacturing processes for cell therapy and regenerative medicine. CCV is also a routine release specification for almost all cell therapy products and is used to determine populations to densities, potency assays, functional cell assays, ELISA and Gene modification assays [1-3]. Therefore, the choice and implementation of cell counting methodology can play a pivotal role in the development of manufacturing processes, and eventually commercialization of cell therapies.
Cell counts and viability measurements are used to determine cell health, proliferation rates, apoptosis rates and product dosing and to ensure the manufacturing process can lead to production of clinically relevant and quantitatively reliable product. The accuracy of CCV measurement is essential in determining the effective dose of final cell therapy products, and accurate viability and cell concentrations can prevent undesirable autoimmune responses in patients receiving a particular therapeutic treatment. Therefore, it is critical to streamline, optimize and identify acceptable analytical tools for cell therapy products [4,5]. This is particularly important considering that various CCV methods, mostly manual, have been used in the development of the process and manufacturing of several applications currently offered in this field. Therefore, it would be important to harmonize the use of appropriate CCV method across different modalities in consideration of cell type and application.
Trypan Blue (TB) and Acridine Orange/Propidium Iodide (AO/PI) staining are the two most commonly used staining methods for measuring cell count and viability. Both of these methodologies have been adapted for manual and automated measurement of cell concentration and viability. Trypan Blue is a cell membrane impermeable molecule and functions by entering cells with a compromised cell membrane, thereby using cell membrane integrity as a marker of cell viability. Once TB enters the cell, it binds to intracellular proteins staining the permeable (dead) cells blue and the impermeable (live) cells remain the same without any color change [6,7]. Trypan Blue has toxic effects on cells even for a short period of exposure time and this can impact cell concentration and viability measurements if the cells are exposed for a long time [7-9]. Trypan Blue can bind non-specifically to other cellular proteins and/or artifacts and produce false positives of dead cells and false negatives from cells with intact membranes that may be undergoing early apoptosis [8].
The AO/PI method uses AO, which is a cell permeable cationic dye that produces green fluorescence with a wavelength of approximately 525 nm after binding to nucleic acids of live/dead cells. PI permeates nonviable cell membranes and binds to RNA or DNA and produces red fluorescence at a wavelength of 617 nm [7].
Both staining methods can be used with a hemocytometer, which is the most commonly used device for manual counting in laboratories. Hemocytometers are commonly used due to their low cost and versatility [10,11]. However, manual cell counting has inherent limitations including time consumption, subjectivity and variability. Human variability is inevitable when counting with hemocytometers, as sources of variability include mixing, handling, diluting samples, and counting [10-12]. With manual cell counting, the differentiation of cells from cell debris could be difficult. Counts may also vary between analysts even when following set criteria for measurement [13]. Such variations in human judgment and the subjective nature of TB counts can lead to inaccuracies and affect the results drastically [11,12]. Based on the technology provided, subjectivity and variability of manual method is magnified for aggregated cells, as it is often difficult to differentiate borders between cells and determine the cell number in the cell aggregates. This requires multiple cell counts to ensure the results are comparable and consistent to the original sample. Manual methods of counting, such as the TB method, have shown to result in lower precision and accuracy [11]. Owing to the need to develop highly reliable data sets during the development of Cell Therapies, the manual CCV approaches could be a main source of risk to develop robust GMP compliant processes. Therefore, Cell Therapy manufacturing field has moved significantly towards replacing manual cell count platforms with automated platforms [14].
Currently there are a number of automated instruments on the market that can measure cell concentration and viability. Automated cell counting, in combination with computers, optical systems, cameras and proprietary algorithms have become a preferred method for cell counting over the years, due to the promise of reduced variability and low turnaround time for measurement [10]. Although, the automated systems expedite analysis and reduce variability, there may be technical limitations in the differentiation of some cell types [10,11,13]. In this study, NucleoCounter® NC-200TM and the Vi-CellTM XR cell analyzer, two widely used automated cell counting platforms, have been used to determine the performance of these automated systems across commonly encountered cell types in the Cell Therapy field.
The NucleoCounter® NC-200TM has an integrated fluorescence microscope with two channels that detect AO and DAPI (4′,6-diamidino-2-phenylindole). The NucleoCounter® NC-200TM requires only a small amount of sample for measurement (~60uL), have the ability to handle a large number of samples, detect viable cells in a heterogenous mixture quantitatively, customize gating of cells, has high reproducibility and is 21 CFR Part 11 compliant [12]. The Vi-CellTM XR automated counter demands a larger volume of cells (≥ 500 uL), as compared to the NucleoCounter® NC-200TM, but is able to count multiple samples automatically with a 12-position autosampler. The Vi-CellTM XR enables walk-away sample analysis with an optimal counting range of 50 × 103 to 1 × 10⁴ cells/mL. Vi-CellTM XR is also 21 CFR Part 11 compliant.
Cryopreservation of the cells for storage and final product cell banking is one of the key steps of cell therapy manufacturing. The preformulated freezing media such as CryoStor® CS10 and CS5 are commonly used to cryopreserve cells in ultra-low temperature. The Dimethyl Sulphoxide (DMSO) is a cryoprotective agent which protect the cells from stress during cryopreservation process. However the undesirable toxicity issue of DMSO could potentially affect cell count viability especially during post-thaw process [15].
Considering the importance of CCV measurements in the development and manufacture of Cell Therapies, it is surprising that no empirical assessment of the different staining modalities and automated platforms has been carried out. We hypothesize that the outcome of cell count and viability measurements (particularly accuracy and precision) could largely depend on the cell type, morphology, particle debris, impurity and media composition, and these factors should be considered in the selection of an appropriate CCV platform to improve the quality of CCV measurements [16]. Specifically, we intended to evaluate different cell types with different cell properties to determine whether this would require selection of a specific cell counting platform. An ideal CCV platform for a specific cell type and application would ensure measurement confidence and improve the reliability of the manufacturing process and eventually the quality of cell products. Moreover, implementation of an automated platform would improve efficiency, reduce operator-to-operator variability, and eliminate redundancy and costs [4]. Therefore, in this study we evaluated four commonly used cell counting platforms (two automated - NucleoCounter® NC-200TM and Vi-CELL XR and two manual - Trypan Blue and AO/PI) for accuracy across three commonly encountered cell therapy cell types, Mesenchymal Stem cells (MSC), Human induced pluripotent Stem cells (hiPSC) and T-cells. The selection of these cell types was partially driven by the rapid growth of the stem cell therapies as well as immunotherapies that require more robust and reliable analytics. In addition, the cells were selected based on the study design and main hypothesis related to the difference in cellular characteristics: hiPSC (clumpy and aggregated cells), MSCs (cells of varying size) and T-cells (more consistent cell size) allowing us to cover a wide range of sample properties. Cell concentration, percent viability accuracy, precision and specificity of the methods as well as the effect of DMSO were evaluated in this study.
Induced pluripotent stem cells (iPSCs) (produced at Lonza), Mesenchymal stem cells (MSCs) and T-cells (Derived from fresh leukpak) used in this study were all acquired from Lonza. The media used for iPSCs was L7 hPSC basal medium (Cat# FP-5107, Lonza) supplemented with L7 hPSC Supplement (Cat# FP-5207, Lonza) after thaw. The media used for MSC was Mesenchymal Stem cell growth medium SingleQuots (MSCGM, Cat# PT-4105, Lonza) and Custom Immunocult XF T-cell expansion media was used for T-cells (Cat# 800-0074, Stemcell Technologies). CryoStor® CS10 (Biolife Solutions, Cat# 210102) was used at 10% concentration in media for all three cell types. Trypan blue (Sigma, Cat#T8154) was used at 0.4% working concentration. ViaStainTM AOPI staining solution (Nexcelom, Cat# CS2-0106) was diluted in a 1:1 ratio with samples for counting. Solution 10 (Cat# 910-3010) from Chemometec was used for cell killing.
The Vi-CellTM XR instrument (Beckman and Coulter) and NucleoCounter® NC-200TM (Chemometec) were employed for automated cell counting where Vi-CellTM XR is TB based and NucleoCounter® NC-200TM is AO/DAPI based. For manual methods, we used cells stained with TB and AOPI in a 1:1 ratio and used hemocytometer from INCYTO (Cat# DHC-N01-5) to count cells. EVOSTM fluorescence microscope from Invitrogen was employed to count cells stained with AOPI and to capture images of cells stained with AO and PI under a 20X magnification. Brightfield microscope (NikonTM ECLIPSE T1) was used to count and capture images of cells stained with TB under 20x magnification.
The cell concentration and cell viability were assessed for three cell types, Induced Pluripotent stem cells (iPSCs; aggregated cells), Mesenchymal stem cells (MSC; adherent cells) and T-cells (single cells). The cell concentration and cell viability were measured for all three cell types in two different matrices: Media and media with 10% CryoStor® CS10. On each day of assessment, the required cells were thawed in a 37 °C water bath and centrifuged at the proper speed and resuspended using the appropriate complete media. The cells were used to target two concentrations and two viability samples including 4.0 × 10⁶ cells/mL (High), 4.0 × 10⁵ cells/mL (Low), 70% (High) and 40% (Low) using two different matrices. The proper complete media simulated the in-process sample cell counts and the complete media with 10% CryoStor® CS10 was representative of post thaw cryo-formulation cell concentration measurement. The following cell concentration and cell viability samples were evaluated using the cell counting platforms: 4.0 × 10⁶ cells/mL (High)-media, 4.0 × 10⁵ cells/mL(Low)-media, 4.0 × 10⁶ cells/mL (High)-media+10% CryoStor® CS10, 4.0 × 10⁵ cells/mL (Low)-media+10% CryoStor®CS10, 70% (High)-media, 40% (Low)-media, 70% (High)-media+10% CryoStor®S10 and 40% (Low)-media + 10% CryoStor®CS10. During the cell concentration and viability assessments for each specific cell type, the concentration and viability samples were measured in duplicate by 3 analysts.
For trypan blue exclusion method, cells were mixed with 0.4% trypan blue in a 1:1 ratio by gently pipetting and then 10 uL of sample was loaded on to each chamber of a hemocytometer. The cells were then counted under a 20x objective microscope in duplicates by three analysts on each day of assessment. The blue stained cells were counted as non-viable cells. AOPI stained cells were prepared the same way and loaded into both chambers of a hemocytometer for counting under an EVOSTM Invitrogen fluorescence microscope under 20x magnification. The orange fluorescent cells were counted as non-viable cells and the cells fluorescing green were counted as viable cells.
The "Default" protocol available on Vi-CellTM XR analyzer (i.e. manufacturer recommended protocol) was selected to measure cell count and viability of all three assessed cell types (Supplementary Figure 7). For the NucleoCounter® NC-200TM platform "Viability Cell Count-Aggregated Cells Assay" was utilized for iPSCs and "Viability and Cell Count Assay" was used for MSC cell concentration measurements. T-Cell concentration measurement was performed using a Custom Viability and Cell Count Assay, as we observed that part of the cell population is located outside of the gate during our primary evaluation. The designed custom gate covers the entire cell population to ensure accurate cell count and viability measurement (Supplementary Figure 8).
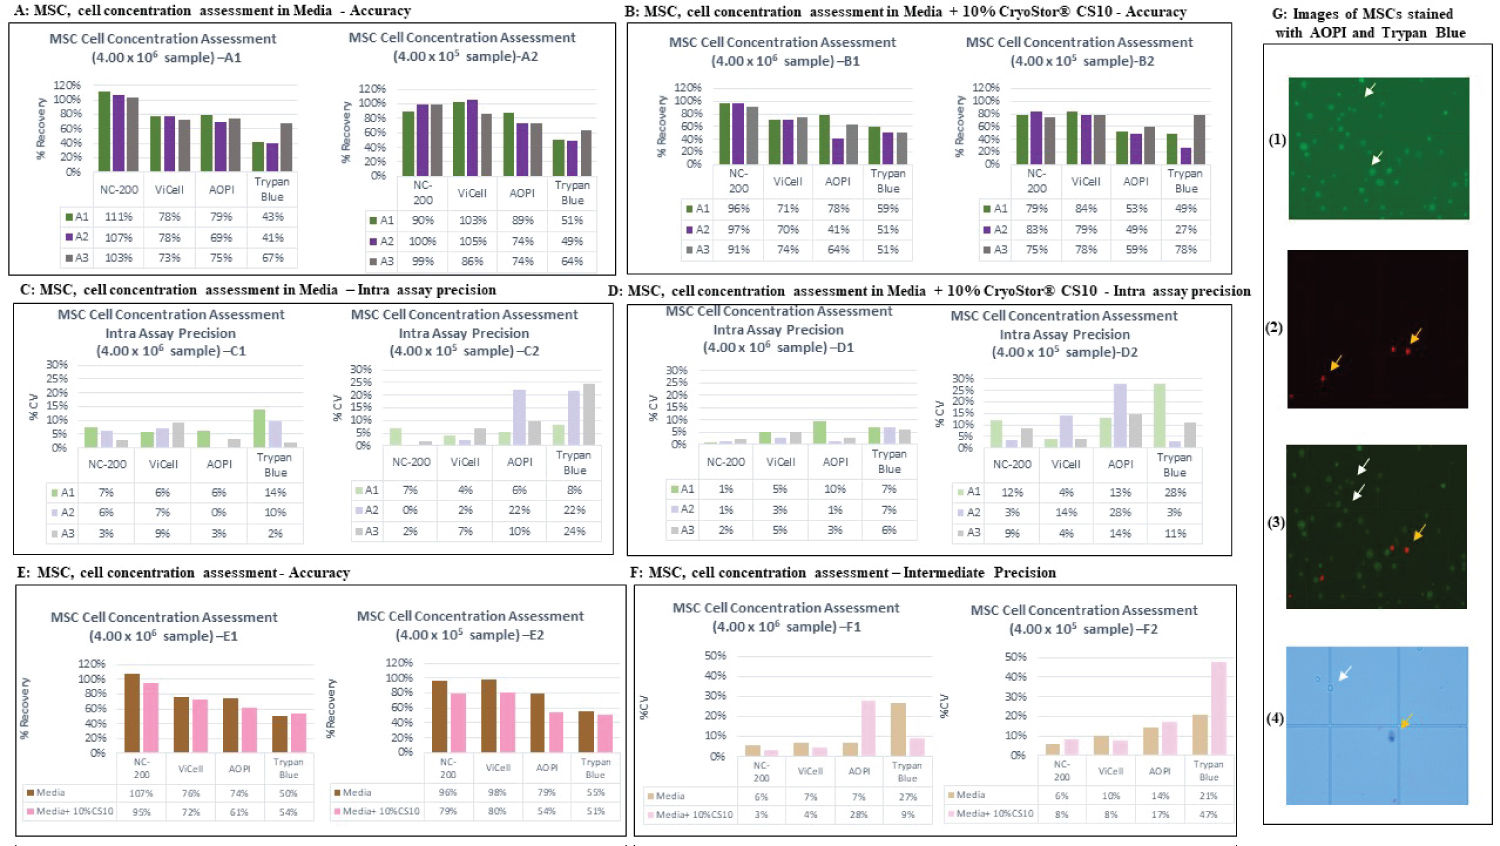 Figure 1: Accuracy by analysts and platforms using MSC cells (A,B). The % recovery data generated by each analyst is plotted across the various tested cell counting platforms. The data recorded for the two matrices (Media (A1,A2) and media + 10% CryoStor®CS10 (B1,B2) at the two examined cell concentration samples, 4.00 × 10⁶ and 4.00 × 10⁵. Each bar represents the % recovery of duplicate counts from one analyst at the certain concentration. A1, A2 and A3 stands for Analyst 1, 2 and 3, respectively. Intra assay precision for different platforms using MSC cells (C,D). The % CV within an assay was plotted according to the various tested cell counting platforms. The data produced for the two discussed matrices including Media (C1,C2) and media + 10% CryoStor® CS10 (D1,D2) at the two examined cell concentration samples, 4.00 × 10⁶ and 4.00 × 10⁵. Each bar represents the % CV within the duplicated measurement of each analyst. Accuracy and Intermediate precision data for MSC cells (E,F). The % recovery (E) and % CV (F) of six measurements performed across analysts in media or media with 10% CryoStor® CS10 were plotted against tested cell counting platforms. The intermediate precision data was displayed in section F, graph F1 (High concentration) and F2 (Low concentration). Images of MSCs stained with AOPI and Trypan blue with white arrows pointing at live cells and yellow arrows pointing at dead cells (G). 1) Shows MSCs stained with AO showing live cells 2) MSCs stained with PI showing dead cells 3) Image showing both live and dead MSCs. 4) MSCs stained with Trypan blue which shows dead cells in blue.
View Figure 1
Figure 1: Accuracy by analysts and platforms using MSC cells (A,B). The % recovery data generated by each analyst is plotted across the various tested cell counting platforms. The data recorded for the two matrices (Media (A1,A2) and media + 10% CryoStor®CS10 (B1,B2) at the two examined cell concentration samples, 4.00 × 10⁶ and 4.00 × 10⁵. Each bar represents the % recovery of duplicate counts from one analyst at the certain concentration. A1, A2 and A3 stands for Analyst 1, 2 and 3, respectively. Intra assay precision for different platforms using MSC cells (C,D). The % CV within an assay was plotted according to the various tested cell counting platforms. The data produced for the two discussed matrices including Media (C1,C2) and media + 10% CryoStor® CS10 (D1,D2) at the two examined cell concentration samples, 4.00 × 10⁶ and 4.00 × 10⁵. Each bar represents the % CV within the duplicated measurement of each analyst. Accuracy and Intermediate precision data for MSC cells (E,F). The % recovery (E) and % CV (F) of six measurements performed across analysts in media or media with 10% CryoStor® CS10 were plotted against tested cell counting platforms. The intermediate precision data was displayed in section F, graph F1 (High concentration) and F2 (Low concentration). Images of MSCs stained with AOPI and Trypan blue with white arrows pointing at live cells and yellow arrows pointing at dead cells (G). 1) Shows MSCs stained with AO showing live cells 2) MSCs stained with PI showing dead cells 3) Image showing both live and dead MSCs. 4) MSCs stained with Trypan blue which shows dead cells in blue.
View Figure 1
 Figure 2: Percent viability assessment data of MSC on different platforms (A,B). The % recovery data generated by each analyst was plotted according to the various tested cell counting platforms. The data produced for the two discussed matrices including Media (A1, A2) and media + 10% CryoStor® CS10 (B1, B2) at the two examined % viability samples, 70% and 40% .Each bar represents the % recovery determined from duplicated measurements performed by each analyst. A1, A2 and A3 stands for Analyst 1, 2 and 3, respectively. Intra Assay precision for different platforms using MSC cells (C,D). The % CV of duplicated cell counts plotted according to the various tested cell counting platforms. The data produced for the two discussed matrices including Media (C1, C2) and media + 10% CryoStor® CS10 (D1, D2) at the two examined viability samples, 70% viability and 40% viability. Each bar represents the %CV of duplicated measurements performed by each analyst. Specificity and Intermediate precision of percent viability assessment of MSC cells. The % recovery (E) and % CV (F) of six measurements performed across analysts in media or media with 10% CryoStor® CS10 were plotted against tested cell counting platforms. The accuracy data was presented in section E, Graph E1 (High viability) and E2 (Low viability). The intermediate precision data was displayed in section F, graph F1 (High viability) and F2 (Low viability).
View Figure 2
Figure 2: Percent viability assessment data of MSC on different platforms (A,B). The % recovery data generated by each analyst was plotted according to the various tested cell counting platforms. The data produced for the two discussed matrices including Media (A1, A2) and media + 10% CryoStor® CS10 (B1, B2) at the two examined % viability samples, 70% and 40% .Each bar represents the % recovery determined from duplicated measurements performed by each analyst. A1, A2 and A3 stands for Analyst 1, 2 and 3, respectively. Intra Assay precision for different platforms using MSC cells (C,D). The % CV of duplicated cell counts plotted according to the various tested cell counting platforms. The data produced for the two discussed matrices including Media (C1, C2) and media + 10% CryoStor® CS10 (D1, D2) at the two examined viability samples, 70% viability and 40% viability. Each bar represents the %CV of duplicated measurements performed by each analyst. Specificity and Intermediate precision of percent viability assessment of MSC cells. The % recovery (E) and % CV (F) of six measurements performed across analysts in media or media with 10% CryoStor® CS10 were plotted against tested cell counting platforms. The accuracy data was presented in section E, Graph E1 (High viability) and E2 (Low viability). The intermediate precision data was displayed in section F, graph F1 (High viability) and F2 (Low viability).
View Figure 2
To assess the effect of matrix on the accuracy of the result for each cell counting platform, the re-suspended cells in their respective media and media with 10% CryoStor® CS-10 were compared by calculating % recovery and % CV.
All data were analyzed and generated using Microsoft® Excel®.
Accuracy
Accuracy of the cell counting platforms were determined by evaluating the cell concentration and viability samples in two matrices. This evaluation entailed calculating the mean result for each cell concentration and % viability to determine the % Recovery relative to the target concentration of each sample. The following formula was used to calculate % recovery:
Precision
Intra-assay precision was evaluated by determining the % coefficient of variation (%CV) of the mean results of cell concentration and % viability performed by each analyst. The intermediate precision determined from the mean result of cell concentration and % viability samples was used to calculate % CV across analysts in one day using the following formula:
Specificity
The specificity of each cell counting method was determined by the ability of the platform to differentiate between live versus dead cells and return an accurate measure of % viability. The % viability sample results were used to calculate % recovery.
To assess the accuracy and robustness of cell count viability platforms multiple parameters including intra assay precision, intermediate precision, accuracy and specificity were evaluated. The acceptance criteria of the study are described in Table 1.
Table 1: The acceptance criteria used to access the accuracy, precision and specificity of the tested cell count viability platforms. View Table 1
Accuracy and Intra assay precision of MSC cells
The accuracy of each counting method was evaluated by calculating the % recovery of duplicated samples across each analyst and each cell counting platform. The % recovery was calculated for the duplicate measurements performed by each analyst for each cell concentration sample, and data generated by each analyst across the multiple platforms was utilized to determine the intra assay precision for cell concentration assessment. The MSC data indicated lower % recovery of manual platforms compared to automated methods for the two tested concentration samples (4.00 × 10⁶ cells/mL (High) and 4.00 × 10⁵ cells/mL (Low)). The automated platforms showed high accuracy within the acceptance criteria range, while the manual platforms did not meet the % recovery specification between 70-130% (Figure 1A). The data comparison between the two matrices for MSC measurement showed reduction of % recovery in media with 10% CryoStor® CS10 samples for all the tested platforms (Figure 1B).
Lower variability (% CV) was observed for MSC samples measured using automated platforms when compared to the manual. NucleoCounter® NC-200TM and Vi-CellTM XR analyzer exhibited very low % CV in both matrices and met the acceptance criteria of % CV ≤ 20% for MSC measurement. Slightly higher variation was observed for low concentration of MSC samples (media with 10% CryoStor® CS10) using the automated platforms. A similar trend was noticed for the manual platforms as a higher variation at lower cell concentrations was observed resulting in % CVs higher than 20% (Figure 1C, and Figure 1D). Figure 1G shows images of MSCs acquired using a fluorescent microscope after staining the cells with AO/PI and TB.
Accuracy and intermediate assay precision of MSCs
To determine the accuracy of the respective counting platforms/approaches, the % recovery was calculated for all the measurements performed across analysts for each particular cell concentration and matrix. The same approach was utilized to calculate the intermediate precision. The AO/PI manual and NucleoCounter® NC-200TM platform exhibited acceptable accuracy (% recovery between 70%-130%) for the MSC High and Low cell concentration samples in media. However, the AO/PI manual platform did not pass the accuracy criteria in media with 10% CryoStor® CS10 (Figure 1E2). The MSC intermediate precision data (Figure 1F) indicated lower variation in samples measured using automated methods compared to manual platforms. All the tested platforms exhibited % CV ≤ 30% excluding Low concentration sample in media with 10% CryoStor® CS10 using TB manual method (Figure 1F2).
Specificity and Intra assay precision of MSC cells
The High (70%) and low (40%) viability samples were employed for evaluation of accuracy and intra assay precision of cell counting platform.
According to the data presented in Figure 2A and Figure 2B, all the evaluated platforms met the accuracy specification for MSC High viability sample (70%) in both matrices but the manual platforms didn't meet the criteria (% Recovery between 70%-130%) for the Low viability sample (40%). The automated platforms presented high intra assay precision with the % CV of less than 20% for both High and Low viability MSC samples using both matrices (Figure 2C and Figure 2D). AOPI manual platform presented low variation for MSC High and Low viability samples in both matrices (≤ 12%) but didn't met the acceptance criteria of intra assay precision for Low viability sample in media with 10% CryoStor® CS10 (Figure 2D2). On the other hand, Trypan blue manual platform displayed high variability in media with 10% CryoStor® CS10 for both % viability samples (Figure 2D1 and Figure 2D2).
Specificity and Intermediate assay precision of MSC cells
The calculated % recovery and % CV for all the measurements performed across analysts for the MSC cell viability samples are presented in (Figure 2E and Figure 2F). The data conveyed that all the assessed platforms exhibited high accuracy within the specified range (Table 1). The intermediate precision was less than 30% across analysts, matrices and samples excluding AOPI manual method at the low %viability in media with 10% CryoStor® CS10 (Figure 2F2).
Accuracy and Intra assay precision of T-cells
The same approach was utilized to evaluate the CCV platforms accuracy for T-cells measurement. The % recovery of manual methods in most of the measurements were lower than the automated methods across analysts and matrices for both high (4.00 × 10⁶ cells/mL) and low (4.00 × 10⁵ cells/mL) cell concentrations (Figure 3). According to the T-cell data, the automated platforms irrespective to the concentration and matrix were met the % recovery acceptance criteria (% recovery between 70%-130%). The manual platform presented low percent recoveries and didn't meet the specification (Figure 3A and Figure 3B). Figure 3G shows images of T-Cells acquired using a fluorescent microscope after staining the cells with AO/PI and TB.
 Figure 3: Accuracy by analysts and platforms using T-cells (A,B). The % recovery data generated by each analyst is plotted across the various tested cell counting platforms. The data recorded for the two matrices (Media (A1, A2) and media + 10% CryoStor®CS10 (B1, B2)) at the two examined cell concentration samples, 4.00 × 10⁶and 4.00 × 10⁵. Each bar represents the % recovery of duplicate counts from one analyst at the certain concentration. A1, A2 and A3 stands for Analyst 1, 2 and 3, respectively. Intra assay precision for different platforms using T-cells (C,D). The % CV within an assay was plotted according to the various tested cell counting platforms. The data produced for the two discussed matrices including Media (C1,C2) and media + 10% CryoStor® CS10 (D1, D2) at the two examined cell concentration samples, 4.00 × 10⁶ and 4.00 × 10⁵. Each bar represents the % CV within the duplicated measurement of each analyst. Accuracy and Intermediate precision data for T-cells (E,F). The % recovery (E) and % CV (F) of six measurements performed across analysts in media or media with 10% CryoStor® CS10 were plotted against tested cell counting platforms. The intermediate precision data was displayed in section F, graph F1 (High concentration) and F2 (Low concentration). Images of T-cells stained with AOPI and Trypan blue with white arrows pointing at live cells and yellow arrows pointing at dead cells (G). 1) Shows T-cells stained with AO showing live cells 2) T-cells stained with PI showing dead cells 3) Image showing both live and dead T-cells. 4) T-cells stained with Trypan blue which shows dead cells in blue.
View Figure 3
Figure 3: Accuracy by analysts and platforms using T-cells (A,B). The % recovery data generated by each analyst is plotted across the various tested cell counting platforms. The data recorded for the two matrices (Media (A1, A2) and media + 10% CryoStor®CS10 (B1, B2)) at the two examined cell concentration samples, 4.00 × 10⁶and 4.00 × 10⁵. Each bar represents the % recovery of duplicate counts from one analyst at the certain concentration. A1, A2 and A3 stands for Analyst 1, 2 and 3, respectively. Intra assay precision for different platforms using T-cells (C,D). The % CV within an assay was plotted according to the various tested cell counting platforms. The data produced for the two discussed matrices including Media (C1,C2) and media + 10% CryoStor® CS10 (D1, D2) at the two examined cell concentration samples, 4.00 × 10⁶ and 4.00 × 10⁵. Each bar represents the % CV within the duplicated measurement of each analyst. Accuracy and Intermediate precision data for T-cells (E,F). The % recovery (E) and % CV (F) of six measurements performed across analysts in media or media with 10% CryoStor® CS10 were plotted against tested cell counting platforms. The intermediate precision data was displayed in section F, graph F1 (High concentration) and F2 (Low concentration). Images of T-cells stained with AOPI and Trypan blue with white arrows pointing at live cells and yellow arrows pointing at dead cells (G). 1) Shows T-cells stained with AO showing live cells 2) T-cells stained with PI showing dead cells 3) Image showing both live and dead T-cells. 4) T-cells stained with Trypan blue which shows dead cells in blue.
View Figure 3
All the tested platforms exhibited intra assay precision of less than 20% (Figure 3C and Figure 3D) except Vi-CellTM XR platform which presented % CV of 21% for one of the analyst at the Low concentration (Figure 3C2).
Accuracy and Intermediate assay precision of T-cells
The % recoveries of all the platforms were within the specification for T-cell excluding Trypan blue platform at Low concentration in media (Figure 3E2). In term of intermediate precision, the automated methods and Trypan blue manual platform were presented % CV within the acceptable range however AO/PI manual method in media at High concentration showed CV of 32% (Figure 3F1).
Specificity and intra assay precision of T-cells
The data in Figure 4 illustrated that only automated platforms met the accuracy specification for both 70% and 40% viability samples. Trypan Blue and AOPI manual platforms both showed low % recoveries for one of the analyst using 40% viability samples (Figure 4A2 and Figure 4B2). The intra assay precision of T-cell viability assessment confirmed that NucleoCounter® NC-200TM platform met the specification (%CV ≤ 16%) among all the platforms. Vi-CellTM XR analyzer showed high precision for all the conditions except exhibiting %CV higher than 20% for one of the analysts. The High (70% in media) and Low viability sample (40% in media with 10%CS10) of Vi-CellTM XR analyzer for analyst 2 exhibited % CV of 22% and 26% respectively (Figure 4C1 and Figure 4D2).
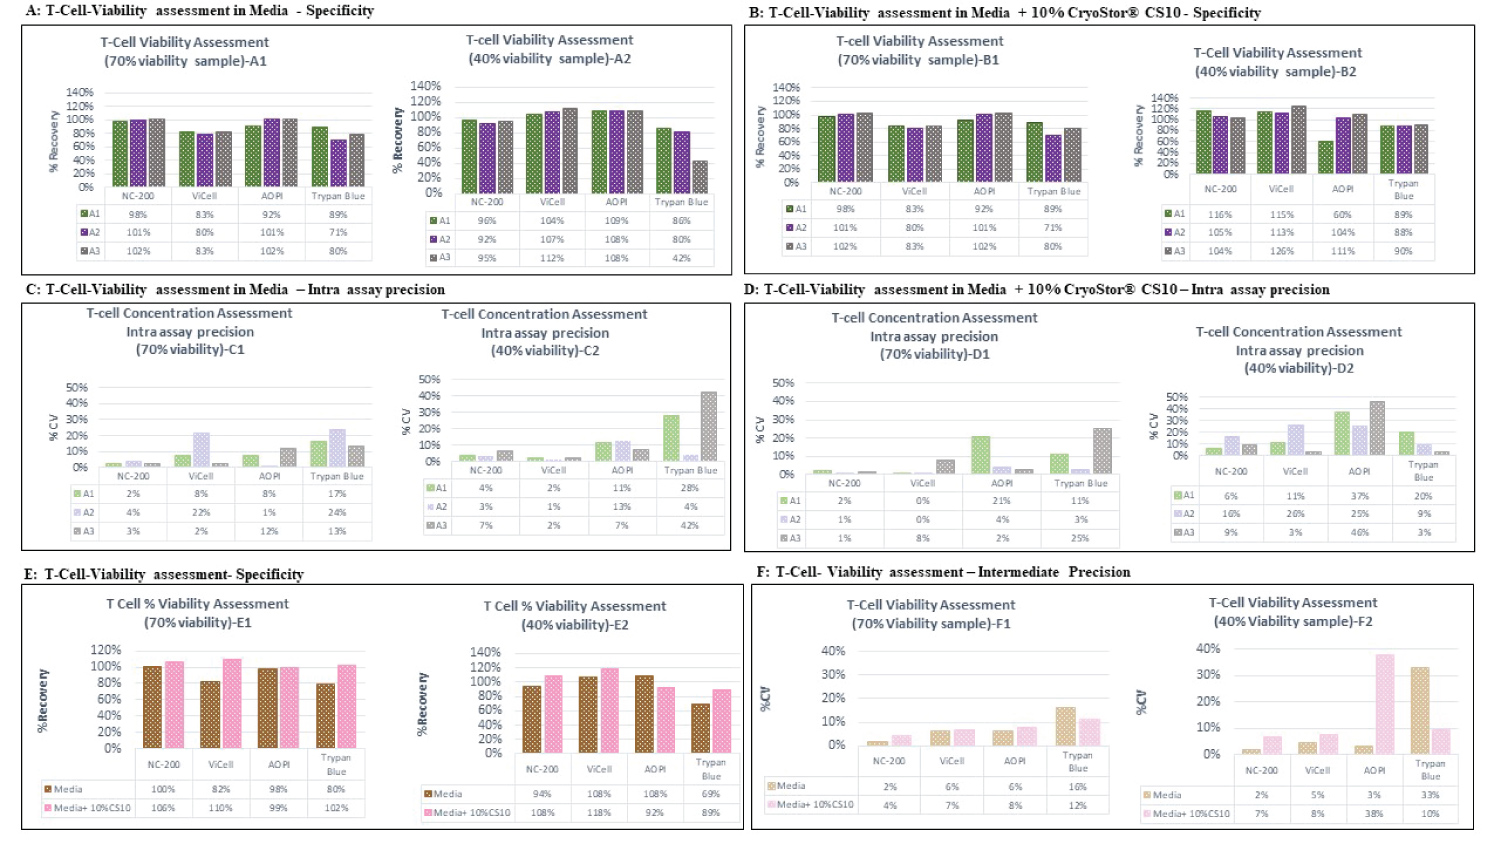 Figure 4: Percent viability assessment data of T-cells on different platforms (A,B). The % recovery data generated by each analyst was plotted according to the various tested cell counting platforms. The data produced for the two discussed matrices including Media (A1, A2) and media + 10% CryoStor® CS10 (B1, B2) at the two examined % viability samples, 70% (and 40% .Each bar represents the % recovery determined from duplicated measurements performed by each analyst. A1, A2 and A3 stands for Analyst 1, 2 and 3, respectively. Intra Assay precision for different platforms using T-Cells (C,D). The % CV of duplicated cell counts plotted according to the various tested cell counting platforms. The data produced for the two discussed matrices including Media (C1, C2) and media + 10% CryoStor® CS10 (D1, D2) at the two examined viability samples, 70% viability and 40% viability. Each bar represents the %CV of duplicated measurements performed by each analyst. Specificity and Intermediate precision of percent viability assessment of T-Cell. The % recovery (E) and % CV (F) of six measurements performed across analysts in media or media with 10% CryoStor® CS10 were plotted against tested cell counting platforms. The accuracy data was presented in section E, Graph E1 (High viability) and E2 (Low viability). The intermediate precision data was displayed in section F, graph F1 (High viability) and F2 (Low viability).
View Figure 4
Figure 4: Percent viability assessment data of T-cells on different platforms (A,B). The % recovery data generated by each analyst was plotted according to the various tested cell counting platforms. The data produced for the two discussed matrices including Media (A1, A2) and media + 10% CryoStor® CS10 (B1, B2) at the two examined % viability samples, 70% (and 40% .Each bar represents the % recovery determined from duplicated measurements performed by each analyst. A1, A2 and A3 stands for Analyst 1, 2 and 3, respectively. Intra Assay precision for different platforms using T-Cells (C,D). The % CV of duplicated cell counts plotted according to the various tested cell counting platforms. The data produced for the two discussed matrices including Media (C1, C2) and media + 10% CryoStor® CS10 (D1, D2) at the two examined viability samples, 70% viability and 40% viability. Each bar represents the %CV of duplicated measurements performed by each analyst. Specificity and Intermediate precision of percent viability assessment of T-Cell. The % recovery (E) and % CV (F) of six measurements performed across analysts in media or media with 10% CryoStor® CS10 were plotted against tested cell counting platforms. The accuracy data was presented in section E, Graph E1 (High viability) and E2 (Low viability). The intermediate precision data was displayed in section F, graph F1 (High viability) and F2 (Low viability).
View Figure 4
Specificity and intermediate assay precision of T-cells
Cell viability assessment of T-cells showed accuracy within the acceptance range for all platforms (70-130%) except the Trypan blue platform presented the % recovery of 69% for low viability sample in media (Figure 4E2). According to the data presented in Figure 4F only automated platforms met the intermediate precision specification for both High (70%) and Low (40%) tested viability samples. The manual platforms showed high intermediate precision (%CV ≤ 8%) for 70% cell viability T-cell samples but they exhibited high %CV for the low viability samples (Figure 4F2).
Accuracy and intra assay precision of iPSC cells
Induced pluripotent stem cells or iPSCs are aggregated cells and displayed greater variability with manual methods mainly due to analyst subjectivity. The percent recovery of iPSC cells in the cell concentration assessment was within the specification range for High and Low cell concentration samples using automated counting platforms. The manual platforms presented very low recovery (between 24%-66%) across all matrices and analysts compare to MSC and T-cell accuracy assessment (Figure 5A and Figure 5B).
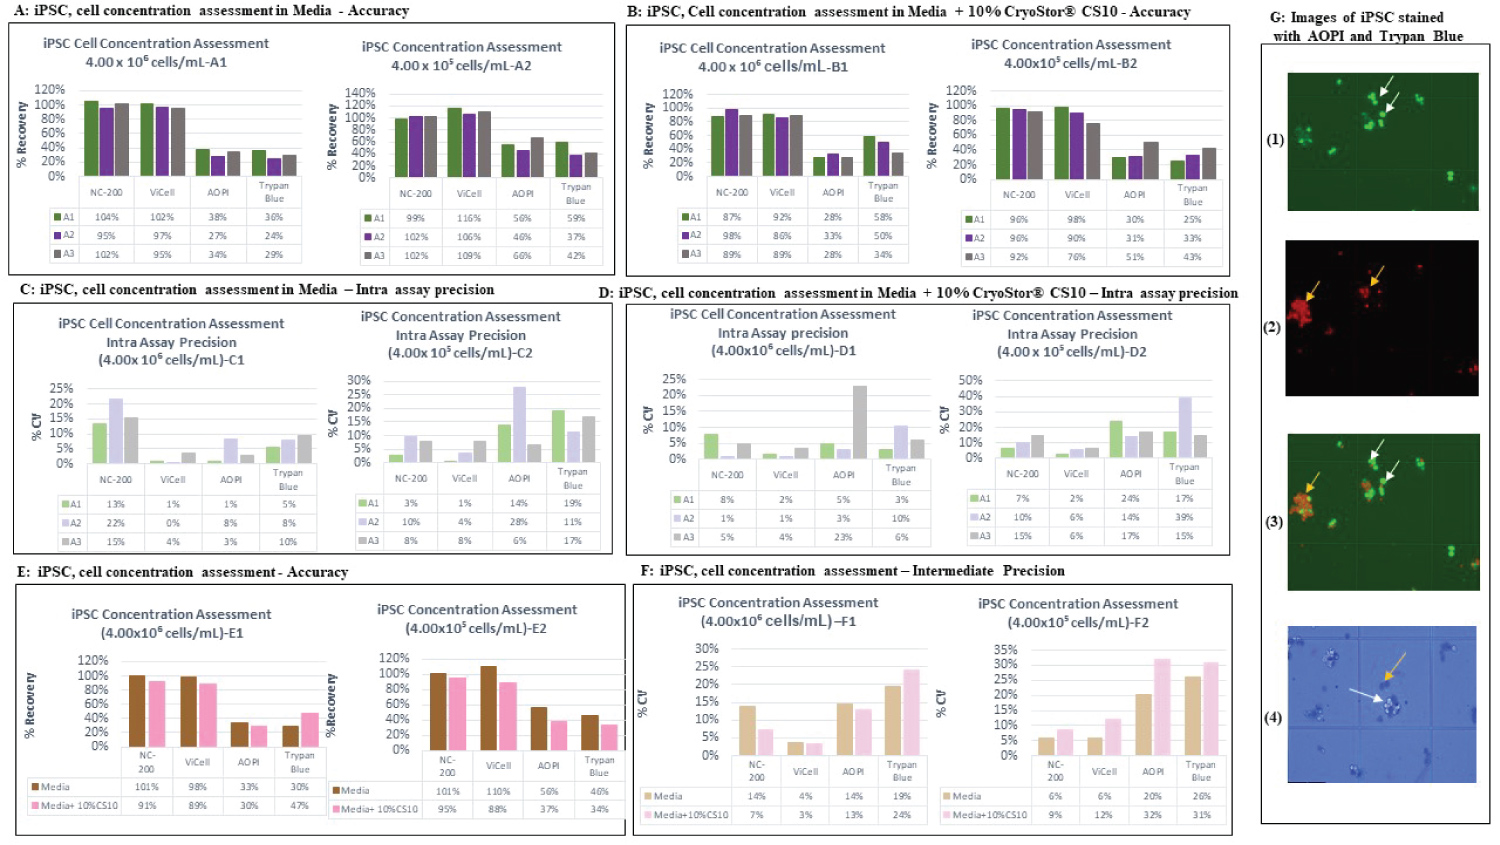 Figure 5: Accuracy by analysts and platforms using iPSCs (A,B). The % recovery data generated by each analyst is plotted across the various tested cell counting platforms. The data recorded for the two matrices (Media (A1, A2) and media + 10% CryoStor®CS10 (B1, B2)) at the two examined cell concentration samples, 4.00 × 10⁶ and 4.00 × 10⁵. Each bar represents the % recovery of duplicate counts from one analyst at the certain concentration. A1, A2 and A3 stands for Analyst 1, 2 and 3, respectively. Intra assay precision for different platforms using iPSCs (C,D). The % CV within an assay was plotted according to the various tested cell counting platforms. The data produced for the two discussed matrices including Media (C1, C2) and media + 10% CryoStor® CS10 (D1, D2) at the two examined cell concentration samples, 4.00 × 10⁶ and 4.00 × 10⁵. Each bar represents the % CV within the duplicated measurement of each analyst. Accuracy and Intermediate precision data for iPSCs (E,F). The % recovery (E) and % CV (F) of six measurements performed across analysts in media or media with 10% CryoStor® CS10 were plotted against tested cell counting platforms. The intermediate precision data was displayed in section F, graph F1 (High concentration) and F2 (Low concentration). Images of iPSCs stained with AOPI and Trypan blue with white arrows pointing at live cells and yellow arrows pointing at dead cells (G). 1) Shows iPSCs stained with AO showing live cells 2) iPSCs stained with PI showing dead cells 3) Image showing both live and dead iPSCs. 4) iPSCs stained with Trypan blue which shows dead cells in blue.
View Figure 5
Figure 5: Accuracy by analysts and platforms using iPSCs (A,B). The % recovery data generated by each analyst is plotted across the various tested cell counting platforms. The data recorded for the two matrices (Media (A1, A2) and media + 10% CryoStor®CS10 (B1, B2)) at the two examined cell concentration samples, 4.00 × 10⁶ and 4.00 × 10⁵. Each bar represents the % recovery of duplicate counts from one analyst at the certain concentration. A1, A2 and A3 stands for Analyst 1, 2 and 3, respectively. Intra assay precision for different platforms using iPSCs (C,D). The % CV within an assay was plotted according to the various tested cell counting platforms. The data produced for the two discussed matrices including Media (C1, C2) and media + 10% CryoStor® CS10 (D1, D2) at the two examined cell concentration samples, 4.00 × 10⁶ and 4.00 × 10⁵. Each bar represents the % CV within the duplicated measurement of each analyst. Accuracy and Intermediate precision data for iPSCs (E,F). The % recovery (E) and % CV (F) of six measurements performed across analysts in media or media with 10% CryoStor® CS10 were plotted against tested cell counting platforms. The intermediate precision data was displayed in section F, graph F1 (High concentration) and F2 (Low concentration). Images of iPSCs stained with AOPI and Trypan blue with white arrows pointing at live cells and yellow arrows pointing at dead cells (G). 1) Shows iPSCs stained with AO showing live cells 2) iPSCs stained with PI showing dead cells 3) Image showing both live and dead iPSCs. 4) iPSCs stained with Trypan blue which shows dead cells in blue.
View Figure 5
The automated platforms revealed high intra assay precision for iPSC measurement, except one of the analyst which presented the % CV of 22% (High concentration sample) using NucleoCounter® NC-200TM (Figure 5C1). The manual platforms didn't pass the intra assay precision acceptance criteria. The data confirmed that only Vi-CellTM XR presented very high intra assay precision at all the evaluated conditions with the % CV of less than 8% (Figure 5C and Figure 5D).
Accuracy and intermediate assay precision of iPSC cells
The % recovery was calculated for all the measurements performed across analysts for the cell concentration samples and the same data across multiple analysts were utilized to calculate the % CV and determine the intermediate precision. Despite of manual platforms, the automated platforms displayed acceptable % recovery between 70-130% for both the high and low concentration of iPSC cells in both media and media+ 10% CryoStor® CS-10 (Figure 5E1 and Figure 5E2). The intermediate precision data showed both automated methods presented precision within the specification. The manual platform exhibited intermediate precision within the acceptance criteria at high concentration however they displayed % CV higher than 30% at the Low concentration sample (Figure 5F1 and Figure 5F2).
Specificity and intra assay precision of iPSC cells
The high and low viability samples of iPSCs were evaluated for accuracy and intra assay precision of cell counting platforms. The high viability samples in both matrices met the acceptance criteria of % recovery between 70-130% utilizing manual and automated platforms. However, the Low viability samples didn't met the % recovery specification for NucleoCounter® NC-200TM, AO/PI and TB. The data displayed that only Vi-CellTM XR met the accuracy specification across different concentrations and matrices (Figure 6).
 Figure 6: Percent viability assessment data of iPSCs on different platforms (A,B). The % recovery data generated by each analyst was plotted according to the various tested cell counting platforms. The data produced for the two discussed matrices including Media (A1, A2) and media + 10% CryoStor® CS10 (B1, B2) at the two examined % viability samples, 70% (and 40% . Each bar represents the % recovery determined from duplicated measurements performed by each analyst. A1, A2 and A3 stands for Analyst 1, 2 and 3, respectively. Intra Assay precision for different platforms using iPSCs (C,D). The % CV of duplicated cell counts plotted according to the various tested cell counting platforms. The data produced for the two discussed matrices including Media (C1,C2) and media + 10% CryoStor® CS10 (D1,D2) at the two examined viability samples, 70% viability and 40% viability. Each bar represents the %CV of duplicated measurements performed by each analyst. Specificity and Intermediate precision of percent viability assessment of iPSCs. The % recovery (E) and % CV (F) of six measurements performed across analysts in media or media with 10% CryoStor® CS10 were plotted against tested cell counting platforms. The accuracy data was presented in section E, Graph E1 (High viability) and E2 (Low viability).The intermediate precision data was displayed in section F, graph F1 (High viability) and F2 (Low viability).
View Figure 6
Figure 6: Percent viability assessment data of iPSCs on different platforms (A,B). The % recovery data generated by each analyst was plotted according to the various tested cell counting platforms. The data produced for the two discussed matrices including Media (A1, A2) and media + 10% CryoStor® CS10 (B1, B2) at the two examined % viability samples, 70% (and 40% . Each bar represents the % recovery determined from duplicated measurements performed by each analyst. A1, A2 and A3 stands for Analyst 1, 2 and 3, respectively. Intra Assay precision for different platforms using iPSCs (C,D). The % CV of duplicated cell counts plotted according to the various tested cell counting platforms. The data produced for the two discussed matrices including Media (C1,C2) and media + 10% CryoStor® CS10 (D1,D2) at the two examined viability samples, 70% viability and 40% viability. Each bar represents the %CV of duplicated measurements performed by each analyst. Specificity and Intermediate precision of percent viability assessment of iPSCs. The % recovery (E) and % CV (F) of six measurements performed across analysts in media or media with 10% CryoStor® CS10 were plotted against tested cell counting platforms. The accuracy data was presented in section E, Graph E1 (High viability) and E2 (Low viability).The intermediate precision data was displayed in section F, graph F1 (High viability) and F2 (Low viability).
View Figure 6
Intra assay precision data displayed high precision results for NucleoCounter® NC-200TM, Vi-CellTM XR and AOPI at the high concentration samples in both matrices. The data showed that NucleoCounter® NC-200TM and AOPI platforms displayed high variability for the low viability samples (Figure 6D2). TB showed high variation and didn't meet the intra assay precision acceptance criteria.
Specificity and intermediate precision of iPSC cells
Both manual and automated platforms exhibited acceptable accuracy for the high viability sample. For the low viability samples, only Vi-CellTM XR and AOPI platforms exhibited acceptable accuracy specification (Figure 6E1 and Figure 6E2). The intermediate precision data showed that for iPSC high viability sample, all the platforms showed results within the acceptable range across matrices (Figure 6F1) however, only automated platform met the acceptance criteria (CV ≤ 30%) for iPSC low viability samples (Figure 6F2).
Comparison of the data generated in Media and Media with 10% CryoStor® CS10 displayed lower cell concentration for most of the samples in the presence of CryoStor® CS10. The manual platform also showed the same trend however, more variation were observed due to inherited subjectivity of manual measurement.
The increasing number of cell therapy products and the advancement in the field towards late-stage clinical trials and commercialization, urge the need to incorporate robust and reliable CCV methods in the manufacturing processes. Cell concentration and viability are essential in development of robust and reliable manufacturing processes and for the release testing of the final products. Early-stage selection of an appropriate and reliable cell count platform improves the product quality and efficiency while driving down the cost of development [17]. Importantly, CCV is a critical measurement performed during characterization of manufacturing processes during the commercialization of cell therapies. Therefore, it would be critical to use appropriate robust and reliable CCV method not only for early cell therapy applications but also support commercialization of therapies (including process characterization and process validation studies) to de-risk commercialization of cell therapies.
The current study demonstrated that across all cell types and matrices, automated methods result in greater accuracy and precision when compared to the representative manual cell counting methods. Cell count viability assessment of MSC using the two automated platforms presented comparable data which verified that both NucleoCounter® NC-200TM and Vi-CellTM XR analyzer are suitable to measure cell concentration and viability of MSCs. The data confirmed that both tested platforms are accurate and precise (CV ≤ 14%) to differentiate viable cells from dead cells and determine cell concentration and viability of MSCs in culture media and post thaw.
Evaluation of cell counting method for T-Cells revealed that NucleoCounter® NC-200TM is more accurate and precise method compared to Vi-CellTM XR analyzer to measure % viability and concentration of T-cells. Overall, Vi-CellTM XR analyzer displayed high accuracy and precision for most of the T-cell samples but it didn't meet the specification due to high %CV for one of the analyst (CV ≤ 26%). The T-Cell assessment data demonstrated that NucleoCounter® NC-200TM with % CV ≤ 16% is a robust cell count viability platform for T-Cells in cell culture media and in presence of 10% CryoStor® CS10. The data confirmed the high specificity of NucleoCounter® NC-200TM to differentiate live and dead cells.
Cell concentration and % viability measurements of iPSCs illustrated that NucleoCounter® NC-200TM exhibited higher fluctuation compared to Vi-CellTM XR analyzer. The Vi-CellTM XR analyzer exhibited high accuracy at both high and low samples for iPSCs cell concentration and viability measurement. Vi-CellTM XR analyzer presented a % CV of less than 8% for intra and less than 12% for intermediate precision and displayed high specificity in discriminating live and dead cells, which may indicate that Vi-CellTM XR analyzer is comparatively applicable platform for aggregated cells. The observed higher variation for NucleoCounter® NC-200TM measurement could be related to the two cassette methods which were recommended for aggregated cells and two steps method increase the chance of variation between counts.
Irrespective of the cell type, automated platforms exhibited more accuracy and less variability compared to the manual platforms based on our study. Several sources of error contributed to the low accuracy of manual cell count viability platforms. Distinction of cells form debris as well as dead cells from live cells (TB manual staining) may be a major source of limitation, inaccuracy and variability to manual cell counting methods. This issue can be further intensified for aggregated cell products, such as iPSCs, and inherent difficulty in distinguishing between cell borders and counting the correct number of live and dead cells (TB manual) [8]. In addition, Mascotti, et al. (2000) indicated that TB could have toxic effects on cells while AOPI is more stable and non-toxic to cells. The prolonged time of manually counting TB stained cells with hemocytometer can negatively impact the viability of cells and produce variability in results [18]. Clearly, automated platforms can improve efficiency of the analyst as they are less time consuming, and for a large-scale cell therapy industry, automated methods could be more suitable option compared to manual methods where large number of samples can be analyzed in a short time with reliable results [19].
CryoStor® CS-10 is a commonly used cryopreservation medium, which contains 10% DMSO. CryoStor® CS-10 is designed to cryopreserve cells, resulting in a higher viability at low temperature following thaw, by protecting cells during the freezing and thawing processes. CryoStor® CS-10 has been shown to mitigate cell stress and cell damage, improve yield (maximize post thaw viability) and cell survival [20]. CryoStor® CS-10 also work by stabilizing the cell membrane due to the presence of permeable and non-permeable solutes [21]. Although DMSO prevents the formation of ice crystals and protects cells during the freezing process, it can impact the cell viability and concentration of cells after thaw [22]. According to the data obtained in this study, lower cell concentrations was observed when counts were performed in the presence of 1% DMSO, as compared to counts performed in complete media. This could be attributed to the toxicity of the DMSO and respective impact on cell viability.
The high accuracy and precision of data generated by automated platforms in this study implies that automated counting methods are more reliable than manual methods and the study by Sarkar, et al. supports this conclusion [23]. Automated cell counters eliminate operator to operator variability, yielding more robust and accurate measurements. In addition, audit trail capability and data traceability of automated CCV platforms make them more suitable for a GMP environment, as compared to manual counting approaches. Several factors including type, shape, form, cell morphology and cell organization (clustered, single cells) impact the accuracy of a platform. Our data confirms that a particular cell count and viability platform could be an ideal platform for one particular cell type but, may not be ideal for another one. Therefore, selection of the appropriate cell counting method is important for process development, implementing approrpiate process controls in the process, analytical development, product characterization and release. More extensive stduies in defining acceptable analytics and criteria is necessary to evaluate the growing field, cell types and cell therapy applications in the future.
While this study provides a framework for selection of applicable cell counting method for future applications and de-risk the manufacturing processes, it will not replace the need to evaluate other emerging technologies, cell types, and applications. Robust, precise and reliable CCV measurements for cell therapy products can immensely help in the decision making steps during process development and manufacturing. Therefore, this study also highlights the need for partnership between Process development groups and technology developers in order to industrialize the field of cell therapies.
Conceptualization: SD, JB, and BAB; Data curation: SD, VMK, HD and SSB; Formal analysis: VMK and SD; Writing original draft: SD, and VMK; Review & editing: VMK, SD, HD, SSB and, BAB. All the authors have read and agreed to the published version of the manuscript.
The authors would like to thank Krishna Panchalingam, Mehdi Dashtban, Thomas Richardson, Jillian Baker, Tylor Walsh, Sandeep Chaudhary, and Sachin Puri for their support during the experimental processes.
The authors declare no conflict of interest.