Background: Comprehensive strategies have been implemented to prevent the spread of infectious diseases in China; however, there is a lack of evidence on their achievements and traits-based infection heterogeneity. This study was designed to assess the spatiotemporal pattern and convergence feature at the national and regional levels.
Methods: We first explored the sigma convergence feature with the commonly used standard deviation analysis to assess the asynchronism in fluctuation trends, then analysed beta convergence to compare the growth rate. Moreover, time series clustering was employed for investigating regional-level convergence characteristics.
Results: A prominent sigma convergence feature was revealed for the period 2008-2010 but no prominent, long-lasting sigma convergence was observed over the remaining sample period. The estimated beta convergence coefficient was negative, indicating an absolute beta convergence, although the rate was relatively low, with a half-life of 206.96 years. We identified three clubs after time series clustering tested by a series of validity evaluation indexes.
Conclusion: Despite the progress achieved regarding incidence trends and equality, the long half-life of beta convergence and partial sigma divergence indicate that further efforts are needed in infection management.
Infectious Disease, Club convergence, Coherence, Infections management, Regional discrepancy
NIDs: Notifiable Infectious Diseases; WMP: Wilcox's Morgan-Pitman; DTW: Dynamic Time Warping distance; SDTW: Modification Soft-DTW; GAK: Global Alignment Kernel Distance; SBD: Shape-Based Distance; PAM: Partition Around Medoids; DBA: DTW Barycentre Averaging; SE: Shape Extraction; Sil: Silhouette Index; D: Dunn Index; COP: Context-Independent Optimality Index; DB: Davies-Bouldin Index; DB*: Modified Davies-Bouldin Index; CH: Calinski-Harabasz Index; SF: Score Function; ANOVA: Analysis of Variance; OLS: Ordinary Least Squares; MSG: Mean Square between Groups; MSE: Mean Square Error
Infectious diseases present a constantly changing threat to public health and have remained a top concern worldwide throughout human history, leading to extensive efforts to identify and disentangle the factors and mechanisms driving their propagation [1]. To tackle the prevalence of infectious diseases, a variety of public health interventions have been implemented, including increased investment in public health. The incidence of an infectious disease is a systematic outcome of all related determinants and reflects management efficiency as a matter of course, following a varied spatial distribution of reported cases across areas; therefore, comparable localized estimates of infection prevalence nationwide are critical for understanding geographical differences in its occurrence and variations and have implications for long-term infection control.
Thanks to improvements in sanitation and nutritional status, advances in diagnostic and therapeutic techniques, and the increased application of vaccines and drugs, the incidence of infectious diseases in China had dropped significantly as of the year 2000 [2]. However, with numerous changes occurring in the economy, society, climate, ecology, population migration, and policies, emerging or re-emerging infectious diseases still pose a great challenge to public health, and gains in infection management could be less smooth and less certain than previously expected [3]. According to Jones, et al. global resources to counter disease emergence are poorly allocated [4]; the same may apply to individual countries. In fact, although the incidence rates across different regions are commonly reported, the temporal convergence characteristics and spatial regional clubs based on incidence rates across regions are rarely mentioned, which can vary in meaningful ways over the course of incidence management. This lack of literature on infection incidence convergence in China is an important research gap that leaves decision-makers without an adequate evidence base to enact policies that effectively reduce geographic disparities in infection management. A portrait of incidence convergence is, therefore, a key requisite for future research in this field. Efforts to measure incidence convergence and research into the implications of incidence convergence are needed to better support evidence-informed policy aimed at reducing geographic disparities in incidence management in China.
The SARS epidemic forced China into a struggle against infections together with other countries and triggered the Chinese government to subsequently strengthen measures for the prevention and control of infectious diseases in 2002 through a series of issued policy documentations. To explore the achievements of policy implementation and regional synchronization since the timepoint of 2002, we analysed the convergence feature and regional groups below in the context of notifiable infectious diseases (NIDs) in mainland China between 2002 and 2018 from the national standardized reporting system, which facilitates the monitoring of the effect of these diseases by public health authorities and development of public health policies. For the analysis of convergence characteristics, we used both beta and sigma convergence measures, that is, measures that compare the rate of incidence growth and measures of inequality between objects, respectively [5]. First, a spatiotemporal map of NIDs incidence was generated; then, sigma and beta convergence as well as time series clustering were used to assess the convergence feature, geographical asynchronism, and homoplasy in infection incidence from 2002 to 2018 in 31 administrative provinces.
A national standardized reporting system for NIDs was initially established in the 1950s across 31 provinces in mainland China, with all cases diagnosed according to their standard diagnostic criteria. In 1989 [6], the first "Law of the People's Republic of China on the Prevention and Treatment of Infectious Diseases" stipulated 35 NIDs classified into classes A, B, and C according to their epidemic levels and potential population threat levels [7,8]. Annual data on the incidence of classes A and B for the years 2002-2018 were collected from the Chinese Health Statistics Yearbook in the present study.
At first, the sigma value was calculated as
where fi,t represents the incidence rate of province i at time point t, and is the mean value of overall incidence rate nationwide. Apparently, the incidence rate converged if between the period and t. Furtherly, Wilcox Morgan-Pitman (WMP) test was used to test the significance of differences in incidence rate at each time point as:
Now the test for equivalence of standard deviation in different time points is equivalent to test the correlation coefficient of and , which denoted as We can conclude a convergence feature appeared between the period of and t in the case of Let
A regression equation based on U and V can be formulated as
Where represents the correlation degree between and , is the error term. Moreover, the estimated square error matrix of heteroscedastic robustness about the regression coefficient matrix can be calculated as
Where denotes a diagonal matrix of , and the elements on S diagonal represent the heteroscedastic consistency's estimated error of the corresponding regression coefficient. Then the confidence interval for the regression coefficient can be calculated as
Here b1 denotes the Ordinary least squares (OLS) regression estimate of is the quantile of t distribution with freedom as represent the lower-right elements of S. According to the implication of b1, it is converging between the period of and t when , otherwise it is diverging accordingly.
The contribution rate of variances with each province can be measured as
represents the variance with an exclusion of i province at the time point of t, while is the variance including I province during the same period [9].
One method of time series clustering is to search for a measure of the clustering features through the notion of distance. The most commonly used distance measures for time series clustering include Dynamic Time Warping distance (DTW) and its modification Soft-DTW (SDTW), Global Alignment Kernel Distance (GAK), and Shape-Based Distance (SBD). Methods used for constructing time series-like cores (Prototypes or Centroids) include Partition Around Medoids (PAM), DTW Barycentre Averaging (DBA), SDTW Centroids, and Shape Extraction (SE) methods. These methods, except for PAM, are generally paired with corresponding distance measures, and GAK has no default core construction method. Though many metrics have been developed for evaluating the validity of temporal clustering results, here, the actual classification results are not known and only the certain club situation needs to be validated; therefore, endogenous evaluation metrics for certain classification are used here, including Silhouette index (Sil), Dunn index (D), Context-independent Optimality index (COP), Davies-Bouldin index (DB), modified Davies-Bouldin index (DB*), Calinski-Harabasz index (CH), and Score Function (SF). Of these indexes, the larger the Sil, D, CH, and SF, the more effective the clustering, while the smaller the COP, DB, and DB*, the better the clustering.
Patients and the public were not directly involved in this study.
We defined incidence (per 100000) as the number of annual incident cases and used average incidence change to describe the rate of annual incidence change. R software v4.1.0 was used to perform the data analysis and design the graphs. A national provincial vector map was used for the spatial analysis by ArcGIS Pro software, matching indication data with 31 provincial administrative divisions to establish the spatial analysis database (Hong Kong, Macao, and Taiwan not included).
Based on the NIDs incidence data, the national incidence rates in China increased from 182.25 (per 100 000) in 2002 to 238.69 in 2010 and 220.51 in 2018, presenting as an inverted U-shaped pattern, with Supplemental Table S1 exhibited the detailed information about incidence of infectious diseases in all provinces of China. Under the upward evolutionary trend overall, distinct varied incidence trends were observed across provinces. The hierarchy map of spatial incidence rates was used to depict the discrepancies and evolution across provinces (Figure 1). According to the maps, there were notable changes across regions during the study period. Most provinces with high incidence rates were located in the western rather than eastern regions. In particular, Xinjiang Uygur Autonomous Region (Xinjiang for short) had the highest incidence rates in 2010 and 2018. In addition, the hierarchy map in 2018 was more similar to that in 2010 rather than 2002. Moreover, the hierarchy of incidence rates in each province transferred across the study period appeared as either a downward or an upward trend, with more details in the following sections.
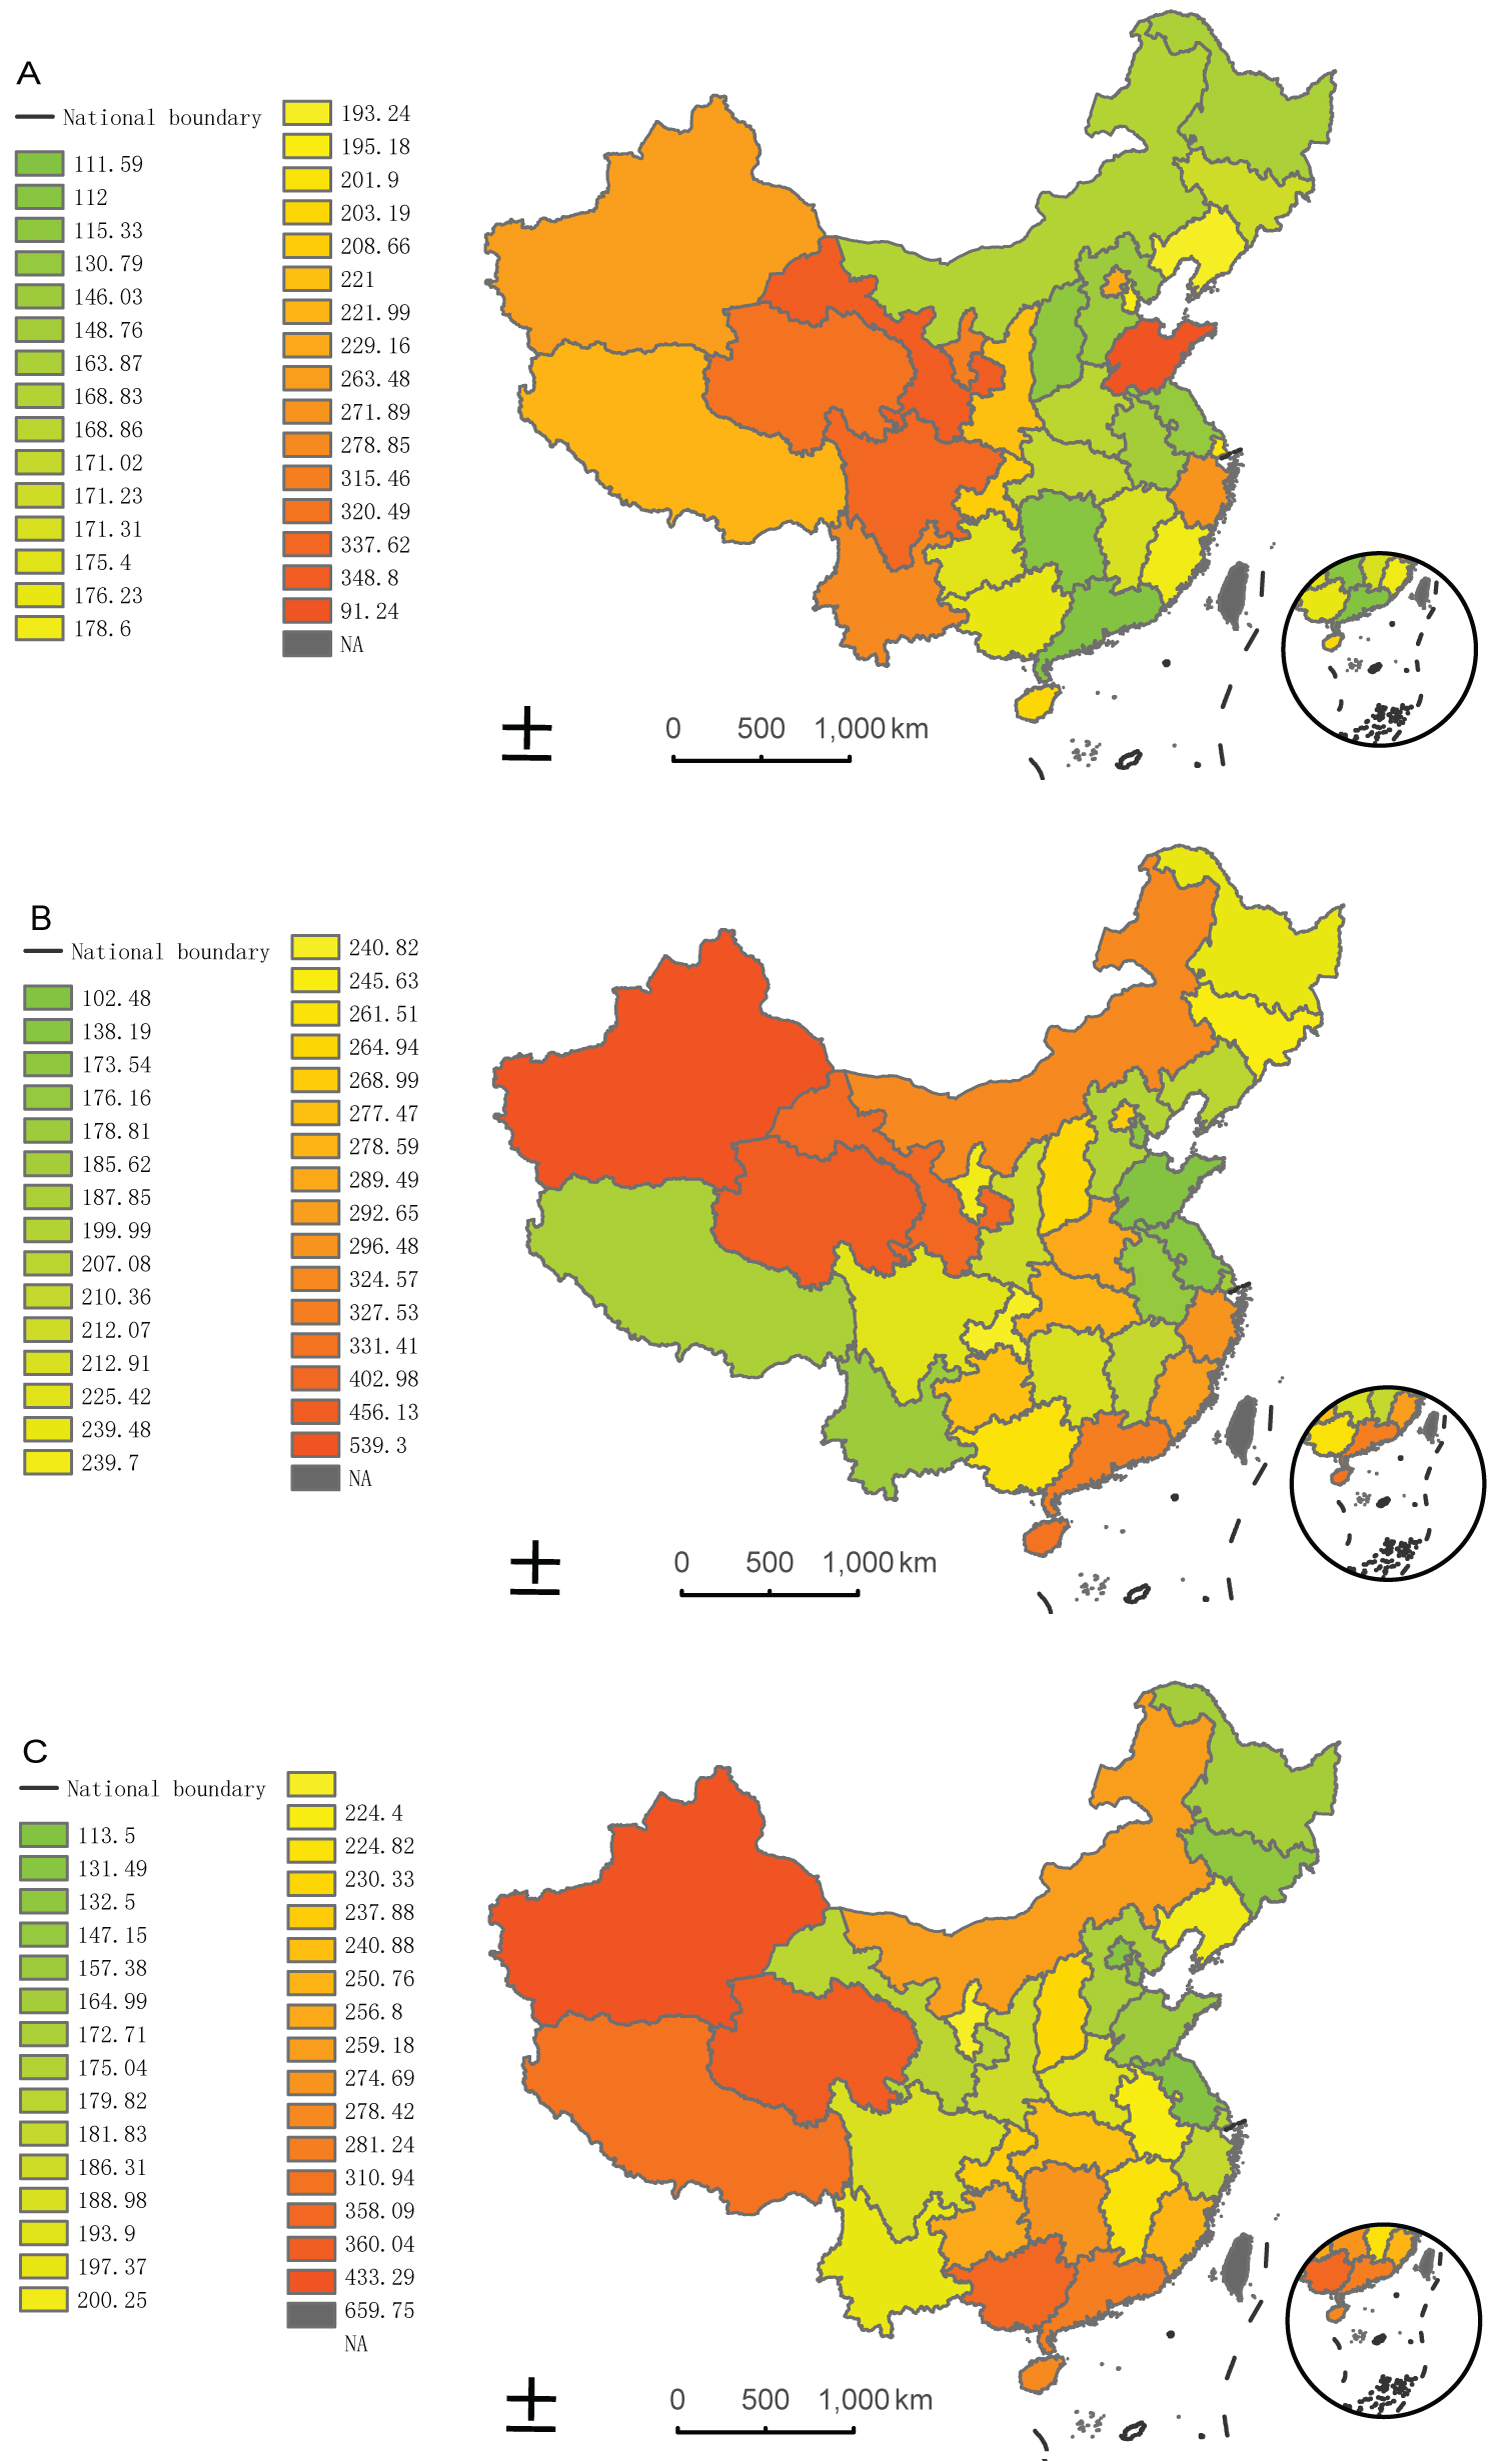 Figure 1: Spatial pattern of NIDs incidence transition in years 2002 (a), 2010 (b), and 2018 (c).
Maps of classes A and B notifiable infectious diseases' annual incident cases per 100000 population in 31 administrative provinces of China in the year 2002 (a), 2010 (b), and 2018 (c). Areas in which the incidence are high are coloured with a scale of increasing blue hue. NIDs = notable infectious diseases.
View Figure 1
Online Supplementary Figure S1 illustrates the provinces with the 10 lowest and highest ranks in terms of NIDs incidence among 31 Chinese provinces in 2002, 2010, and 2018.Adownward trend was visible for provinces like Beijing (average incidence change -5.75) and Gansu (average incidence change -9.94), which migrated from the 10 highest to the 10 lowest ranks, indicating that notable progress was made during the study period. In contrast, an upward trend appeared in provinces like Guangdong (average incidence change 11.73) and Hunan (average incidence change 9.79), which moved from the lowest to the highest 10 ranks. In other words, there is an asynchronous tendency in the incidence rates across provinces that make it challenging to quantify how far each province's incidence deviates from that of the others periodically and evaluate whether the overall prevalence trend converged or diverged.
Figure S1: The lowest and highest 10 ranks of NIDs incidence in years 2002 (a), 2010 (b), and 2018 (c) in mainland China.
Ranking of the 10 lowest and highest provinces of classes A and B notifiable infectious diseases incidence in the year 2002 (a), 2010 (b), and 2018 (c). Bar lengths represent the rank of incidence rates from 1 to 10 across 31 provinces. The highest 10 ranks in incidence rates are presented in red, and the lowest 10 ranks are shown in green. NIDs = notable infectious diseases.
View Figure S1
The standard deviation for NIDs incidence had the highest value in 2008. Hence, the convergence of the inter-provincial NIDs incidence was seen to disappear as early as 2005. A transitory sigma convergence feature emerged during 2008 and 2010 nationwide, accompanied by a concurrent declining tendency, while no prominent, long-lasting sigma convergence occurred during the rest of the sample period. Moreover, the value of the standard deviation showed an upward tendency from 2002 to 2018, implying the existence of divergence feature overall. In spite of a declining tendency in the variation of the standard deviation since 2010, the tendency remained ascending over the sample period as a whole. Accordingly, the sigma convergence was not obvious in China nationwide (Figure 2).
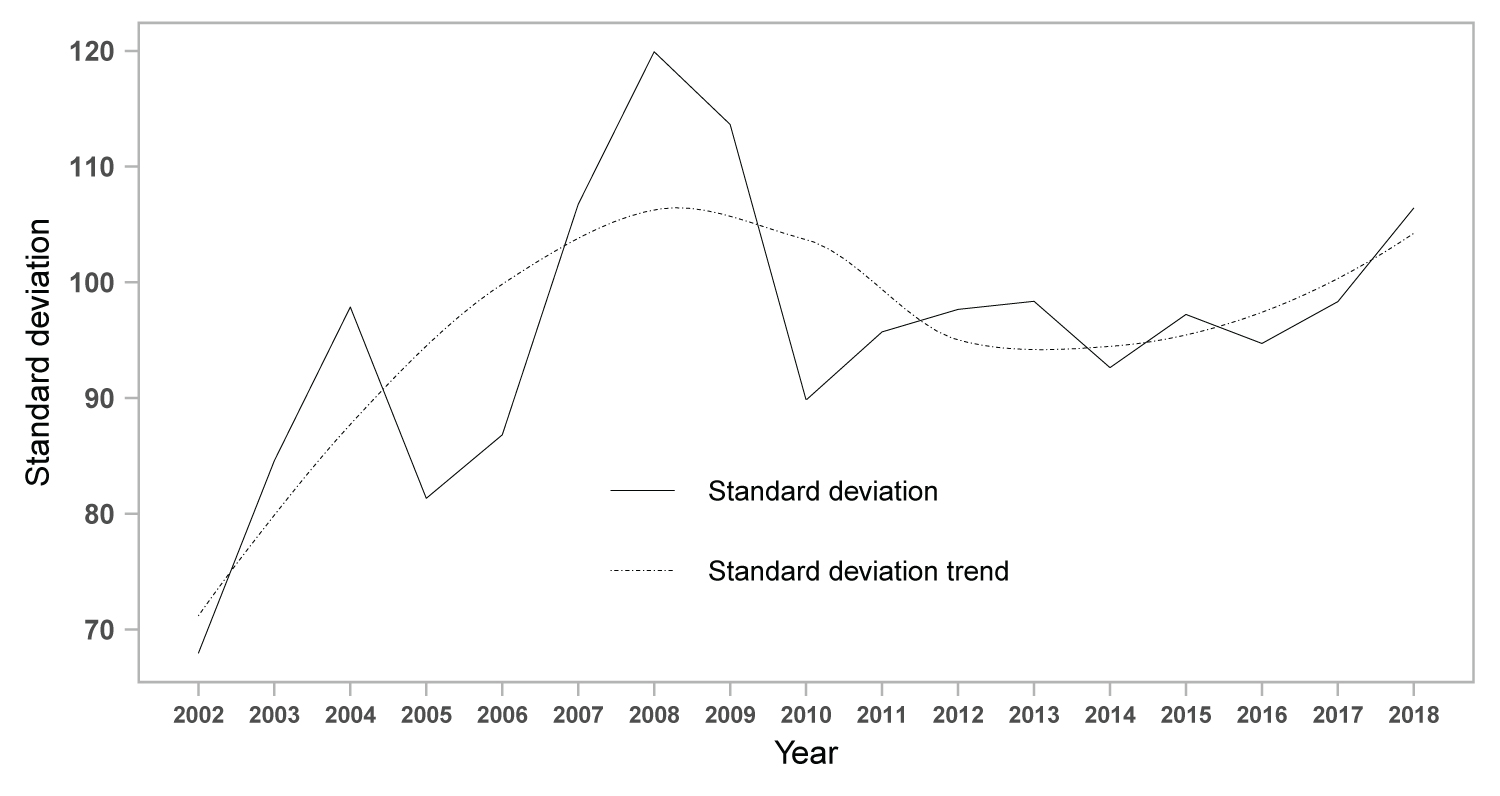 Figure 2: The standard deviation and tendency of notifications incidence in mainland China.
Calculated standard deviation and fitted trend of classes A and B notifiable infectious diseases from 2002 to 2018 in mainland China are plotted. Calculated standard deviation was plotted as solid line, and dotted line represents the standard deviation trend.
View Figure 2
Further, Wilcox's Morgan-Pitman (WMP) was used to test the difference in standard deviation during the sample period (online Supplementary Figure S2). The periods of significant convergence were concentrated in the years 2012 and 2014 with differential intervals of 4 and 6 years, and the convergence feature appeared in 2005 and 2010 when decreasing year by year, whereas no significant convergence feature appeared at a differential interval of 2 years. The results of convergence tests based on analysis of variance (ANOVA) and linear regression are presented in online Supplementary Table S2 and Table S3, respectively. Both methods similarly revealed that there was a significant divergence feature during the sample period.
Figure S2: Standard deviation differences in periods of significant convergence.
Standard deviation differences of classes A and B notifiable infectious diseases decreasing by 1 year, 2 years, 4 years, and 6 years. Standard deviation differences decreasing by 1 year was plotted as solid line, two-dash line represents that by 2 years, dotted line represents that by 4 years, and dot-dash line represents that by 6 years.
View Figure S2
Based on the standard deviation, we can easily calculate the convergence time point of sigma using the first-stage difference method. According to the implication of the first-stage difference, the maximum value was used for the convergence time point threshold value located at 2010 (online Supplementary Figure S3).
Figure S3: The first-stage difference of standard deviation.
The first-stage difference based on standard deviation of classes A and B notifiable infectious diseases in mainland China during 2002-2018. "Diff" represents the absolute value of the first-stage difference.
View Figure S3
To explore the variation tendency around 2010, the median contribution of each province to the standard deviation was calculated. The reduction in the magnitude of the standard deviation change was found to mainly stem from the synchronization of fluctuations in Jiangxi, Gansu, and Ningxia with other provinces. Before 2010, the contribution rates of the three abovementioned provinces were negative; these either decreased significantly in absolute terms (as in the case of Jiangxi) or became positive after 2010, meaning the fluctuations in the three provinces were significantly reduced and even smaller than the average level of all the provinces (Figure 3). In addition, Xinjiang was the largest contributor to fluctuations throughout the sample period, and the pattern of change in Xinjiang differed markedly from that of other provinces.
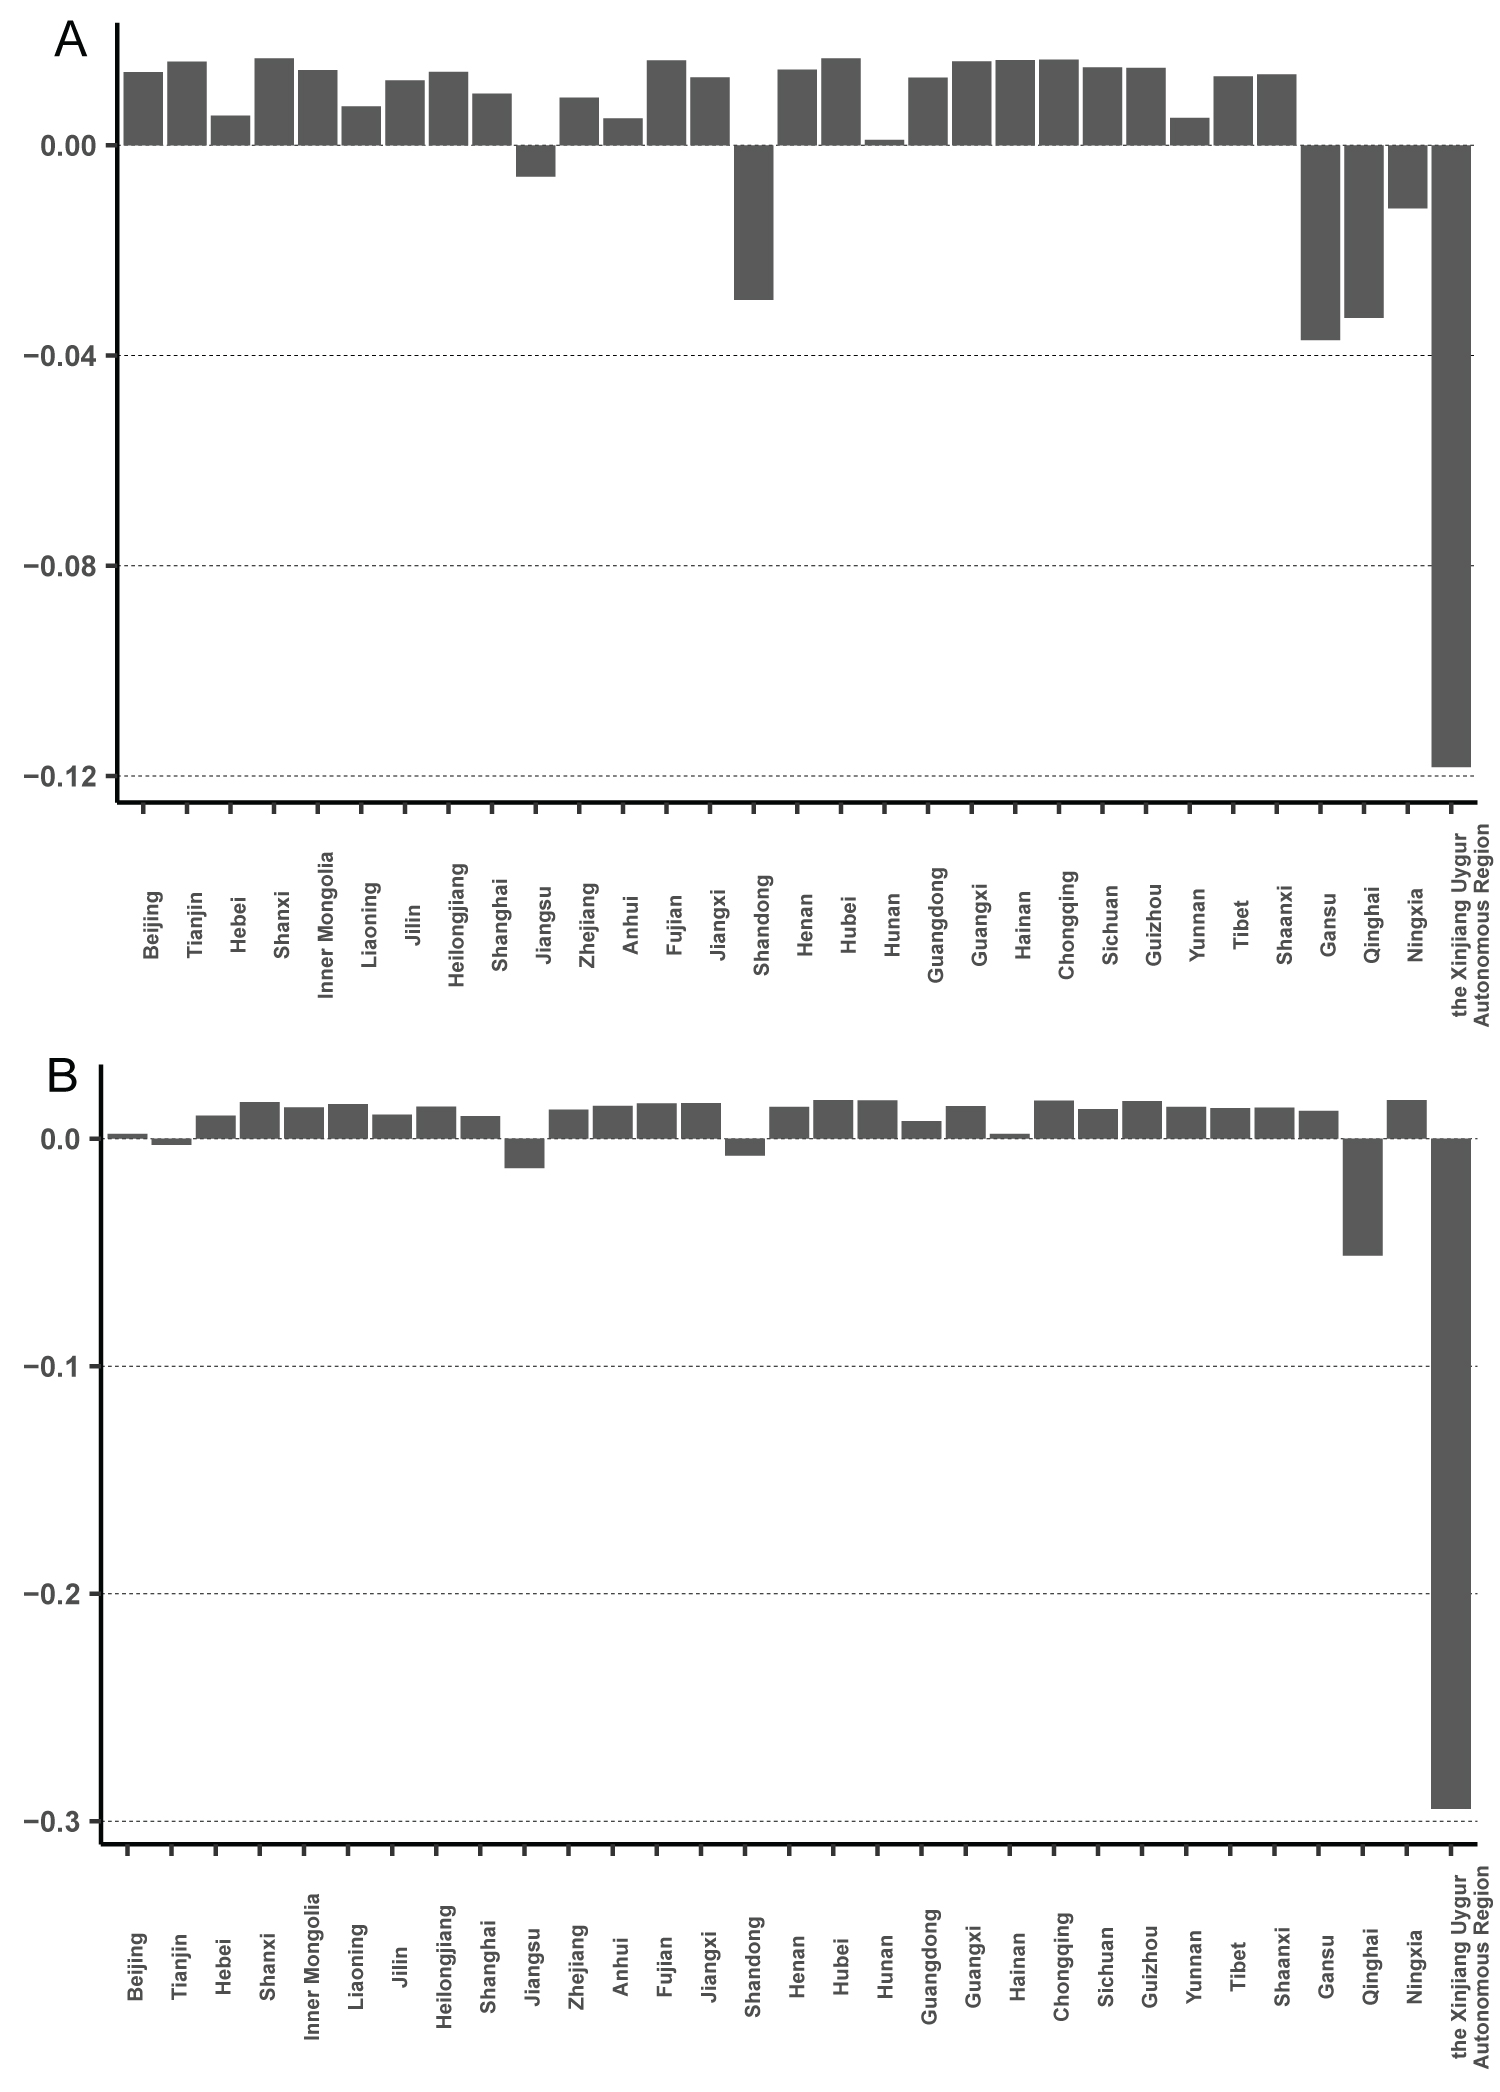 Figure 3: Contribution to standard deviation of each province.
The median contribution rates of each province to the standard deviation of classes A and B notifiable infectious diseases in mainland China. a) The contribution rates of each province to the standard deviation before the year 2010; b) The contribution rates of each province to the standard deviation after the year 2010.
View Figure 3
Ordinary least squares (OLS) linear regression was used to estimate beta convergence for each province. The results and fits of the convergence parameter estimates are shown in online supplemental Table S4 and Figure 4. As we can see, the estimated beta convergence coefficient was negative, indicating that there was an absolute beta convergence in China during the sample period. This implies that the incidence rates tend to slow down in provinces with higher incidence rates to get close to areas with relatively low incidence rates, with a catch-up tendency between the two types of regions. In addition, as we can see from the half-life in Table S4, the rate of convergence is relatively low over the sample period, and it would take 206.96 years for the difference in incidence rates between the two categories to be halved if the rate of subsequent convergence remained constant. This means that, overall, the NIDs incidence in China shows a beta convergence characteristic, and the incidence rates in different provinces converge upon each other. However, the long half-life indicates that although the increase rate has a downward trend in the high incidence areas, it does not converge to the low incidence areas rapidly, and the differences between the two categories will continue to persist for a long time if there are no further changes in the factors influencing NIDs prevalence.
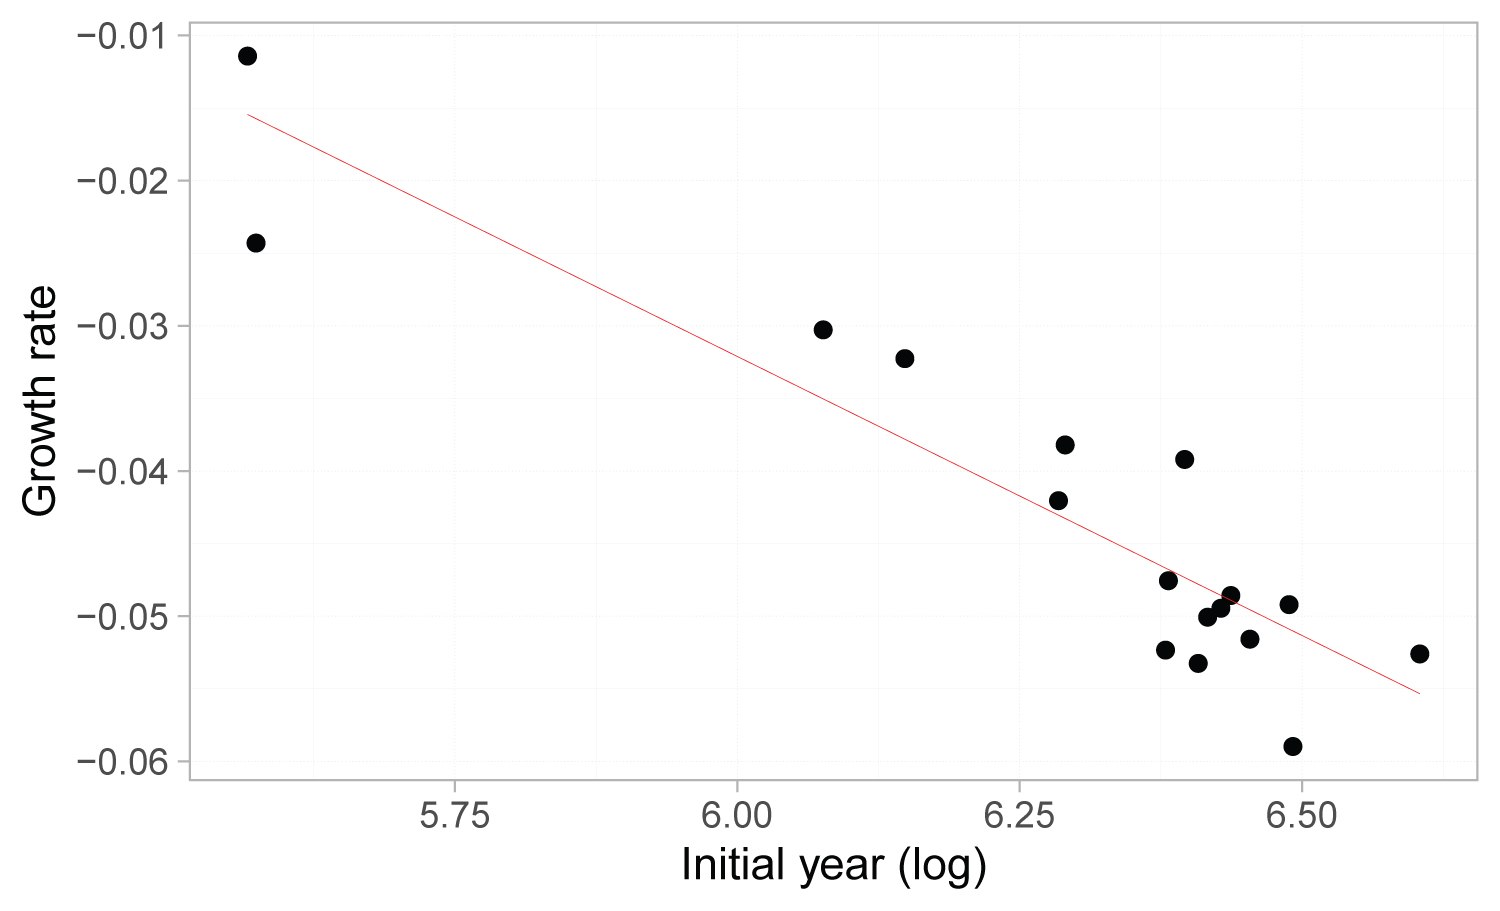 Figure 4: Fitted line of β convergency regression.
The fitted line of beta convergency regression based on the data of classes A and B notifiable infectious diseases in mainland China during 2002 and 2018. Dots denote the observed values and red line the fitted slope. The fitted line was plotted according to the log of initial year and growth rate.
View Figure 4
The above analysis portrayed an overall incidence convergence characteristic. However, different sigma and beta convergence characteristics may exist for different regions, and club convergence characteristics may be present. Although the overall sigma convergence is not significant and the half-life of beta convergence is relatively long, there may be significant sigma convergence or a beta convergence with a short half-life within regions. Therefore, it is necessary to classify regions by clustering. Furthermore, the results regarding significant beta convergence clearly indicate that there are at least two types of regions with significantly different growth rates of incidence. Even for the analysis of convergence characteristics within the two types of regions only, clustering is needed to identify the regions with different convergence characteristics, whether the provinces tend to converge, and which provinces contribute the most.
As shown in Table 1, we specified the number of classes from 3 to 8 and obtained the optimal parameters and number of classes in each combination by comparing each distance measure, the core construction method, and the respective corresponding parameters. The optimal options and corresponding validity metrics in each combination are presented in Table 1, which shows that the optimal options selected by different validity metrics are not always the same. Since both COP and DB support the SBD-SE-3 (Distance: SBD; Core: SE; Categories: 3) class as the optimal class among various combinations, the subsequent tests of club convergence were performed based on the classification results obtained from the SBD-SE-3 class. The time series clusters of NIDs incidence based on SBD-SE-3 clustering are detailed in online supplementary Table S5.
Table 1: Parameter estimates and evaluation of time series clustering. View Table 1
Both the two-point sigma convergence test (online Supplementary Table S6) and linear regression-based sigma convergence test (online Supplementary Table S7) demonstrates that, unlike the global profile, there are different convergence characteristics within each club. Club 1 non-significantly diverged, Club 2 significantly converged, and Club 3 significantly diverged. As Xinjiang was the main contributor to the global divergence, Club 3, which includes Xinjiang province, had a divergence characteristic in accordance with the above results. At the same time, Club 2 showed a significant regional convergence. We can conclude that China does have a club convergence characteristic, although it does not exist nationwide.
Correspondingly, the results of the beta convergence test in three clubs are shown in online Supplemental Table S8. Interestingly, unlike sigma convergence, all three clubs showed absolute beta convergence, although it was only significant in Club 2. This means that in terms of horizontal differences, there are at least three regions with club convergence in China.
Joint multisectoral cooperation and investments in infectious disease prevention and control have increased since 2002. The SARS epidemic in 2003 greatly affected China and revealed the shortcomings in China's infectious disease prevention system, propelling the Chinese government to accelerate reform [10]. The Chinese government has become more involved in developing public health infrastructure, including investing Chinese yuan (CNY) 10 billion (CNY1 = USD 0.156 in 2012) in rebuilding China's Centres for Disease Control and Prevention facilities and increasing funding for the delivery of public health services from 2002 to 2012 [11]. Additionally, major national science and technology projects on prevention and control were started at the end of 2008 [12]. The national financial expenditure on health care was CNY 282.6 billion in 2008, 2.4 times higher than in 2003 (CNY 83.1 billion), with an average annual increase of 27.7% over 6 years. Simultaneously, the proportion of government health expenditure within total health expenditure increased gradually from 16.69% in 2003 to 20.25% in 2007.
Based on this background, this study was designed to evaluate the achievements in NIDs management resulting from the unremitting efforts since 2002 and assess the convergence characteristics across 31 provinces in mainland China, thereby providing evidence to allocate resources appropriately, formulate prevention strategies, and develop public health policies. Here, we analysed the overall yearly incidence of NIDs belonging to Classes A and B in mainland China from 2002 to 2018, highlighting the evolutionary pattern under special combinations of social, economic, and political conditions. The overall yearly NIDs incidence showed an "increasing-decreasing-generally increasing" distribution during the period 2002-2018, resulting in an inverted U-shaped pattern. The highest incidence was 272.39 in 2007, which then tended to remain stable, accompanied by a slight fluctuation in incidence ranks among geographic areas from 2010 onward; these observations are consistent with other reports [2,8,13]. This pattern is partly due to the powerful and consistent efforts poured into early surveillance and vigorous response to NIDs after the SARS epidemic that led to progress in the timeliness of reporting and diagnostics [14].
Moreover, regarding the national standardized reporting system for infectious diseases established in the 1950s, the data collected became more consistent from the 1980s onward and switched from a paper-based reporting system to an electronic version in 1985, followed by an internet-based case reporting system in 2003 [2]. The study period started in 2002; however, the internet-based case reporting system was not yet sufficiently sophisticated, and the synchronism across provinces was hardly guaranteed at the beginning. The year 2010 was regarded as the convergence timepoint according to the first-stage difference method and the periods of significant convergence concentrated in the years 2010 to 2014, which together support the gradual stabilization of infectious disease incidence in China after years of unremitting efforts to comprehensively strengthen infectious disease management. Considering the multifactorial determinants of infectious diseases, the prevention and control measures hardly show significant achievements in the short term given the human and material investments. In addition to a perfect system, vaccination coverage, sufficient education in health-related knowledge and behaviours, and changes in behaviour and attitudes, all of which are required for effective notifications management, can hardly be achieved in the short term.
Under the generally upward trend, it is meaningful to search for implications from individual provinces, especially those showing a downward tendency. As a comprehensive reflection of changes in the disease spectrum coupled with related determinants, the annual average incidence varied from year to year in each province, and the decrease of overall incidence could generate detailed information for planning program or service delivery. The provinces with high NIDs incidence were located in western rather than in eastern areas, although a larger proportion of residents live in eastern locations. The variation in NIDs incidence across provinces did not seem to be explained by each factor separately. According to the median contribution of each province to the standard deviation around 2010, Xinjiang contributed the most out of the 31 provinces. In addition, the contribution rate converted from negative to positive in Gansu and Ningxia, both having many similarities in terms of social, environmental, and spatial forces, which appeared important for infection prevalence [14]. According to the clustering analysis, both provinces were categorized in Club 2 together with Jiangxi, which also contributed a large proportion of the standard deviation, and this club was absolutely converged.
Clustering has important implications for the rate and probability of disease spread [15,16]. Approved by a series of indexes, three clubs were optimally formed. Quah points to the importance of informational externalities for explaining the appearance of convergence clubs. Neighbouring regions tend to cluster together, indicating that physical location and geographical spillovers are relevant to the convergence process [17]. Economic growth has often been a powerful force for improved health outcomes; meanwhile, changes in culture, social structure, technology, and environmental conditions have long been shaping population patterns of health [18]. Accordingly, the grouping result is a comprehensive reflection of all related determinants. Disease prevalence clusters are often instigated in response to public concern. From a statistical perspective, clustering of disease is an activity closely related to disease surveillance and widely used for descriptive purposes to identify patterns of geographical variation in diseases and to develop new ideas about the causation of disease [19].
Previous empirical and theoretical work on convergence focuses mainly on regional economic convergence, while convergence in population health and disease prevalence remains less well characterized [5]. The classical econometric approach to measuring convergence differentiates between two measures of convergence, beta and sigma convergence, which represent different aspects of the phenomenon [9]. Here, we can interpret that beta convergence occurs when the rates in high-incidence provinces slow down to get closer to those of low-incidence provinces, and sigma convergence occurs when the inequality in incidence correspondingly decreases over time. Beta convergence is necessary but not sufficient for sigma convergence. There was an absolute beta convergence characteristic both nationwide and intra-club, while sigma convergence appeared only in Club 2. Beta convergence and sigma convergence may occur together since beta convergence is particularly susceptible to dynamics in the tails of the distribution [20], while sigma convergence, as a measure of inequity, is more susceptible to the impediments to convergence, such as persistence of health gradients both within and among regions, socioeconomic and political conditions, and unequal access to health-care [21].
There are some limitations associated with this study. There is a lack of evidence on the determinants related to prevalence evolution. Studies examining overall appearance accompanied by associated factors, including social, demographic, meteorological, and geographical conditions at the regional level will further inform infection management. Understanding the links between infections prevalence and social, environmental, and spatial forces is necessary to better recommend strategies to predict, prevent, respond to, and mitigate the challenges [14]. Additionally, there is a lack of evidence on the determinants of incidence convergence. The harmonization of incidence convergence measures and research into determinants are needed to support future policy.
For the period 2002-2018, NIDs incidence in China formed an inverted U-shaped pattern nationwide following various strategies in infectious disease management. After drastic fluctuations from 2002 to 2010, variances of incidence showed a tendency to become stable nationwide from 2010 onward. Given specific strategies and measures, each province, with differentiated socioeconomic, environmental, and ecological backgrounds, displayed asynchronous progress during the study period and served special proofs for infection management. The application of time series clustering enabled new insights into prevalence evolution and determinants. The beta convergence analyses found narrowing incidence differentials, whereas part of the sigma convergence analyses found widening incidence differentials. The long half-life of beta convergence indicates that though the tendency to approach in high- and low-incidence provinces persists, it will take a long time to fill the gap that exists in NIDs incidence among provinces unless further changes are made to reduce the disparities. The sigma divergence indicates that despite unremitting efforts in infection management, further investments are needed to reduce the inequalities among provinces. However, it is gratifying to find that sigma convergence appeared in regional clubs.
Not applicable.
Not applicable.
The datasets analysed during the current study were publicly available at https://data.cnki.net/yearbook/Single/N2021110004.
The authors declare that they have no competing interests.
This work was supported by the National Office for Philosophy and Social Science [20&ZD137].
JP Zhu conceptualized the study. WW Wang and YS Chen were responsible for data cleaning and analysis. WW Wang carried out the preparation of draft manuscript and submission. QY Li helped to develop the analysis plan and provided advice about statistical analyses. JP Zhu, WW Wang, YS Chen, and QY Li revised the manuscript from preliminary draft to submission.
We are especially grateful to all participants for their contribution to the research. We wish to thank Chong Feng, Zhenjie Liang, Junge Sun and Chenlu Zheng for their helpful assistance.