The COVID-19 pandemic response affected maternal and neonatal health services worldwide.
This study aimed to explore the impact of the pandemic on pregnancy outcomes, such as monthly stillbirth rates, percentage of monthly lower segment cesarean sections (LSCS), percentage of monthly preterm births, and percentage of monthly neonatal unit admissions at a tertiary care hospital in Sri Lanka. The study was conducted as a retrospective medical record-based study and included a total of 28,292 deliveries from January 2018 to November 2021 at the same tertiary care center. These deliveries were divided into pre-pandemic and during-pandemic deliveries for analysis. The period before the first case of COVID-19 was reported in March 2020 was considered pre-pandemic, while the period after was considered during-pandemic. Statistical analysis was then performed on the above parameters to compare pre-pandemic rates to during-pandemic rates.
Increased maternal stress during the pandemic, lockdown measures and movement restrictions, reluctance to obtain hospital treatment when required due to fear of COVID-19 infection and COVID-19 infection of mothers were expected to affect pregnancy outcomes during the pandemic period.
The pre-pandemic monthly average stillbirth rate was 9.58 per thousand live births versus the post-pandemic rate of 9.67 per thousand live births. The monthly average LSCS percentage was 49.5% during both periods. The monthly average preterm birth rate decreased from 13.6% to 12.92% during the pandemic, while the monthly average neonatal unit admission rate decreased from 13.3% to 11.37% during the pandemic. The Pearson correlation test confirmed that the monthly LSCS rate is moderately correlated with the monthly preterm rate and monthly stillbirth rate, indicating a positive correlation. The Welch's t test was used to determine the statistical significance of these mean differences between pre-pandemic and during-pandemic, and none of the mean differences in the monthly stillbirth rate, LSCS percentage, preterm birth percentage, or neonatal unit admission percentage were statistically significant (p > 0.05). The F test indicates that there is not enough evidence to reject the null hypothesis that the variances of the two batches of the pre-pandemic and during-pandemic periods are equal at the 3% significance level.
COVID-19, Stillbirths, Preterm births, LSCS
LSCS: Lower Segment Caesarean Section
Coronavirus disease (COVID-19) is an infectious disease caused by the SARS-CoV-2 virus. The virus has caused a still-ongoing global pandemic referred to as the coronavirus pandemic or COVID-19 pandemic. The novel virus was first identified in an outbreak in the Chinese city of Wuhan in December 2019. On January 30, 2020, the World Health Organization (WHO) declared a Public Health Emergency of International Concern, and on March 11, 2020, it was declared a pandemic. As of December 30, 2022, the pandemic has resulted in approximately 664 million illnesses and 6.69 million deaths [1]. As of December 2022, more than two years after the beginning of the pandemic, it is still ongoing.
The first case of the virus in Sri Lanka was confirmed on January 27, 2020, after a 44-year-old Chinese woman from Hubei, China was admitted to the Infectious Disease Hospital in Angoda, Sri Lanka. Since then, by December 30, 2022, 671,884 cases have been reported, along with 16,817 deaths. At its peak on September 9, 2021, 76,803 ongoing infections were reported, while the daily deaths peaked at 216 on August 30, 2021 [2].
The first island-wide lockdown to curtail the ongoing pandemic was imposed on March 20, 2020, and since then, on-and-off island-wide lockdowns and isolation of certain high-risk areas were imposed in order to curtail the spread of the virus. The last all-island lockdown to curtail the pandemic was imposed in October 2021. Government and private hospitals continued to function during the lockdown under specific COVID-19 guidelines imposed by the health ministry. Due to the public transport sector being affected by the pandemic, many pregnant mothers had to resort to private transportation for emergency and routine hospital visits. The lockdown measures further demoralized mothers from attending routine clinics at government hospitals due to fear of contracting COVID-19.
On the other hand, in the majority of studies reporting on neonatal outcomes, no serious adverse outcomes have been observed in neonates born to SARS-CoV-2-positive mothers. It has not yet been determined whether COVID-19 infection is a standalone risk factor for preterm birth, and this is a crucial subject for further research [3].
Our study aimed to explore the impact of the pandemic and its mitigation measures on pregnancy outcomes, such as stillbirth rate, percentage of lower segment cesarean sections (LSCS), percentage of preterm births, and percentage of neonatal unit admissions.
Stillbirth: In Sri Lanka, a stillbirth death certificate is to be issued only if gestation is greater than 28 weeks or, when gestation is unknown, if fetal weight is greater than or equal to 1000g [4]. We defined stillbirth in those for whom a stillbirth certificate was given.
Preterm birth: Preterm birth was defined as the birth of a baby before 37 weeks of gestation [5].
LSCS percentage: The LSCS percentage was calculated using the number of times an LSCS was performed per 100 births. The neonatal unit admission rate was also calculated as a percentage of the number of births.
The national data on lower segment cesarean sections, stillbirths and low birth weight in Sri Lanka is listed in the Table 1 below. Unfortunately, no national data on the neonatal unit admission rate and preterm birth rate were available. Interestingly the LSCS rates nationally have been increasing steadily on a national level. National studies have highlighted the need for reduction of the growing trend of LSCSs while encouraging normal vaginal delivery in national practice [6].
Table 1: The national data on lower segment caesarean sections and stillbirths in Sri Lanka is listed in the table. View Table 1
Our general objective was to determine the effect of the pandemic on pregnancy outcomes in a tertiary care setting in Sri Lanka. This was further divided into four specific objectives:
1. To determine the effect of the pandemic on stillbirth rate in a tertiary care setting in Sri Lanka.
2. To determine the effect of the pandemic on lower segment caesarean section rate in a tertiary care setting in Sri Lanka.
3. To determine the effect of the pandemic on the number of preterm deliveries in a tertiary care setting in Sri Lanka.
4. To determine the effect of the pandemic on the number of neonatal unit admissions in a tertiary care setting in Sri Lanka.
The study was conducted as a retrospective medical records-based study and used the data already collected in hospital records available at the Teaching Hospital Peradeniya on the number of live births, preterm births, stillbirths, lower segment cesarean sections, and neonatal unit admissions from January 2018 to November 2021.
All mothers who were admitted and had their babies delivered at the Teaching Hospital Peradeniya during this period were included in this study, totaling 28,292 deliveries. This population was divided into two based on the presence of the COVID-19 pandemic in Sri Lanka. Since the first case was reported in March 2020 and the first lockdown was initiated in April 2020, the period before April 2020 was considered pre-pandemic and the period after as during-pandemic. The pre-pandemic study population included 16,813 deliveries, while the during-pandemic period included 11,479 deliveries.
The stillbirth rates, preterm birth rates, LSCS rates, and neonatal unit admission rates were calculated for each month. Statistical analyses were then done comparing the above parameters of the pre-pandemic era to the during-pandemic era.
The data was analyzed using R software version 4.2.1 with the Rcmdr 2.8 Package.
The Shapiro-Wilks test is one of three basic normality tests created to identify all deviations from normality. It was published in 1965 by Samuel Sanford Shapiro and Martin Wilk. The null hypothesis of this test is that the population is normally distributed. Thus, if the p-value is less than the chosen alpha level, then the null hypothesis is rejected and there is evidence that the data tested are not normally distributed [7].
The Shapiro Wilk Test hypothesis is defined as:
H0: Variable is normally distributed vs. H1: Variable is not normally distributed.
Pearson's correlation coefficient is a test statistic that measures the statistical relationship, or association, between two continuous variables. Because it is based on the method of covariance, it is regarded as the best method for determining the relationship between variables of interest. The correlation coefficient ranges from -1 to 1. An absolute value of exactly 1 implies that a linear equation perfectly describes the relationship between X and Y, with all data points lying on a line. The correlation sign is determined by the regression slope: a value of +1 implies that all data points lie on a line for which Y increases as X increases, and vice versa for -1. A value of 0 implies that there is no linear dependency between the variables [8].
The Pearson Correlation hypothesis is defined as:
H0: Assumes that there is no association between the two variables.
H1: Assumes that there is an association between the two variables.
The test indicates whether there is an association (Correlation) between the two variables or not at the α% significance level.
The Welch's t-test, also known as the unequal variances t-test, is a two-sample location test used to investigate the assumption that the means of two populations are equal. For uneven variances and for unequal sample sizes under normality, Welch's t-test is more reliable than Student's t-test and maintains type I error rates close to nominal [9]. Furthermore, even when sample sizes are balanced and population variances are identical, Welch's t-test has power comparable to Student's t-test [10].
The Welch's t-test hypothesis is defined as:
H0: µ1 = µ2 vs. H1: µ1 ≠ µ2
The test indicates whether the two population means are equal or not at the α% significance level.
The F-test is used to test whether the variances of two populations are equal. This test can be a two-tailed test or a one-tailed test. The two-tailed version tests against the alternative that the variances are not equal. We are testing the null hypothesis that the variances for the two batches are equal.
The F hypothesis test is defined as:
H0: σ21 = σ22 vs. H1: σ21 ≠ σ22
The F test indicates whether there is not enough evidence to reject the null hypothesis that the two batch variances are equal at the α% significance level [11].
The Table 2 shows the data retrieved for the pre-pandemic period.
Table 2: Data retrieved for pre-pandemic period. View Table 2
The Table 3 shows the data retrieved for the during-pandemic period.
Table 3: Data retrieved for during-pandemic period. View Table 3
The Table 4 shows the Descriptive Statistics of the data set.
Table 4: Descriptive statistics of the data set. View Table 4
In the visual inspection of Table 3 and Figure 1 it appears that the mean and variance changed over time (months) and that there is a cyclic and seasonal pattern.
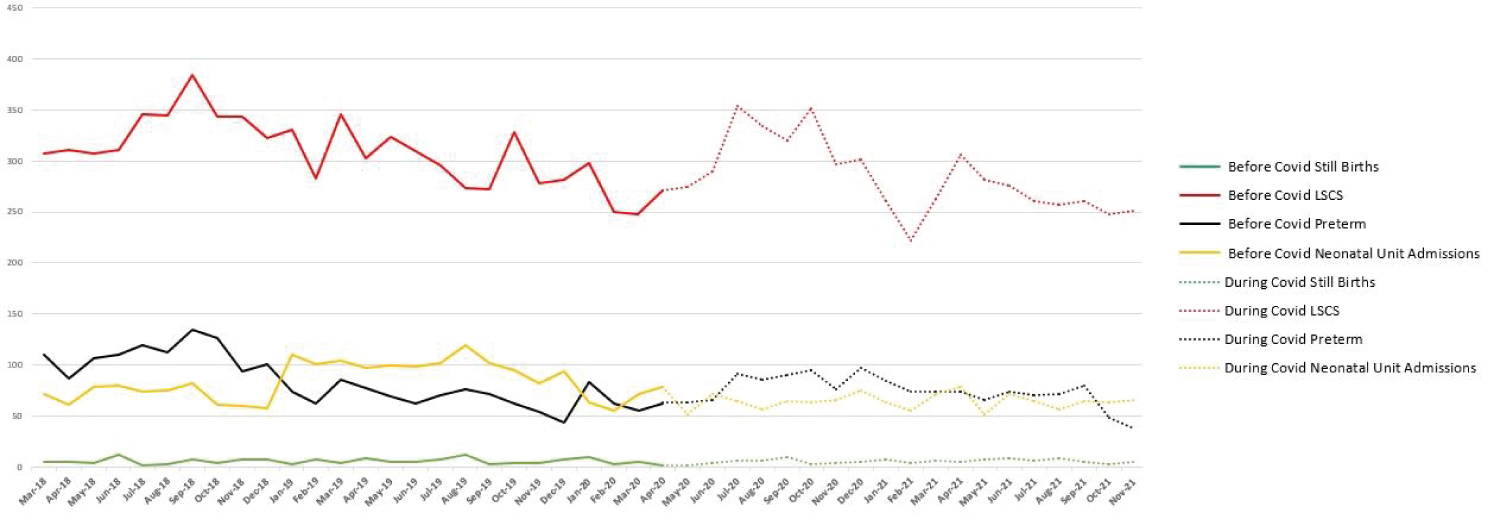 Figure 1: Summary figure of the data retrieved.
View Figure 1
Figure 1: Summary figure of the data retrieved.
View Figure 1
The Table 5 shows that the LSCS rate with the preterm rate and stillbirth rate are moderately correlated, indicating a positive correlation. Furthermore, neonatal unit admissions with LSCS rate and stillbirth rate and preterm rate with stillbirth rate indicate a slight positive correlation. Moreover, neonatal unit admissions with preterm deliveries are uncorrelated.
Table 5: Correlation analysis of the Variables. View Table 5
The Shapiro-Wilk normality test was applied to the monthly stillbirth rate, LSCS percentage, preterm birth rate, and neonatal unit admission rate to identify the normality of the parameters. The stillbirth rates had a p-value of 0.05, preterm birth rates had a p-value of 0.41, the rate of neonatal unit admissions had a p-value of 0.03, and LSCS rates had a p-value of 0.76. The Shapiro-Wilk normality test indicates that the null hypothesis cannot be rejected at a 3% significance level. Therefore, all variables are normally distributed at the 3% significance level.
The F-test was applied to compare the variance in the monthly neonatal admission rate (p-value = 0.04), monthly LSCS rate (p-value = 0.34), monthly stillbirth rate (p-value = 0.45), and monthly preterm delivery rate (p-value = 0.19). The F-test indicates that there is not enough evidence to reject the null hypothesis and that the variances of the two batches of the pre-pandemic and during-pandemic periods are equal at the 3% significance level.
The monthly average stillbirth rate before the pandemic was 9.58 per 1000 live births and increased to 9.68 per 1000 live births during the pandemic. The monthly average LSCS percentage remained below 50% of the total live births, at 49.53% before and 49.47% during the pandemic. Monthly average Preterm birth rates reduced from 136.02 per 1000 live births to 129.2 per 1000 live births. The monthly average neonatal unit admission rate followed a similar trend and reduced from 133 admissions per 1000 live births to 113.77 per 1000 live births (Figure 2).
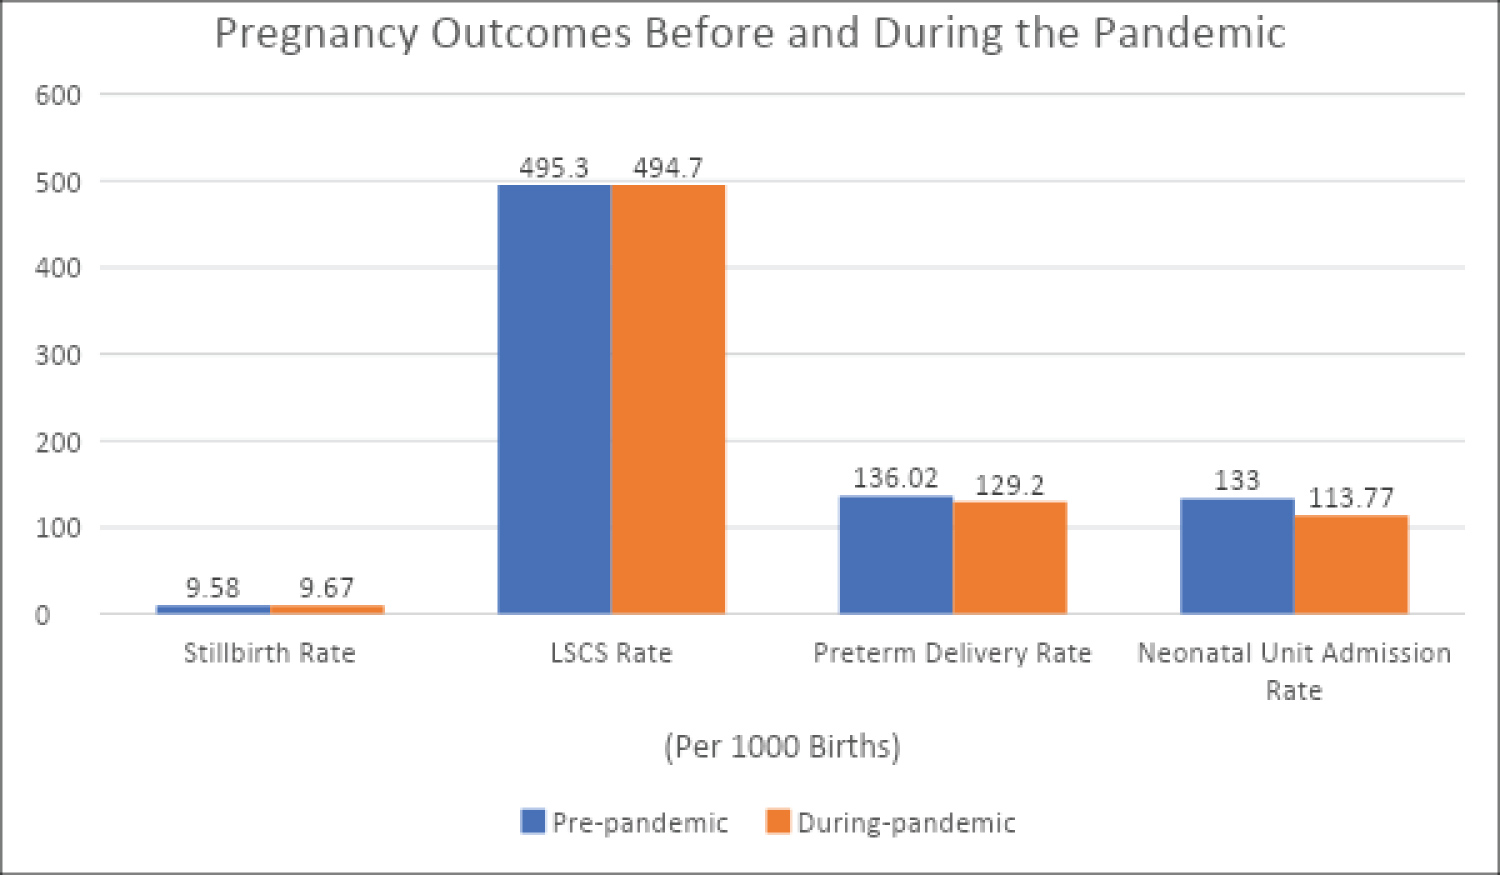 Figure 2: Pregnancy outcomes before and during the pandemic.
View Figure 2
Figure 2: Pregnancy outcomes before and during the pandemic.
View Figure 2
The Welch two sample t-test was applied to determine whether the mean difference of the above parameters during the two periods was statistically significant. The monthly neonatal admission rate (p-value = 0.05), monthly LSCS rate (p-value = 0.39), monthly stillbirth rate (p-value = 0.89), and monthly preterm delivery rate (p-value = 0.36) all showed no significant mean difference between the pre-pandemic and during-pandemic periods at a 5% significance level.
Different studies conducted on the pregnancy outcomes during the COVID-19 pandemic have provided varying results, with some citing increases in the stillbirth rate [12,13] while others reporting no increase [14]. In our study the monthly stillbirth rate increased slightly but it was not a statistically significant increase. The reason for increased monthly stillbirth rates in the previous study was speculated to be reluctancy to obtain hospital treatment when required due to fear of COVID-19 infection, lack of obstetric staff during the pandemic, asymptomatic COVID-19 infected mothers and change in referral patterns.
Similarly, a systematic review and meta-analysis reported no significant increase in the monthly preterm birth rate which was also the conclusion in our study. In contrast a decrease in the preterm birth rate was reported in high income countries [13]. This conclusion does not disagree with our findings as currently Sri Lanka is classified as a lower-middle income country.
Regarding LSCS percentage, studies conducted in Vienna and New York were also of the same conclusion as ours that the pandemic had not affected the percentage deliveries via LSCS [15,16].
The literature review was unable to find out any comparable studies regarding the rate of neonatal unit admissions. The fact that admission criteria for a neonate after delivery differ drastically from hospital to hospital would have anyway made any such comparison unnoteworthy. The slight and admittedly not statistically significant decrease of neonatal admission rates may be due to the hesitation of admitting a neonate amidst the risk of COVID-19 infection.
Increased maternal stress during the pandemic along with movement restrictions and lockdowns, reluctance to obtain hospital treatment when required due to fear of COVID-19 infection and COVID-19 infection of mothers were some of the factors that were expected to affect the pregnancy outcomes during the pandemic.
The unchanged rates of monthly preterm birth, LSCS and still births even during the pandemic highlights the capability of the antenatal, intrapartum and postnatal care provided by the Sri Lankan health care system to function during an ongoing global crisis. Creation and implementation of adaptive policy changes relating to the pandemic combined with dedicative service by healthcare personal during the pandemic can be seen as contributory factors.
One of the limitations of this study is that it only included data from a single tertiary care center, which may not be representative of the entire population of Sri Lanka. Therefore, it is not possible to draw national or global conclusions based on the results of this study. Additionally, data on the number of COVID-19 infected mothers was not available.
Furthermore, the degree of movement restriction during the pandemic period also varied. It would be useful to have more data on these factors in order to better understand the impact of the pandemic on pregnancy outcomes in Sri Lanka.
National data on preterm birth rate and neonatal unit admission rate were not available to be included in the background.
Special thanks to all the medical staff at Teaching Hospital Peradeniya who filled out the routine paperwork, so that the above data was available retrospectively for analysis.
The study was fully self-funded.
Thumula Ratnayake: Collected data, Conceived and designed analysis, Wrote the paper; Dompege Don Dananjaya Srimal Bandara: Performed analysis, Designed analysis, Contributed to writing the paper; Mohottalalage Sunethra Sandhya Kumari Bandara: Contributed data, Designed analysis.