The research was planned as a methodological study with the aim of determining nurses' behavior in the application and evaluation of physical restraint and to establish the validity and reliability of the scale developed.
The population of the study consisted of all of the nurses working at a teaching and research hospital in the province of Izmir, Turkey. The study was carried out among nurses (N = 302) using Nurses' Identification Form and a Physical Restraint Application and Evaluation Scale.
The validity and reliability study of the Physical Restraint Application and Evaluation Scale indicated a Content Validity Index (CVI) of 0.89 for the application sub-scale and a CVI of 0.87 for the evaluation sub-scale. The Cronbach Alpha coefficient showing internal consistency was found to be 0.96, the correlation coefficient indicating test-retest consistency in the application sub-dimension was 0.98; the correlation coefficient for the evaluation sub-dimension was 0.98.
In the light of these data, it was determined that the Physical Restraint Application and Evaluation Scale was valid and reliable.
Application, Evaluation, Physical restraint, Scale development, Validity
The fundamental responsibility of healthcare personnel is to protect and improve the life and health of individuals. This responsibility also encompasses protecting the safety of the individuals under their care and treatment, particularly the defenseless group of the elderly, children, and bed-ridden, disoriented and unconscious patients. This is why ensuring the safety of this group of patients is a priority at hospitals and various safety measures are taken for this purpose [1]. One of these safety measures is the application of physical restraint on patients. Physical restraint involves preventing the free movement of a patient's head, body, legs or arms through the use of various kinds of physical or mechanical devices [1-3]. Physical restraint is used to prevent a patient from self-harm/harming others, the patients' from falling out of bed, or pulling at and disconnecting medical devices. In addition, restraint is applicated control the patient's behavior, protect the body posture of bed-ridden patients, and enable the performance of care and treatment interventions [4-6].
While the application of physical restraint serves many outcomes that are to the patient's benefit, this practice has the potential of inflicting physical and psychological harm on the individual. Especially in the long-term application of physical restraint, adverse outcomes may develop which include a diminishing of muscular tonus, urinary and fecal incontinence, increased risk of nosocomial infection, development of edema in the lower extremities. In addition various adverse effect may occur that malnutrition, pressure ulcer, asphyxia, chronic constipation, urinary retention, contracture, reduced of physical functions, cardiac arrest, osteoporosis, dehydration, pneumonia, electroencephalographic changes, increased of corticosteroid production, changes in basal metabolism rate, changes in blood volume, fear, embarrassment, increased levels of confusion and anxiety, increased of apprehension, lack of self-confidence, sleep disorders, delirium, withdrawal behavior, agitation, and depression [2,7,8]. Studies examining the reasons for these harmful states that may be caused by physical restraint applications report that healthcare personnel apply physical restraint to patients unnecessarily, the type of physical restraint that is appropriate to patient is not chosen, the physical restraints are either too tight or too loose, and the patient is not watched regularly sufficiently and the required interventions are not carried out.
These reported results indicate that it is of the greatest importance that the application of physical restraint for the purpose of maintaining the patient's general wellness must be performed in compliance with specific standards, and that the patient must be observed and effectively evaluated throughout the process. In addition, the Health Care Financing Administration and the Joint Commission on Accreditation of Healthcare Organizations defined the rules relating to the use of physical restraint in their guidelines of 1989 and 1999, respectively, and many countries have subsequently developed specific procedures regarding the application of physical restraint [9]. In this context, it may be said that nurses who are actively involved in physical restraint applications must be knowledgeable about specific policies and procedures pertaining to this practice. A doctor's order is required for the use of physical restraint and both the patient and the patient's family must have been provided their informed consent before the application. Nurses need to evaluate the patients' responses prior to the application of physical restraint and this evaluation must be made and recorded following a continuous monitoring of the patient. Physical restraints must be removed at regular intervals so that circulation and skin can be checked, and an assessment can be made as to whether restraint should be continued or not [6]. At the same time, nurses should implement the application of physical restraints using an effective method of nursing care that does not impede the patient's freedom and autonomy and considers human liberties and patient rights.
This only can be achieved if nurses are sufficiently equipped with effectual knowledge about the application and evaluation of physical restraint practices. Therefore, it is exceedingly important that nurses be able to ascertain the current situation of a patient with regard to physical restraint applications and in this context, the planning of a training program to remedy any procedural deficiencies becomes significant. This premise forms the basis of this study, which was attempted to examine the deficiencies of physical restraint applications in Turkey.
The aim of this study was to develop a "Physical Restraint Application and Evaluation Scale" to help nurses more effectively manage physical restraint applications and to set standard for this method of nursing care.
The research was planned as a methodological and cross-sectional study.
The study was conducted over the period February 2015-May 2016 at all of the clinics of a university hospital operating in the province of İzmir.
The population of the study consisted of nurses working at a hospital operating in the province of Izmir. The study sample was determined in-line with the requirements of the scale development. In order to perform factor analysis in validity and reliability studies, it is recommended that the sample size be at least five times the number of items in the scale [10,11]. The size of the sample was accordingly determined, and the study was completed with 302 nurses who had consented to participate in the research.
A "Nurses' Identification Form" and a "Physical Restraint Application and Evaluation Scale" were used in the data collection.
The Nurses' Identification Form consisted of 16 open- and closed-ended questions that queried the nurses' socio-demographic characteristics (age, gender, education), professional characteristics (how long they had worked professionally, the unit they work in, the time spent in the unit worked in, units previously worked in, type of work, weekly working hours, number of patients cared for by day and night), and their knowledge regarding physical restraint applications (their status of knowledge about physical restraint, where they received training on physical restraint, the frequency of using physical restraint, experiences of regarding physical restraint applications).
The "Physical Restraint Application and Evaluation Scale" was developed by the researchers. The scale was planned as 57 items and 2 sub-scales. In developing the item pool, the researchers benefited from the literature which included various scales that had been developed in this context and an examination of suitable nursing interventions related to physical restraint application. The draft of the scale which was set up to contain a total number of items in line with related theoretical knowledge, was designed to include the two sub-dimensions of implementation and evaluation. The validity of the scale was first tested to determine whether or not the scale addressed the characteristics that were meant to be measured, whether the measuring was implemented in accordance with the rules and whether the scale data did in fact reflect the characteristics meant to be measured. After a review of all the sampling applications, it was decided as a result of the validity and reliability assessment to remove one item each from the application sub-scale and from the evaluation sub-scale, forming a Physical Restraint Application and Evaluation Scale of 55 items. Each of the items in the scale were assigned responses on a 5-point Likert scale from (1) "I totally disagree" to (5) "I totally agree". The highest score on the scale is 275; the lowest is 55. The higher the score obtained from the inventory, the more positive is the behavior of the nurses with respect to applying and evaluating the implementation of physical restraint.
The analysis of the content validity of the scale was carried out in a process which involved enlisting the opinions of experts. To facilitate this, the content validity ratios and indices of the draft scale were calculated. Lawshe's method was used to determine the content validity ratios of the scale. An "Expert's Evaluation Form" was employed to collect the assessments of the experts. This form was sent out by hand delivery or e-mail to 10 experts who agreed to submit their opinions. The experts were asked to evaluate each proposed scale item in terms of whether it represented the characteristic to be measured, whether it was sufficiently and clearly expressed, whether it could be placed within the scale's determined application and evaluation of physical restraint sub-scales, and to assess each item by marking it "relevant", "relevant but insufficient" or "irrelevant". In order to aggregately express how many experts approved the proposed choices in each item, the items were merged in a single form. Content validity ratios were then calculated for each item on this form.
To determine the content validity ratios of the scale, the number of experts marking down "relevant", "relevant but insufficient" and "irrelevant" for each item was first computed. Then the number of experts submitting a response of "relevant" for each item was divided into half the total number of experts submitting opinions for that item. The Content Validity Ratio (CVR) of the items on the scale was determined by subtracting 1 from this ratio for each item. The items whose CVR's indicated statistical insignificance were removed. The mean of the total remaining CVR's yielded the Content Validity Index (CVI).
To find the face validity of the Physical Restraint Application and Evaluation Scale, all of the items were first evaluated for comprehensibility and expression by the researchers in the light of the suggestions of the experts, after which the needed revisions were made. Secondly, 10 nurses outside of the universe of the research evaluated the scale items for "uniformity and comprehensibility, readability, comprehensibility of the terms, length of sentences, clarity and explicitness of meaning". This pilot implementation also included a review of the educational level of the scale's respondents, their cultural background and levels of competence. Following this, each item of the scale was given its final form with a choice of responses on a five-item Likert type of scale that consisted of "I totally disagree", "I disagree", "I am undecided", "I agree", "I totally agree".
The Physical Restraint Application and Evaluation Scale was examined in terms of construct validity to determine the characteristics that were being measured and to understand what the scores obtained by the persons responding to the inventory actually meant. The technique of Exploratory Factor Analysis (EFA) provided the means of statistically determining the construct validity of each dimension. The Kaiser-Meyer-Olkin (KMO) and Bartlett tests were employed to understand whether or not the dimension was suitable for factor analysis. In this context, the result of the KMO test should be 0.50 or higher and the result of the Bartlett sphericity test must be statistically significant [12]. An additional Confirmatory Factor Analysis (CFA) was performed following the EFA for the construct validity of the application sub-scale. The sub-scale "Application", with the 36 items obtained after the removal of 1 item in accordance with the EFA results and the single-factor construct, and the single-factor and 19-item construct of the "Evaluation" sub-scale were analyzed with CFA. The items with a t-value that was not statistically significant in the first CFA were reviewed.
The reliability of the "Physical Restraint Application and Evaluation Scale" was examined to demonstrate that the instrument was reliable enough to measure with a minimum of error, the data had been accurately collected, and the tool could be used repeatedly. The reliability of the scale was tested according to "Classical Test Theory". "Internal Consistency Reliability" and "Test-retest reliability" were tested. Cronbach Alpha reliability coefficients were calculated in the reliability analysis. Since this scale consists of two independent sub-dimensions, each dimension was tested separately for reliability.
The Physical Restraint Application and Evaluation Scale was examined to reveal whether it was capable of providing consistent results at each application, and showed consistency over time. For this purpose, the Physical Restraint Application and Evaluation Scale was administered three weeks after its first implementation to a total of 30 (n = 30) nurses selected from the study population with stratified and systematic sampling; 86.7% of this group consisted of women, 13.3% of men, and mean age was X = 31.73 ± 6.38 years.
Permission for the study was obtained from the Ethics Committee of the university hospital at which it would be conducted and from the Public Hospital Association General Secretariat with which it was affiliated. In consideration of the principles of volunteerism, the nurses taking part in the study provided their consent to participating after being informed of the purpose and benefits of the research.
The data were evaluated after being encoded using the SPSS 21.0 statistical package program. Numbers, percentages and means were employed in evaluating the nurses' identifying characteristics, professional features and physical restraint applications. The CVR formula was used to determine the scale's content validity and its construct validity was tested with EFA and CFA. In the scale's reliability analysis, Cronbach's Alpha coefficient and the test-retest correlation coefficient were calculated and statistical significance for all the tests was found to be < 0.05.
The mean age of the participants in the study was 35.51 ± 7.60; 87.75% were women. Of the nurses, 46.36% had master's degrees, 48.35% worked in internal medicine clinics and the mean duration of their working experience was 132 ± 90.61 months. A group of 60.92% of the nurses had received training on physical restraint practices. Of the nurses, 59.93% had applied physical restraint and 38.12% were applying physical restraint 1-5 times a month. Among the nurses, 19.89% had used physical restrain on agitated patients, 24.31% to prevent patients from harming themselves, and 17.67% used the method for the purpose of administering treatment.
CFA was performed to confirm the scale's factor construct and the 57-item construct of the two sub-dimensions. In the first CFA, a review was carried out to spot items with a t-value that was not statistically significant; no item was found with a t-value that was not significant. All of the items were left in the scale (Figure 1).
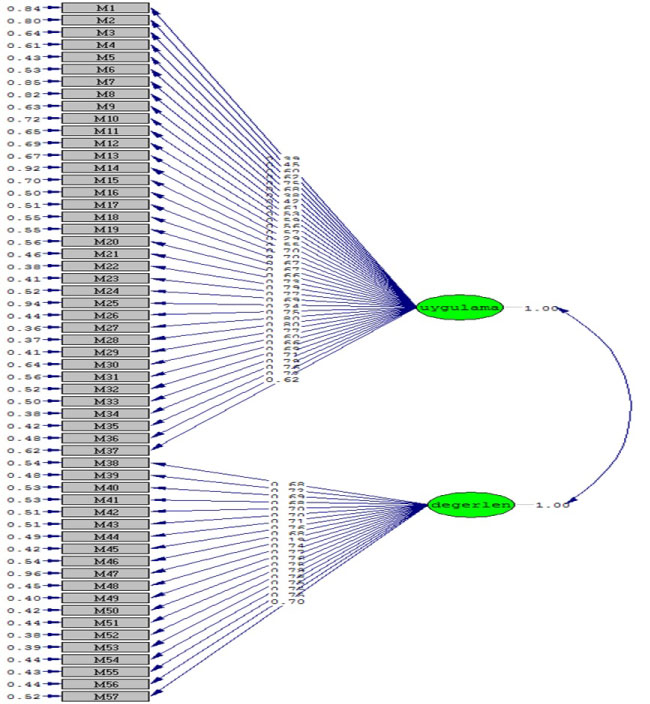 Figure 1: Path diagram for the scale (Application & Evaluation).
View Figure 1
Figure 1: Path diagram for the scale (Application & Evaluation).
View Figure 1
The fit indices of the scale were found to be χ2 = 6307.90, X2/sd = 4.10, RMSEA = 0.077, CFI = 0.93, IFI = 0.93, NNFI = 0.93 and NFI = 0.91. When the coefficients representing the relationship between the variables seen in the model representing the factorial construct of the scale and its factors was considered, it was seen that all of the coefficients were at adequate levels. The fit statistics calculated using CFA demonstrated that the construct of the scale generally fit the collected data.
Since each of the items in the application sub-scale had a CVR of greater than 75, it wasdetermined that the application items were relevant to the measurement tool. The CVR test yielded 0.93, Bartlett's test of sphericity showed significance to be (p < 0.01). It was understood that factor analysis could be performed on the sub-dimension. In the exploratory factor analysis, the limit value for factor loadings for the items was 0.30. Items with factor loadings of below 0.30 should be kept out of the analysis. The analysis having shown that item 25 had a factor loading of below 0.30, this item was removed from the dimension. The exploratory factor analysis performed on the application sub-dimension showed that the dimension consisted of 36 items and was of single-factor construct (Table 1). This factor explained 44.23% of total variance [13]. It is stated that in one-factor scales, explaining 30% or more of the variance may be considered sufficient. The results of the factor analysis yielded a one-factor construct and indicated a high level of validity for the dimension.
Table 1: Factor loadings resulting from factor analysis of application sub-scale. View Table 1
In addition to the EFA, CFA was also performed on the application sub-dimension. According to the results of the EFA, 1 item was removed to yield 36 items, the sub-dimension was then analyzed with CFA to test the one-factor structure and the items that did not have significant t-values in the CFA were reviewed. It was found in the review that there was no item that did not have a statistically significant t-value. The final version of the scale consisted of 36 items and a single factor. The fit indexes were calculated as χ2 = 2180.12, X2/sd = 3.67, RMSEA = 0.068, CFI = 0.90, NNFI = 0.90, NFI = 0.90 and GFI = 0.89. When the coefficients indicating the relationship between the factors and the variables of the model that indicated the dimension's factorial construct were considered, the conclusion was reached that there was a good fit. A look at the fit statistics calculated with CFA showed that the data collected were a good fit for the single factor model of the scale previously determined.
The CVR of each item was greater than 0.75, which meant that each evaluation item was relevant to the measuring tool. The CVR for the sub-scale was 0.92; significance on Barlett's sphericity test was p < 0.01. These results showed that there was high correlation between the variables. Because the sub-dimension consisted of a single factor, the factors could be analyzed by principal components analysis without having to perform transformation. The limit value for the factor loading of the items in the EFA was 0.30. The analysis having shown that item 10 (Item 47) had a factor loading of below 0.30, this item was removed from the dimension (Table 2). In the EFA on the sub-scale, it was concluded that the scale was a one-factor model of 19 items. This factor signified 55.81% of the total variance of the scale. The fit indexes were calculated as χ2 = 2180.12, X2/sd = 3.67, RMSEA = 0.068, CFI = 0.90, NNFI = 0.90, NFI = 0.90 and GFI = 0.89. When the coefficients indicating the relationship between the factors and the variables of the model that indicated the dimension's factorial construct were considered, the conclusion was reached that there was a good fit. The fit statistics calculated using CFA demonstrated that the construct of the scale generally fit the collected data.
Table 2: Factor loadings resulting from factor analysis of evaluation sub-scale. View Table 2
The Physical Restraint Application and Evaluation Scale's application sub-scale, made up of 36 items, was found to have a correlation coefficient of 0.986; the evaluation sub-scale of 19 items had a correlation coefficient of 0.98 (Table 3). Based on a significance of p < 0.05, this indicates that the Physical Restraint Application and Evaluation Scale's test-retest correlation was significantly high, meaning that the scale provides test-retest reliability.
Table 3: Test-retest correlation related to the application and evaluation sub-scales. View Table 3
To determine the reliability of the scale, Cronbach's alpha internal consistency reliability coefficient was calculated. The statistics showed that the overall reliability of the scale was 0.96. The application sub-scale alpha value was 0.96, and the evaluation alpha value was 0.71.
The "Physical Restraint Application and Evaluation Scale" was developed to provide nurses with the means to more effectively manage and evaluate physical restraint applications and to serve the need for a measuring instrument that enables nurses to standardize their nursing care. The fundamental features of a good measuring instrument are validity and reliability. Validity refers to the degree to which a measuring tool can make an accurate and complete measurement of an investigated characteristic [14,15]. In determining the level of validity of a scale, a calculation of the validity coefficient is made, and an interpretation of validity is made on the basis of this coefficient. Reliability is the extent of agreement between the responses given by individuals to test items. At the same time, reliability is related to the degree to which a test accurately tests a given characteristic and is able to test it in repeated instances [13,16]. In this study, content, construct, face validity was examined to determine the scale's validity, and internal consistency and test-retest correlations were examined to determine its' reliability. Content validity of the model was tested with EFA. Factor analysis is based on the correlations between items and is performed to assess whether the items on a scale may be collected under different sub-scales. There are various methods to determine the number of factors in EFA. The most commonly used of these is what is known as the Kaiser-Guttman rule, which is the technique whereby factors are taken that have eigenvalues of greater than 1. The criteria for determining which item belongs to which factor is the factor loading, which indicates the degree of the relationship between the item and the factor. In applying factor analysis, attention must be paid to the consistency and adequacy of the sampling. The Kaiser-Meyer-Olkin (KMO) value is the value that determines the adequacy of a sample in factor analysis. It is expected that in a good factor analysis, the KMO value is above 0.60 [17]. The sample adequacy or KMO value was found to indicate substantial adequacy for the factor analysis. The results obtained showed that the study sample was sufficiently adequate in size and in terms of data to perform factor analysis. The factor loadings of the items were calculated in the EFA and a decision was made as to whether any of these should be removed from the scale. A limit value of 0.30 is accepted for this [13]. The items that did not meet the criteria in our study were item 25 in the application sub-scale and item 10 in the evaluation sub-scale. The application sub-scale consisted of a construct of 36 items, the evaluation sub-scale of 19 items, and both were of one-factor structure [11,18,19].
In determining the factor structure of the scale, CFA was also used. The goal of CFA is to assess how much a factorial model consisting of factors made up of many observable variables (latent variables) conforms to real data. The model to be examined may be defined by the data of an empirical study or may be constructed on the basis of a specific theory [20]. Many fit indexes are used to validate a model in CFA. The intervals of Χ2/d < 3; 0 < RMSEA < 0.05; 0.97 ≤ NNFI ≤ 1; 0.97 ≤ CFI ≤ 1; 0.95 ≤ GFI ≤ 1 ve 0.95 ≤ NFI ≤ 1 among the values observed in the scale model signify an excellent fit while 4 < Χ2/d < 5; 0.05 < RMSEA < 0.08; 0.95 ≤ NNFI ≤ 0.97; 0.95 ≤ CFI ≤ 0.97; 0.90 ≤ GFI ≤ 0.95 and 0.90 ≤ NFI ≤ 0.95 signify an acceptable fit [20,21]. In this context, when the coefficients indicating the relationship between the factors and the variables of the model that indicated the factorial constructs of the application and evaluation sub-scales were considered, the conclusion was reached that there was a good fit.
Since the criteria for the assessment of the scale is the scale itself, it is important that the scale is internally consistent. The scale consists of items that have high correlation with each other and therefore their alpha coefficients are high. Cronbach's alpha coefficient is an indication of the internal consistency of the items and a measurement of homogeneity. Higher alpha coefficients in the scale indicate higher consistency between the items, and it is then assumed that the items query the same characteristics. In the reliability analysis of the scale, when item scores are continuous in the item analysis (Likert type), it is recommended that Cronbach's alpha coefficients be calculated [17]. In this study, Cronbach's alpha coefficient was used to calculate the internal consistency of the Physical Restraint Application and Evaluation Scale, which is a Likert-type instrument. The internal consistency reliability coefficient of the 56-item Physical Restraint Application and Evaluation Scale was found to be 0.96, indicating a high level of reliability for the instrument. The internal consistency reliability coefficients of the sub-scales of the instrument are 0.96 for the application sub-scale and 0.71 for the evaluation sub-scale. Although internal consistent coefficients are generally accepted as 0.70 in nursing research, alpha coefficients in a range of 0.60-0.80 are considered significantly reliable [22]. Accordingly, it can be said the items in the scale show consistency and query the same features. Expressed differently, the homogeneity of the scale is at an acceptable level.
In conclusion, the Physical Restraint Application and Evaluation Scale, which has been tested for validity and reliability in Turkey, was found to be an instrument with acceptable levels of validity and reliability that can be used dependably by nurses in Turkey with patients requiring physical restraint techniques. It might be recommended that the scale be used with larger groups outside the scope of our study's limitations to test whether or not the factorial structure can be maintained.
Idea and concept, design, analysis and interpretation, literature review, manuscript writing, critical review.