Environmental exposures, especially in urban areas, have been associated with various health conditions. The body of research suggests that air pollutants might affect human behaviour in the light of their toxicity on the central nervous system.
This study investigates the association between ambient air pollution concentration levels and Emergency Department (ED) visits for personality disorders, acute reaction to stress, and disturbance of conduct.
Using a health database from Edmonton (Canada), 6,956 such ED visits were identified. A case-crossover design is applied in the study. Conditional Poisson regression method was used to estimate the associations between ED visits and concentrations of carbon monoxide (CO) and nitrogen dioxide (NO2). Air pollutants, ambient temperature, and relative humidity in the constructed models are lagged by 0 to 5 days. The associations are estimated in the forms of parametric algebraic functions.
The results show odds ratios and their 95% confidence intervals along the concentration levels. Positive and statistically significant results were obtained for the exposure to CO and NO2, lagged from 0 to 4 days.
The results of present study suggest an impact of urban air pollution on human behaviour.
Ambient air pollution, Concentration, Exposure, Mental health, Stress
Urban ambient air pollution is identified as a risk factor for cardiovascular and respiratory morbidity and mortality [1]. There is growing evidence suggesting associations between air pollution and a wide range of additional negative health conditions. The existing literature supports the association between exposure to ambient air pollutants and brain health. Among such reported effects are increased incidence of neurological and psychiatric disorders including cognitive decline, anxiety, depression, drug abuse, and suicide [2-6].
In recently published article by Thomson, the author wrote in the abstract: "The present paper provides an overview of how systemic stress-dependent biological responses common to particulate matter and ozone may provide insight into early the central nervous system effects of pollutants, including links with oxidative, inflammatory, and metabolic processes [7]". In his paper the author explains biological aspect of air pollutants which can act as stressors and elicit endocrine stress responses.
Individuals with behavioural disorders struggle with various sorts of challenges that make them a vulnerable population. Higher rates of various mental health conditions, including depression and suicide attempts, are reported among such individuals [8]. Also, these persons are more likely to engage in various forms of substance abuse [9].
In this work ED visits for personality disorders, acute reaction to stress, and disturbance of conduct, not elsewhere classified, are investigated in relation to two ambient air pollution concentrations. The hypothesis is that some air pollutants (here urban and traffic related) are associated with the number of ED visits for behavioural disorders.
The population study in this work consists of all persons served by five hospitals in the city of Edmonton, Canada. As health outcomes, ED visit data collected from these five hospitals in Edmonton were organized in one database and studied. Data on ED visits were retrieved from the database for the period April 1992 to March 2002 (3,652 days). The health cases related to this study were identified by using the International Classification of Diseases 9th Revision - Canadian use (ICD-9) codes. The following health conditions were jointly investigated: personality disorders (ICD-9: 301), acute reaction to stress (ICD-9: 308), and disturbance of conduct, not elsewhere classified (ICD-9: 312). Daily counts as a summary of daily health events of these three categories were calculated and used in the presented study.
In this work two ambient air pollutants are considered, carbon monoxide (CO) and nitrogen dioxide (NO2). Their daily concentration level is estimated as an average of 24 values of hourly measurements. The values were averaged among three monitor stations operating in this time period in the city of Edmonton. Location and the distribution of these stations were well designed. The maximum distance among these stations is 11 km. CO was measured using nondispersive infra-red spectrometry and NO2 using chemiluminescence [10]. (see NAPS Web site: http://maps-cartes.ec.gc.ca/rnspa-naps/data.aspx).
In the statistical models, the daily average of ambient temperature and relative humidity are represented in the form of natural splines with three degrees of freedom. In the realized statistical models, air pollutants and meteorological parameters were lagged by the same number of days, from 0 to 5 days.
This work is a short-term air pollution health effects study. The study analyzes the associations of ambient air pollution with the number of ED visits. As a study design a Case-Crossover (CC) methodology is applied [11]. This technique is beneficial for studying relationships that have short time intervals for individual exposure, disease process, and induction periods. This model also allows for the case individuals to become their own controls. In a standard approach for unbiased CC, a time-stratified technique is used to define the control periods [12]. In such a realization of the method, usually the same days of week in one month are grouped. Health risk is estimated by applying case and control period(s) exposures. In the standard CC method conditional logistic regression is used to estimate the Odds Ratio (OR). In this paper, conditional Poisson models are applied as a flexible alternative approach to the case-crossover methodology [13-15]. For this purpose, a series of the strata of the following form < year: month: day of week > are created. The days are nested in the hierarchical structure: days in days of week, days of week in months, and months in the corresponding years [13]. It is similar to the time-stratified CC method, but in this approach are considered the daily counts grouped by the constructed strata. The conditional Poisson models are realized with respect to the defined strata. On each stratum the regression is performed with respect to the air pollution concentration levels. One stratum can have 4 or 5 days. The number of the days depends on the length of the month (28, 29, 30, or 31 days) and the day of week in a specific month.
To estimate the concentration-response associations, the values of the concentration are transformed. The new values are the result of a product of two functions, where one is the logistic function. The following formula to estimate the Odds Ratio (OR) as the function of the variable z, OR (z) = exp(β(z)) is assumed. Here the variable z represents the concentration of air pollutant (say z = NO2). In the standard CC method, the odds ratio is calculated as OR (z) = exp(β*z), where the coefficient β has a constant value. Thus, in this case the concentration-response function is always of the same form. In the present work the coefficient varies with concentration levels. The formula for β(z) is based on the logistic function and is represented as follows:
where r is the range of the concentrations, and μ (mu) and τ (tau) are the parameters of the logistic function. Here three forms of the function f(z) are considered and investigated: , i.e., an identical, concave, and convex function, respectively. The constant value of the coefficient β is estimated by the statistical model. The model is fitted with the transformed concentration [16].
For the given values of the parameters mu and tau, the coefficient β is estimated using conditional Poisson regression on the constructed strata. The process to determine the optimal values of the parameters mu and tau can be iterative. For a given initial value of mu and tau, and the function f(z), the transformation of the concentration is generated (as f(z)) and multiplied by the logistic function. The result of this product is submitted into the statistical model (this product represents a transformed concentration) to estimate the coefficient β. Using predefined criterion of the goodness of fit, it's possible to validate and determine optimal values of the parameters (mu, tau, and function f(z)). Such an approach was implemented in [17]. A minimization routine was applied to select the model, which realizes the minimum of the AIC (Akaike Information Criterion) value among the tested models. In this work two fixed values of the parameter tau are considered, 0.1 and 0.2. The parameter controls the curvature of the weighting function. Larger values of tau produce shapes with less curvature. We have found in practice that, for large variations in concentration, our risk function can have a marked curvature near the concentration z = mu and setting tau = 0.1 suitably reduces this undesirable curvature without large changing the shape of the function. Here we tried two values of the parameter tau. In practice however, tau can also be varied to improve overall model fit if desired [17].
As values of the parameter mu the successive percentiles of the analyzed air pollutants are used. Thus, the computer program fits the model with the fixed triplets (mu, tau, f(z)) and provides the AIC value and the coefficient β. The realized computer program uses all tabulated values, for the parameters mu and tau. The triplet which gives the minimum value of the AIC is accepted as the final solution. The model finds the value of the coefficient β. The function β(z) is determined, which is a function of the concentration as shown in the above formula. This more flexible model allows one to create all forms of concentration-response functions, including the linear function. A similar approach was used in longitudinal cohort study related to air pollution and mortality [1].
The Health Research Ethics Board of the University of Alberta approved this main study protocol. The study was conceived and designed after March 31, 2002 - it is a retrospective study examining data produced before April 1, 2002.
During the period of the study, from April 1, 1992 to March 31, 2002 (3,652 days), 6,956 ED visits related to personality disorders and stress were identified and used. Among these diagnosed ED visits 3,474 were for personality disorders (1,619 (47%) male cases, 1,855 (53%) female cases), 1,836 were for acute reaction to stress (702 (38%) male cases, 1,134 (62%) female cases), and 1,646 were for disturbance of conduct, not elsewhere classified (979 (59%) male cases, 667 (41%) female cases).
Table 1 summarizes the statistics on environmental parameters and ED visits for behavioural disorders. It is expected that carbon monoxide may have positive associations with a wide spectrum of various mental problems. Assuming that the concentration lagged by 1 day has an effect, we examined a few of such health conditions. Figure 1 shows estimated odds ratios for the following mental illness: neurotic disorders (ICD-9: 300), personality disorders (ICD-9: 301), psychoactive substance use disorder (ICD-9: 303-305), depression (ICD-9: 311), and other nonpsychotic mental disorders. In this situation, the estimations were obtained using the time-stratified standard CC method and conditional logistic regression. The figure presents the results of the association between listed health outcomes and exposure (for lag 1) to carbon monoxide. Odds ratios are reported for an increase in the concentration level expressed as a one interquartile range (IQR = 0.4 ppm). The figure is used to show the correlations between ambient carbon concentration and various mental disorders. It suggests that carbon monoxide may have strong effect on human brain as it shows the association with tested mental conditions. The other results are reported for the subject of this work, i.e., behavioural disorders (ICD-9: 301, 308, 312).
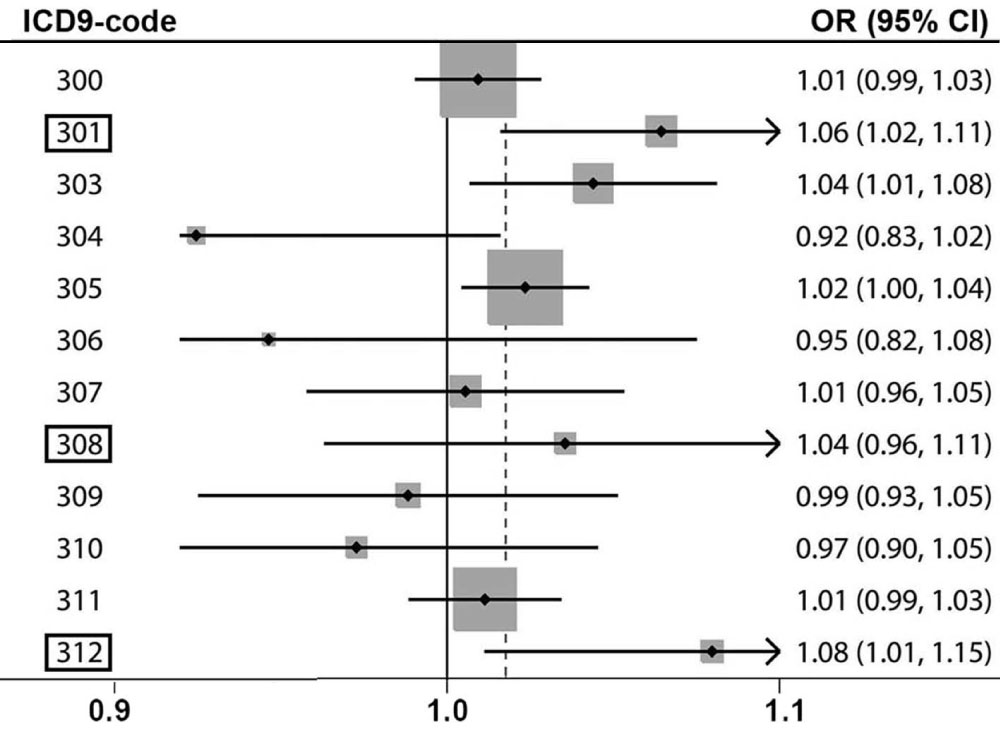 Figure 1: The estimated ORs and their 95% CIs reported for CO (IQR = 0.4 ppm) lagged by 1 day. The arrows indicate wider range. Edmonton, Canada, 1992-2002. View Figure 1
Table 1: Statistics of the daily values of the used parameters. Edmonton, Canada, 1992-2002. View Table 1
Table 2 lists numerical estimations for two considered air pollutants and their lags from 0 to 5 days. As these values indicate the associations between carbon monoxide, nitrogen dioxide and ED visits are positive and statistically significant for the exposure lagged by 0 to 4 days.
Table 2: The estimated parameters by air pollutants and their lags. (ICD-9: 301, 3018, 312). Edmonton, Canada, 1992-2002. View Table 2
The values presented in Table 2 are easy to interpret and use. For example, for the same day exposure for carbon monoxide, the numerical estimations are as follows: β = 0.191973, its standard error = 0.068837, this estimation is statistically significant (P-value = 0.0053), as the parameter mu is chosen 88th percentile of carbon monoxide concentration, and mu =1.21, tau = 0.1, as function f(z) is used the function number 2, i.e. . (It is a convention applied in the used code, where three forms are tested). These values determine the formula for OR(z) and they allow one to calculate OR for any concentration level. Figure 2 and Figure 3 represent the concentration-response functions based on the parameters listed in Table 2.
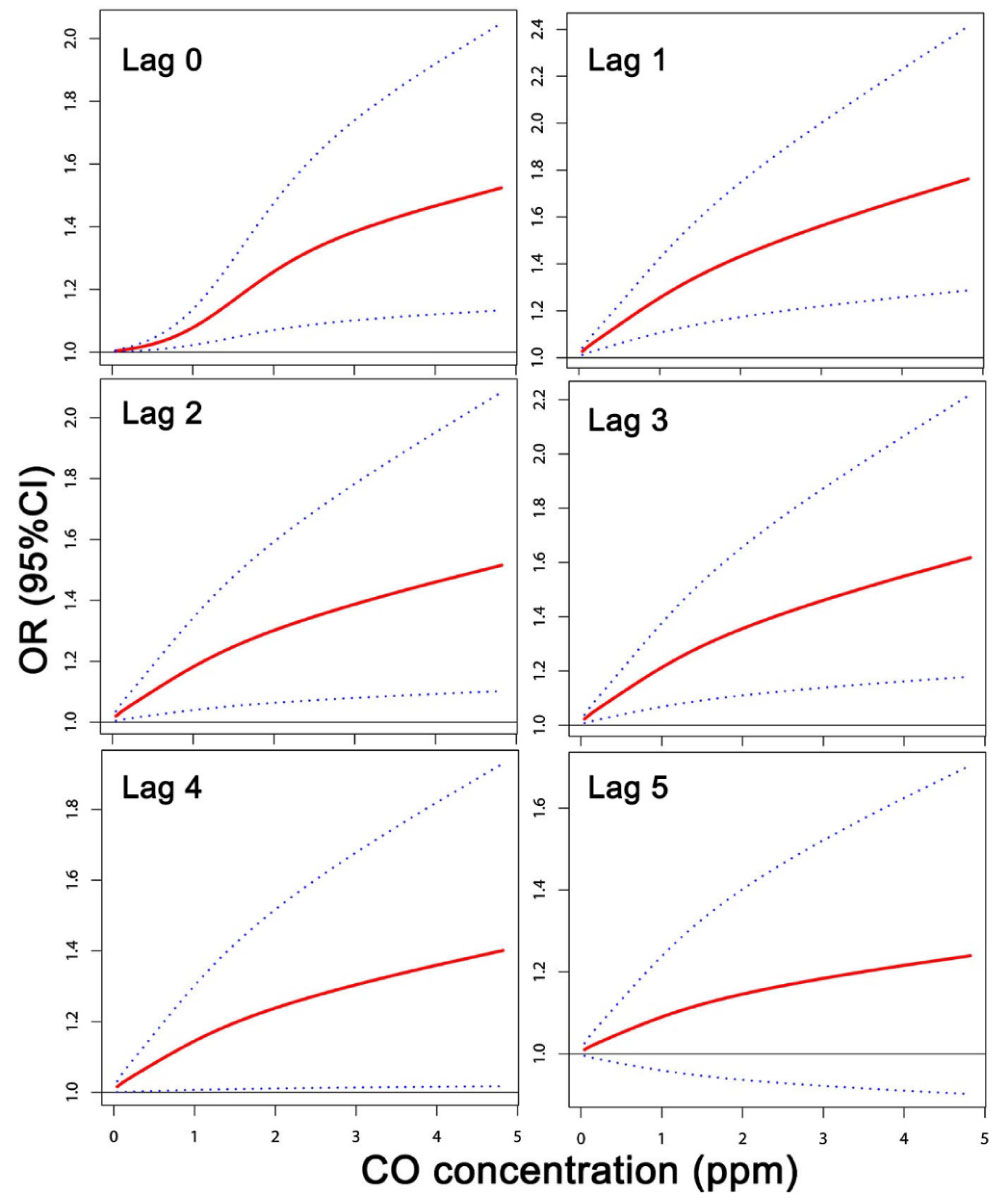 Figure 2: The concentration-response shapes for the exposure to CO lagged by 0 to 5 days. (ICD-9: 301, 308, 312). Edmonton, Canada, 1992-2002. View Figure 2
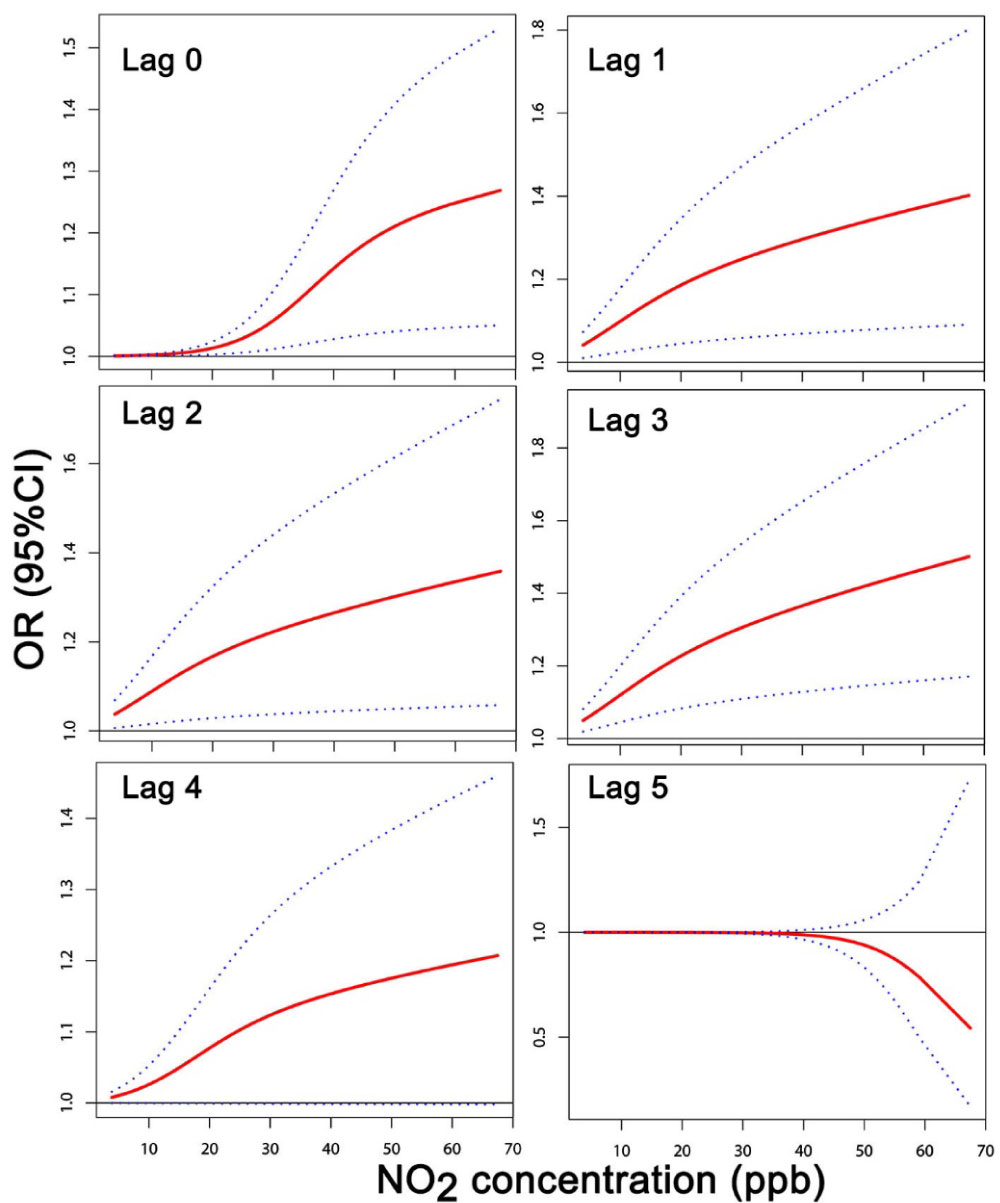 Figure 3: The concentration-response shapes for the exposure to NO2 lagged by 0 to 5 days. (ICD-9: 301, 308, 312). Edmonton, Canada, 1992-2002. View Figure 3
Figure 2 represents concentration-response shapes for the association between ED visits for behavioural disorders and ambient carbon monoxide levels. The functions provide values of odds ratio (OR(z)) for the indicated concentration levels. In addition, a 95% Confidence Interval (CI) is estimated and added to the graph. The figure shows the estimations obtained for the exposure lagged by 0 to 5 days. In a similar way, Figure 3 illustrates the function OR(z) related to concentration-response to ambient nitrogen dioxide (z = NO2).
This study examined visits for personality disorders and acute reaction to stress for patients in five EDs in Edmonton, Canada, over a period of 10 years. The principal results of this study are concentration-response shapes. The estimated parametric functions represent the associations between exposure to specific ambient air pollutants and the numbers of ED visits for behavioural disorders. These visits may represent psychiatric symptomology manifested as personality disorders and acute reaction to tress. The results are shown as odds ratios along the concentration levels.
To the best of our knowledge, this is the first study that examined the association between the exposure to ambient carbon monoxide and behavioural disorders. Our findings support previous studies that investigated mental health issues [2,3,6,7]. As Figure 1 indicates carbon monoxide shows the associations with various mental health conditions.
Applying a time-stratified case-crossover design to 6,956 ED visits related to behavioural disorders, this study found that the numbers of ED visits are positively associated with the exposure measured by concentration levels of urban ambient air pollutants. For the both air pollutants, carbon monoxide and nitrogen dioxide, positive statistically significant effects are observed for the exposure lagged by 0 to 4 days.
In this study carbon monoxide and nitrogen dioxide were each individually linked with increased presentations at ED for behavioural disorders. There is a growing body of evidence that exposure to air pollution affects the brain and by a consequence can alter behaviour [9,18-20].
There are various limitations that are typical of this type of research. Among them is the adequacy of the statistical models applied. It is possible that other functions f(z) (not considered here) may generate better goodness of fit. The used variables, health outcomes and environmental factors, have some errors. The impact of measurement error in the concentration levels and health outcome variables may affect the associations. Another important limitation is the simplified assumption that each person has the same exposure. In the case of carbon monoxide, ground level concentrations may be higher than those collected by monitoring stations as they are usually located a few meters above the ground. Carbon monoxide is slightly less dense than air. By a consequence, the measured values for carbon monoxide may not represent real vertical distribution of the concentration levels.
Another limitation of this work is of the statistical models used. In our situation we have sparse data with a median response of 2 cases per day. It might imply possibly numerical issues with the Poisson link function. It is possible that some strata have only zero daily counts. We haven't found the problem in the numerical realization of the statistical models. In this study we used tabulated values of the parameters mu and tau, and we verified which of them provide the best fit. This approach is more stable as the parameters have limited values. Another approach is to use an initial value of them and run the minimization routine, as was done in [17]. The method presented here uses daily counts (vs. individual events) and allows to construct flexible concentration-response function. This function provides usually better goodness of fit compared with the conventional methods.
The obtained estimations suggest that variation in levels of urban ambient air pollution may be associated with the number of ED visits related to behavioural disorders. There is a growing toxicological evidence demonstrating that exposure to gaseous and particulate air pollutants can have adverse neurological effects.
This research received no external funding.
The author acknowledges Environment Canada for providing the air pollution data from the National Air Pollution Surveillance (NAPS) network.
The author declares no conflict of interest.