According to the United Nations Sustainable Development Goals, countries all over the world are expected to create a healthy living environment for the populace most especially the vulnerable population of which children are examples. Despite the reducing trend in the under-five mortality rate in some developing nations, some nations still have a high record of under-five mortality.
This study adopted the use of a One-way Analysis of Variance (ANOVA) to evaluate any significant difference in the under-five mortality rate of five major developing countries namely Brazil, Bangladesh, Turkey, South Africa and Nigeria owing to their similarity in economy potentials and population. The significant level of 0.05 was considered for the statistical test. The under-five mortality rate figures were secondary data obtained from the UNICEF database for the period between 1990 through 2017.
The test result shown that there was a significant difference in the under-five mortality rates of the five countries under considerations(p < 0.05). A post-hoc analysis using Tukey's method revealed significant pairwise tests comparison between Bangladesh VS. Brazil, Bangladesh VS. Nigeria, Bangladesh VS. Turkey, Brazil VS. Nigeria, Brazil VS. South Africa, Nigeria VS. South Africa, Nigeria VS. Turkey, and South Africa VS. Turkey.
Nigeria has the highest under-five mortality rate (163.17 ± 38.42) while Brazil has the lowest under-five mortality rate (21.92 ± 15.27). Nigeria's average under-five mortality rate is more than twice the average rate of Brazil and almost twice of Turkey's under-five mortality rate within the period under review (1990-2017).
The study on the vulnerable population has continued to remain an important research theme in both health and social economic researches. Children remain one of the important constituents of the vulnerable population. According to the 2017 World Bank report on population growth, there are about 1,953 billion people between ages 0-14 years accounting for 26% of the global population [1]. Even though there is a reported demographic shift that is increasing the aged 65 + cohort, the ages 0-14 years cohort is facing an increasing risk with an estimated decline to 21% of the global population by 2050.
Child mortality is a central case study among many researchers that revolves around children health outcome. Hence, different national and international stakeholders, as well as policymakers, continually strive to see to the global reduction of childhood deaths worldwide. It is also in this vein the United Nations (UN) developed the United Nations Development Goals (MDGs) which was later revamped into the Sustainable Development Goals with the number three (3) agenda still prominently dedicated to improving maternal and child health [2]. Though considerable milestone progress has been made in regards to reducing child mortality rate globally, however, the rate is still higher in Southern Asia and Sub-Saharan Africa with an average of 4 dead cases among every 5 deaths of children before their 5th year birthday [3,4].
There are several types of indices that are used to describe child mortality. They include prenatal, perinatal, neonatal, infancy and under-5 child mortality [5]. Prenatal mortality refers to the death of a child before delivery. The perinatal mortality is defined as the death of a child that occurs within the first week of delivery. The neonatal death describes the death of a child before the 28 days after delivery. The infant mortality rate is used to describe the likelihood of a child's death per 1000 live birth between the time of birth and exactly a year old. The under-five year child mortality is the most common form and widely used metric to define child mortality [6]. The Under-five year child mortality is basically defined as the probability of a child dying before reaching the 5th year birthday anniversary and is usually expressed per 1000 live birth.
According to the UN Inter-agency Group for Child Mortality Estimation [7], an estimated 6.3 million deaths occurred among children and young adolescents. In this recorded death, 2.5 million dead cases were recorded among newborn deliveries; 1.6 million deaths occurred among age bracket 1-11 months; 1.3 million deaths occurred among age bracket 1-4 years; 600 deaths from age bracket 5-9 years and children between age 10-14 years recorded 400,000 thousand deaths. The report indicated that the world has indeed improved on its record of child mortality compared to past records. About 5.5 million children under the age of five-years-old died in 2017 in contrast to about 12.6 million dead cases in this age cohort in 1990. This translated to a rate reduction from 93 deaths per 1000 live births in 1990 to about 39 deaths per 1000 live births in 2017 Figure 1.
 Figure 1: Child mortality decline (1990-2017) Source: [7]. View Figure 1
Geographically in 2017, the Northern America and Europe region performs better on their under-five mortality rate record by recording the lowest rate of 6 deaths per 1000 live births in 2017 [7]. The Central and Southern Asia recorded 43 deaths per 1000 live births while the Eastern and South-Eastern Asia had 16 deaths per 1000 live births. Latin America and the Caribbean reported 18 deaths per 1000 live births while Oceania recorded 23 deaths per 1000 live births. The Sub-Saharan Region still recorded the highest cases of under-five mortality with a record death of 76 per 1000 live births [8].
There are several factors that are responsible for child mortality. Ria, et al. [9] in their study on causes and contributors to infant mortality in North India identified social and verbal autopsy drivers as a major contributor to child death. The social autopsy borders on social, health models and behavioral agents. These include factors stemming from transportations, living conditions of people as well as health systems that are operational. According to Suwal [10], malaria, malnutrition,diarrhea, and respiratory infections are major risk factors responsible for children fatality. Regarding neonatal death, Adeyele and Ofoegbu [11] posited that genetically propelled malfunctions, measure, and level of antennal care support, and quality of postpartum treatments play a role in the morbidity and mortality of children. Other factors responsible for child mortality include maternal literacy level, poverty, early marriage, place of abode, pneumonia, congenital abnormalities, preterm birth complications, nutritional and breastfeeding practices, access to medic care support, food insecurity, early pregnancy, poor hygiene practices, poor water access and so on [12-14].
The data for the study was extracted from the United Nations Children Fund (UNICEF) under-five mortality rate datasets portal [15].The under-five mortality rate for Nigeria, India, Turkey, South Africa and Brazil between 1991 through 2017 was used in this study.
The One-way Analysis of Variance (ANOVA) statistical methodology was adopted in this study. InVivoStat statistical software which was based on an r-programming language was used in the analysis of this study. ANOVA is multiple comparisons and parametric method used to test a mean effect difference for more than two groups. It could be considered as an advanced extension of the t-test independent sample distribution. Originally invented by Sir Ronald A. Fisher; a versatile and renowned Statistician to investigate treatment effects in agricultural experiments, the method is now widely used in Economics, Medicine and social sciences field [16]. This statistical methodology assumes that observations sets under consideration are independent, normally distributed and the condition of homogeneity of variance (equal variance) is satisfied [17,18]. This method generally seeks to test the null hypothesis that:
H0: µ1 = µ 2 = µ3 =……..= µk versus the alternative hypothesis that:
H1: k ∃ 1 ≥ i, l ≥ k: µi ≠ µl ( at least one of the pair mean is not equal)
The linear model for the One-way ANOVA is given as follows:
The "I" entails the group membership while the "j" subscript denotes class membership (from the value of 1 to n). The Xij is equal to three distinct components namely; the overall mean of the experimental units(µ), a group classification deviation (αi) and the random effect (eij). The ANOVA makes a comparison of the variation between samples (Sum of squares for groups: SSB) relative to the variation within samples (sum of squares for Error: SSE).
Mathematically, the equation for the one-way ANOVA can be stated as follows:
The equ (2) can be written as :
The total sum of Squares (SSTO) = Regression sum of squares (SSR) + Error sum of squares(SSE)
The following degrees of freedom namely n-1, 1, and n-2 are associated with the SSTO, SSR, and SSE respectively.
Where n = sample size.
In general, the Table 1 below gives a summary of the One-way ANOVA F-test
Table 1: Summary of one-way ANOVA test. View Table 1
The p-value is derived when the comparison of the F Cal is made with the F-distribution table with their appropriate degrees of freedom. If the null hypothesis is rejected, a post-hoc test is required to determine a pair of groups that are responsible for the test significance. The Tukey's method, Bonferroni's and Scheffe's tests are some of the common ANOVA post-hoc tests [19].
According to Table 2 above, the mean under-five mortality rate of Bangladesh is 77.995 while for Brazil is 31.921. Nigeria have the highest a mean under-five mortality rate of 163.171, South Africa have 63.913 and Turkey have mean under-five mortality rate of 35.107 Figure 2.
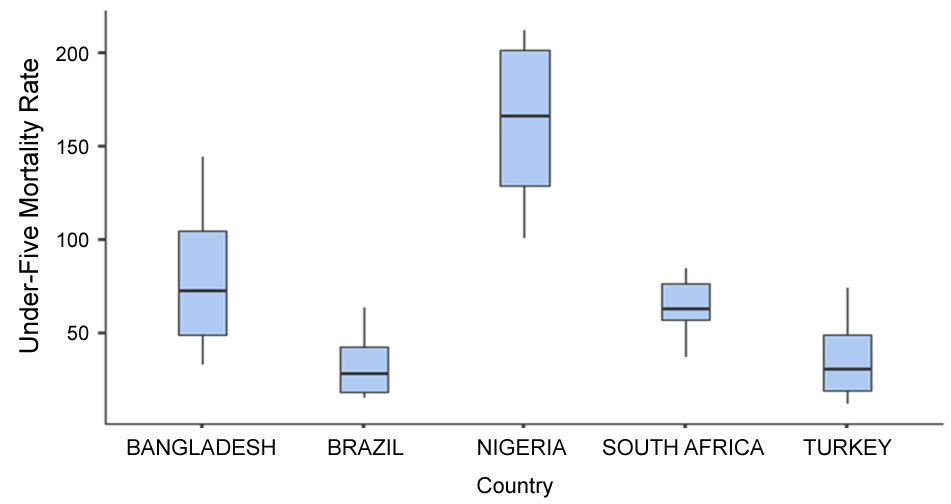 Figure 2: Box-plot of the countries under-five mortality rate. View Figure 2
Table 2: Descriptive statistics of the countries under-five mortality rate. View Table 2
The normality test using the Shapiro Wilk statistic shown that the under-five mortality rate of the countries is normally distributed (p > 0.05). This normality property of the data can be visualized as indicated in Figure 3 below.
 Figure 3: Probability plot of the under-five mortality rate. View Figure 3
Table 3 gave the F statistic of the ANOVA distribution. Since the p-value < 0.0001, it show that the ANOVA model is significant which entails that the means of the under-five mortality of at least a pair of the countries under evaluation are significantly different.
Table 3: ANOVA table. View Table 3
Thus, a post-hoc test using the Tukey's Method will be used to further evaluate this significant difference as a result of not accepting the null hypothesis of equal means the under-five mortality rate of the countries.
The post-hoc comparison indicated that the means of the under-five mortality rate between Bangladesh versus Brazil; Bangladesh versus Nigeria; Bangladesh versus Turkey; Brazil versus Nigeria; Brazil versus South Africa; Nigeria versus South Africa; Nigeria versus Turkey; and South Africa versus Turkey were all statistically significant (p < 0.05) [20].
It can, therefore, be inferred that among the five countries under consideration, Nigeria has the highest under-five mortality rate (163.17 ± 38.42) followed by Bangladesh (77.99 ± 34.42). However, Brazil has the lowest under-five mortality rate (21.92 ± 15.27) closely followed by Turkey (35.12 ± 19.10). Nigeria's average under-five mortality rate between 1990 through 2017 is more than twice the average rate of Brazil and almost twice of Turkey's under-five mortality rate within the period under review. Therefore, there is a need for the Nigeria government to improve the country's health care systems by implementing policies and regulations to cater for maternal and child health. This improvement is urgently needed if the country will be able to fulfill the United Nations Sustainable Development Goals in the area of child health by the year 2030.