A scoping review of the literature reporting on smartphone use and parameters of mental health from January 2008 to February 2018 was performed for the purpose of summarizing and describing current research findings regarding the association of smartphone use with anxiety, depression, stress, and sleep of college students. The study followed the Preferred Reporting Items for Systematic reviews and Meta-Analyses for Protocols 2015 (PRISMA-P 2015) guidelines.
Thirty-one articles met protocol criteria. Fifteen articles reported on studies of multiple mental healths related issues. Nineteen examined the association of smartphone use with anxiety, 19 examined depressions, eight examined sleep, and seven examined stress. Literature contained in this study indicated varied associations between problematic smartphone use and anxiety, depression, stress, and sleep. Consistent positive correlations were observed between problematic smartphone use, anxiety, stress and poor sleep. The correlations with depression were more disparate. The majority of studies were cross-sectional in nature and correlational. While existing research indicates correlations between problematic smartphone use and certain parameters of mental health, these associations should be studied further with research methodologies permitting more definitive conclusions regarding the links.
Smartphones, Anxiety, Depression, Stress, Sleep, Mental health
Since the Apple iPhone launch in 2008, prevalence of smartphone usage has reached near ubiquity with 81% of Americans reporting smartphone ownership in 2019. This proportion has more than doubled (from 35%) since 2011, the first year the Pew Research Center reported figures on smartphone ownership [1]. Touted widely as one of the more influential innovations of the 21st century, smartphones provide users with a host of capabilities including access to information, communication, and navigation, among countless others [2]. However, as with many other forms of technology, not all aspects of progress are positive. The negative effects associated with increased smartphone use are numerous and varied and include distraction of medical personnel [3], work-home interference [4], distracted driving [5], and academic distraction [6].
Recently, educators and researchers have expressed a growing concern that problematic smartphone use may also be contributing to growing mental health crisis among college students [7,8]. Some researchers and technology experts have hypothesized that design of smartphone devices themselves may exploit a variety of cognitive and psychological process that lead to an unhealthy attachment to the smartphones while simultaneously negatively impacting one's emotional state [9].
Research regarding the negative effects on mental health associated with smartphone use is relatively new and covers a wide range of contributing factors; therefore a scoping review was determined to be the appropriate method to answer the research question. As opposed to a systematic review, which is guided by a highly-specific research question, a scoping review seeks to determine the broad range of evidence around a topic and summarize accordingly [10].
Scoping reviews are used to "examine the extent, range and nature of research activity", "summarize and disseminate research findings", and "identify research gaps in the existing literature" [11]. The purpose of this study was to describe current knowledge regarding the relationship between smartphone use of college students and aspects of their mental health. Specifically, this scoping review will answer the following questions: 1) What are the current research findings regarding the association of smartphone use with anxiety, depression, stress, and sleep of college students and, 2) What are the primary instruments used in studying the association between smartphone use and those parameters of mental health?
The protocol for this study followed the Preferred Reporting Items for Systematic reviews and Meta-Analyses for Protocols 2015 (PRISMA-P 2015) guidelines [12]. Although PRISMA-P was designed as pre-defined, quality assurance approach to conducting a systematic review, we followed these procedures (as applicable) in order to provide transparency of the methodological rigor of our scoping review process.
The search strategy was designed in collaboration with a medical librarian who performed the search. Relevant studies to this review were identified through searches of four electronic databases (Medline, Web of Science, Scopus, and PsycInfo). The searches were performed February 21-23, 2018 and were limited to articles published between January 1, 2008 and February 21, 2018. The initial year (2008) was chosen because it was the year following the initial release of the iPhone, which popularized smartphones.
The search used the following terms and Boolean operators: (Smartphone* OR iPhone* OR "smart phone" OR "smart phones" OR "cell phone" OR "cell phones" OR "mobile phone" OR "mobile phones") AND (mental health OR addict* OR depress* OR anxiety OR Anxious OR stress* OR sleep OR nomophobia OR "fear of missing out" OR FOMO OR problematic) AND (College or University) AND Student*).
Rayyan, a web-based application designed to facilitate systematic reviews, was used for the initial screening of manuscripts [13]. All citations were imported into Rayyan and each researcher independently analyzed the titles and abstracts to determine if they met inclusion criteria. Articles were excluded when they were not research studies (eg, commentaries, review articles, etc.), did not include college students, were not from peer-reviewed journals, were published in a foreign language, or when their focus was on the use of smartphones for treatment or identification of mental health issues, as opposed to smartphones as a contributing factor to negative mental health outcomes. Figure 1 contains the PRISMA flow diagram for article selection. After the individual reviews, disagreements over the inclusion of particular articles were resolved by jointly re-reviewing those papers until consensus was reached.
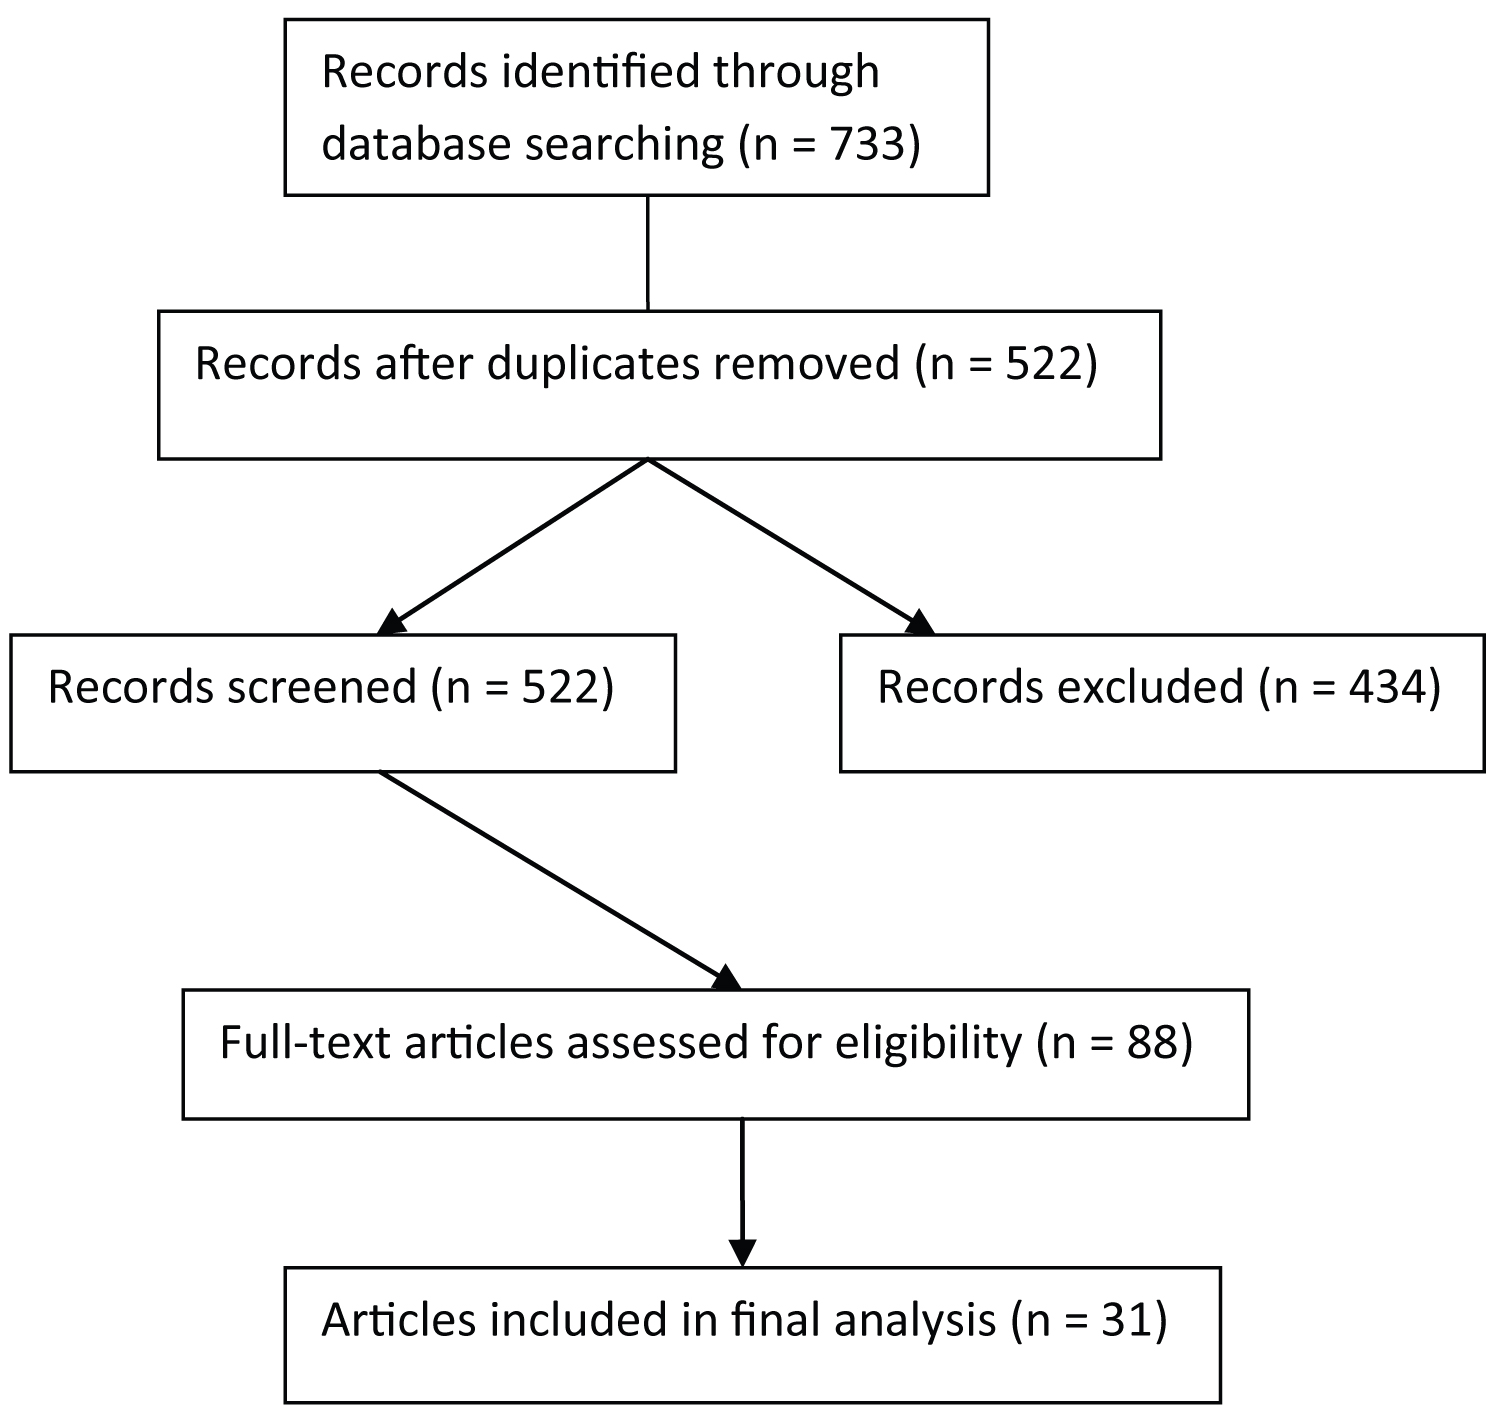 Figure 1: PRISMA flow diagram for article selection.
View Figure 1
Figure 1: PRISMA flow diagram for article selection.
View Figure 1
The initial database search resulted in 733 total records. Duplicate records (N = 211) were removed, resulting in 522 abstracts for initial screening. Abstract screening revealed that 434 abstracts did not meet inclusion criteria and resulted in 88 abstracts accessed for full-text analysis. After a full-text analysis, 31 articles were determined to meet study criteria, shown in Table 1.
Table 1: Studies included in scoping review and mental health aspect assessed (N = 31). View Table 1
Articles that assessed multiple mental health aspects (eg, depression and anxiety) were counted within each category for analysis. Thus, the total number of studies adds up to more than 31. Of those 31 articles, 19 (61.3%) examined the association of smartphone use with anxiety (Table 2), 19 (61.3%) examined depression (Table 3), eight (25.8%) examined sleep (Table 4), and seven (22.6%) examined stress (Table 5).
Table 2: Studies evaluating link between smartphone use and anxiety (N = 19). View Table 2
Problematic smartphone overuse can be measured in a variety of different ways depending on the assessment instrument and intent of the investigators. For example, overuse and dependence are two different types of problematic use. Twenty-six of the 31 studies in our analysis (83.9%) employed a previously published scale to assess smartphone use or overuse, while five studies (16.1%) [20,32,33,36,38] used an investigator-developed tool to assess smartphone use or dependence. Six instruments accounted for 15 of the 31 studies (48.4%) analyzed. Kwon, et al. Smartphone Addiction Scale (SAS) [53] as well as its short version developed by the same research group (SAS-SV) [51] were the most commonly used assessment tools for smartphone use in the studies we analyzed at four and three studies, respectively. The Self-Rating Questionnaire for Adolescent Problematic Mobile Phone Use (SQAPMPU) from Tao, et al. [67] and the Mobile Phone Problem Use Scale (PMPU) from Bianchi and Phillips [65] were used in two studies each. The Hong, et al. Mobile Phone Addiction Scale (MPAS-H) [73] and Kim, et al. Smartphone Addiction Proneness Scale (SAPS) [83] were also used in two of the studies in our analysis. It should be noted that the studies assessing mental health sequelae of smartphone use and overuse included in this analysis were conducted in a variety of countries around the world and many of the instruments were translated into the country's specific language prior to use. Validity and reliability assessments of the specific instrument (with or without translation) were sometimes provided by the authors in the individual studies. However, a comprehensive analysis of the validity of the smartphone use scales employed by the studies analyzed was outside the scope of this analysis.
Kwon's SAS is a 33-item self-reporting instrument consisting of six factors: Daily-life disturbance, positive anticipation, withdrawal, cyberspace-oriented relationship, overuse, and tolerance [53]. Each statement is evaluated by respondents on a scale of 1-6, and overall scores can range 33-198, with higher scores corresponding to a higher level of smartphone addiction [53]. The SAS was used by four studies in our analysis [19,21,27,34]. A short version of the SAS (SAS-SV) [51] developed by the same research team was used by three studies in our analysis [18,22,40]. The SAS- SV contains 10 items which are evaluated by respondents on the same six-point Likert-type scale as the SAS. Scores on the SAS-SV can range 10-60, with higher scores signifying higher levels of smartphone addiction [51].
The PMPU is a 27-item instrument consisting of statements that respondents evaluate on a 10-point Likert scale from "not true at all" to "extremely true [65]". Scores on the PMPU can range 27-270, which higher scores indicating increasing levels of problematic mobile phone use. Two studies in our analysis used the PMPU [39,41].
Hong, et al. MPAS-H is an 11-item instrument evaluating three factors of smartphone addiction: Time management and its problems, academic problems and influence of smartphones, and using smartphones as a substitute for reality [73]. Respondents evaluate each item on a six-point Likert scale ranging from 1 ("incompletely agree") to 6 ("completely agree"). Higher scores are indicative of higher levels of smartphone addiction. Two studies in our analysis used the MPAS- H [26,30].
Kim, et al. SAPS is a 15-item instrument consisting of statements that respondents evaluate on a four-point Likert scale from 1 ("strongly disagree") to 4 ("strongly agree") [83]. Scores on the SAPS range from 15 to 60, with higher scores signifying a greater degree of smartphone addiction proneness. The SAPS is structured around four domains including disturbance of adaptive functions, withdrawal, tolerance, and virtual life orientation. Two studies in our analysis used the SAPS [28,29].
Anxiety was a common mental health aspect found to be associated with smartphone use in this scoping review with 19 of the 31 articles (61.3%) assessing some aspect of anxiety (Table 2). The anxiety construct was assessed via a variety of self-report instruments both as a dependent and an independent variable regarding the relationship with smartphone use. The Beck Anxiety Inventory (BAI) [54], Spielberger's State-Trait Anxiety Inventory (STAI) [48], and Zung's Self-Rating Anxiety Scale (SAS-Z) [52] were the primary instruments and were used in four studies each. Thus, 12 of the 19 studies (63.2%) analyzing the effect of smartphone use and overuse on anxiety employed one of these three instruments. The remaining seven studies (36.8%) each used a different scale to assess anxiety. A full description of the three most commonly used anxiety inventories is provided below, although full psychometric and reliability analyses of all instruments used are outside of the scope of this study. References for the anxiety instruments used by the studies in our analysis are available in Table 1.
The BAI contains 21 statements representing physical and psychological symptoms of anxiety that respondents rate on a scale of "Not at all" (0 points) to "Severely-it bothered me a lot" (3 points) [54]. Scores on the BAI range from 0 to 63 with validated cut offs for "low", "moderate" and "potentially concerning" levels of anxiety. The BAI was used in four studies in this analysis [21,27,32,38].
The STAI is a 40-item instrument divided into two main sections, one intended to assess the "state" of anxiety (ie, the reaction occurring at a given time at a certain intensity; form Y-1) and the other intended to assess the "trait" of anxiety (ie, relatively stable proneness to anxiety; form Y-2) [48]. Respondents rate each of the 40 statements on a scale of how well they represent their self-perception ("not at all" [1 point] to "very much so" [4 points]). Scores on each of the sections range from 20 to 80 with higher scores signifying greater degrees of anxiety. The STAI was used in four studies in our review [16,19,34,41].
The SAS-Z is composed of 20 statements related to symptoms of anxiety, each rated by respondents on a scale of "none or a little of the time" to "most or all of the time" [52]. Example statements include "I feel more nervous and anxious than usual" and "I can feel my heart beating fast" [52]. Scores on the SAS-Z range 20-80 with higher scores signifying a greater degree of anxiety symptoms. The SAS-Z was used in four studies in our review [18,31,33,42].
Anxiety was positively correlated with either problematic or high smartphone use in eight studies [18,21,23,29,32,33,35,38]. Hawi and Samaha's study results indicated that students with smartphone addiction showed higher odds of having high anxiety (OR = 4.71, p = 0.008) [27]. Lee, et al. found that with each one-point increase in smartphone dependency score, the risk of abnormal anxiety in men and women increased by 10.1% and 9.2%, respectively (p < 0.001) [31]. Chen, et al. study revealed that mobile phone addiction level is a positive significant predictor of negative emotions, including anxiety [17]. Mok, et al. study showed that anxiety levels increased with smartphone addiction levels (p < 0.001) [34]. A regression analysis performed by Tao, et al. in a study of 4747 Chinese college students found that problematic mobile phone use was an independent predictor of anxiety symptoms (OR 2.02, 95% CI 1.68-2.43) [42]. Five studies examined the effects that anxiety has on smartphone use and all showed that anxiety predicted smartphone addiction [19,25,28,41,84]. Finally, Cheever, et al. examined the effects that removal of possession of smartphone had on anxiety levels over time. Results indicated that students classified as heavy smartphone users experienced statistically significant increases in overall anxiety (p = 0.017), as opposed to lighter users of smartphones [16].
Depression was the other most common mental health aspect explored by the studies in our analysis. Nineteen of the 31 studies (61.3%) investigated the consequence of smartphone use on depression outcomes or the effect of depression on smartphone use, as shown in Table 3. Six different scales were used to assess depression in these studies.
Table 3: Studies evaluating link between smartphone use and depression (N = 19). View Table 3
The Center for Epidemiologic Studies Depression Scale (CES-D) was employed in five of the studies in our analysis [17,18,28,36,42], which made it the most commonly used depression scale. The CES-D contains 20 statements that center around perceived symptoms of depression, with some statements positively worded (ie, "I enjoyed life") and others negatively worded ("I had crying spells") [69]. Statements are scored on a scale of 0 ("rarely or none of the time [less than one day a week]") to 3 ("most or all of the time [5-7 days a week]"). Positive statements are scored in reverse from negative statements on the same scale. Scores on the CES-D range 0-60 with higher scores indicating a greater degree of depression symptoms [69].
The Beck Depression Inventory-I (BDI-I) is composed of 21 sets of statements that represent varying levels of severity of certain characteristics of depression around four indices: appearance, thought content, vegetative signs, and psychosocial performance [70]. Respondents choose the statement out of four (with a corresponding point value) that best represents their self- perception of their symptoms. An example set of phrases includes, "I do not feel sad" (0 points), "I feel sad" (1 point), "I am sad all the time and I can't snap out of it" (2 points), "I am so sad and unhappy that I can't stand it" (3 points). Scores range 0-63 with higher scores indicating more severe symptoms. Four studies in our analysis used the BDI-I [19,21,34,38].
Another iteration of the BDI-I was developed by the same research team in the 1990s to more closely align with significant changes to the depression diagnosis and screening guidelines that had occurred since the BDI was first published in the 1960s. The Beck Depression Inventory-II (BDI-II) is composed of 21 items (similar to the BDI-I) covering a range of domains including pessimism, past failure, guilt feelings, and self-dislike, among other attributes [74]. Also like the BDI-I, the BDI-II contains sets of statements from which respondents select one that most closely aligns with their self-perception. Scoring is identical to the BDI-I (0-63), and the BDI-II also has score cut offs for mild, borderline, moderate, severe, and extreme symptoms of depression [74]. The BDI-II was used in one of the studies in our analysis [26].
The Zung Self-Rating Depression Scale (SDS) is composed of 20 statements related to symptoms of depression, each rated by respondents on a scale of "a little of the time" to "most of the time". Example statements include "I feel down-hearted and blue" and "I feel hopeful about the future" [72]. Scores on the SDS range 20-80 with higher scores signifying a greater degree of depression symptoms. The SDS was used in three studies in our analysis [24,33,43].
The Patient Health Questionnaire-9 (PHQ-9) is a nine-item self-report instrument which involves the respondent indicating a level of frequency of various symptoms of depression over the preceding two weeks including "feeling down, depressed, or hopeless" and "poor appetite or overeating" [68]. Scores on the PHQ-9 range from 0 to 27, with higher scores indicating more severe depression symptoms and cut offs for minimal, mild, moderate, moderately severe, and severe depression. The PHQ-9 was used by two of the studies in our analysis [15,22].
The General Health Questionnaire-28 (GHQ-28) is a 28-item self-report instrument that is a shortened version of the larger, more comprehensive 60-item General Health Questionnaire more suited for use in a primary care setting [56]. The GHQ-28 is used to screen for a variety of psychological and psychiatric conditions and consists of four subscales: Somatic symptoms, anxiety and insomnia, social dysfunction, and severe depression. Respondents answer questions related to frequency of symptoms on a four-point Likert scale (0-3 points each), and scores range from 0 to 84 with higher scores corresponding to higher levels of distress. A score of 23 or lower would be classified as non-psychiatric, while scores of 24 or higher would indicate need for psychiatric care [56]. The GHQ-28 was used by one study in our analysis [23]; however, the results will be reported separately in the anxiety and depression sections of the tables and manuscript.
Regarding the links between smartphone usage and depression, researchers have studied a variety of different factors. Panova, et al. revealed a correlation between maladaptive mobile phone use and depression (r = 0.194, p < 0.01) [35]. Likewise, Tao, et al. found that depression symptoms were higher in students with problematic mobile phone use (p < 0.001) [42]. Results from Kim, et al. showed that perceived psychological health (which includes depression) is closely related to smartphone overuse (p < 0.05). Saadat found positive correlations between mobile phone dependency and depression [38]. Similarly, Demirci found a positive correlation between smartphone addiction and depression [21]. Results from Gao, et al. showed that smartphone addiction and depression were correlated (p < 0.05) and that smartphone addiction negatively affected quality of life through the mediating effect of depression [26]. Chen's study of 1441 Chinese students revealed a significant association between smartphone addiction and depression in females, but not males [18]. Two studies in our analysis did not find a link between smartphone use and depression. First, results from Ezoe, et al. study did not indicate a significant correlation between mobile phone dependence and depression (r = 0.12, p > 0.05) [24]. Second, Mok, et al. latent class analysis showed that smartphone addiction was not a significant factor in differentiating depression levels (F = 0.275, p = 0.76). Furthermore, one study by Choi, et al. found that higher depression scores were associated with lower levels of smartphone addiction (p < 0.001) [19].
Similarly, Elhai, et al. study that used an app to objectively track smartphone usage found that higher baseline depression scores were associated with lower smartphone activity and vice versa [22].
Other researchers examined the predictive nature of smartphone use on depression. Chen, et al. found in a sample of 1089 Chinese college students that level of smartphone addiction was a significant predictor of depression (B = 0.43, t = 3.15, p < 0.01) and that 45% of the variation in depression scores was accounted for by the smartphone addiction level in a regression model with good fit (F[1,40] = 7.26, p < 0.001) [17]. A regression analysis performed by Tao, et al. in a study of 4747 Chinese college students found that problematic mobile phone use was an independent predictor of depressive symptoms (OR = 2.53, 95% CI 2.10-3.05) [42]. Eyvazlou, et al. study results showed that cellphone overuse was significantly correlated with depression (p < 0.001) and a multivariate regression indicated that overuse also predicted higher levels of depression (p < 0.001) [23]. Several other researchers examined the effect of depression on smartphone addiction and found that depression was a positive predictor of either smartphone addiction or problematic smartphone use [15,25,28,33]. Results from Park, et al. study are a nuanced exception to these findings. They found that participants who used smartphones for bridging weak ties were likely to have lower levels of depression (p < 0.001) [36].
Eight of the 31 studies (25.8%) included in this review analyzed the relationship between sleep and smartphone use (Table 4). The Pittsburgh Sleep Quality Index (PSQI) [77] was used in six of the eight studies (75%) that evaluated sleep [18,20,21,23,39,42]. The PSQI is a self-report instrument that assesses a variety of factors and consists of seven components, all intended to evaluate the quality of sleep over the preceding month prior to administering the survey: Sleep quality, sleep latency, sleep duration, habitual sleep efficiency, sleep disturbances, use of sleeping medications, and daytime dysfunction [77]. The PSQI yields a global score ranging from 0-21, with higher scores indicating worse sleep quality. A score of ≥ 5 on the PSQI is generally considered indicative of sleep quality issues [77].
Table 4: Studies evaluating the link between smartphone use and sleep (N = 8). View Table 4
The Medical Outcomes Study Sleep Measure [79], used in one of the studies in our analysis [37], is a 12-item self-report instrument that evaluates sleep across six indices: 1) Sleep disturbances; 2) Adequacy of sleep; 3) Daytime drowsiness; 4) Snoring; 5) Waking short of breath or with a headache, and 6) Amount of sleep. Respondents rate each of the items based on their perception of the characteristic over the preceding four weeks. Scoring includes a scaled response matrix based on the chosen levels of each index as well as factoring in the quantitative assessment of the amount of sleep of the respondents. Higher scores indicate a greater degree of the particular aspect of sleep being assessed [79]. The final study assessing sleep used an investigator-developed scale [14].
Of the six studies employing the PSQI, four showed a significant positive correlation of PSQI sleep scores with smartphone addiction/problematic use as measured by either the SAS, PMPU, or Cell Phone Overuse Scale (COPS) [18,21,23,39]. Eyvazlou, et al. demonstrated a significant correlation between mobile phone overuse and the PSQI global score (r = 0.29, p < 0.001) [23].
Deepali, et al. study showed that mobile phone use exceeding two hours per day was associated with higher sleep deprivation (p < 0.001) [20]. In Tao, et al. study, PMPU and poor sleep quality were observed in 28.1% and 9.8% of participants, respectively. Also, a multivariate logistic regression showed independent associations of PMPU and sleep quality with mental health (p < 0.01), with a significant interaction between the measures [42]. Rosen, et al. found that daily smartphone usage predicted sleep problems (p < 0.001) and participants who checked their phones during sleeping hours experienced more sleep problems (p < 0.001), as did participants whose phone was placed away from the bed when sleeping (p < 0.05) [37]. Alosaimi, et al. reported that 44.1% (N = 1043) participants agreed or strongly agreed that sleeping hours decreased once they started using smartphones [14]. Chen, et al. analyzed smartphone addiction as a predictive factor of sleep quality by sex (ie, male vs. female) in a multivariate regression model and found that poor sleep quality was significantly predictive of smartphone addiction in both sexes (male adjusted OR 3.19 [95% CI 2.23-4.58], p = 0.000; female adjusted OR 2.12 [95% CI 1.18-4.51], p = 0.000) [18].
Demirci, et al. reported that daytime dysfunction (as a component of sleep quality) was higher in the high-use smartphone group compared with the low-use group [21]. Additionally, smartphone use severity was significantly correlated with PSQI global scores (r = 0.156, p = 0.014) [21]. Finally, Sahin, et al. analyzed the link between scores on the PMPU and PSQI in a sample of 504 students and found a significant correlation (r = -0.297; p = 0.000) [39].
Seven of the 31 studies (22.6%) reviewed pertained to stress and met criteria for inclusion in this review (Table 5). The Perceived Stress Scale (PSS) was used to assess stress in four (57.1%) of those studies [20,33,40,44]. The PSS is a 14-item self-report questionnaire using a five-point Likert scale that assesses perceived stress in the last month [80]. The Depression Anxiety and Stress Scale (DASS-21) [58], Experiences in Close Relationships-Revised-Korean [85], and Scale of University Students' Daily Life Stress [86], were used in the remaining three studies.
Table 5: Studies evaluating the link between smartphone use and stress (N = 7). View Table 5
Stress was found to be a positive predictor of both mobile phone addiction [25] and problematic smartphone use [33]. Kim, et al. reported that study participants who were stressed were 2.2 times more likely to overuse smartphones than those with low stress [29]. Increased use of mobile phones was also associated with higher perceived stress (p < 0.05) [20]. Results from Kuang-Tsan, et al. study indicate that academic stress (p < 0.05) and love-affair stress (p < 0.001) were positively related to smartphone addiction. Interpersonal relationship stress, family life stress, and self-career stress were not significantly related to smartphone addiction [30]. Wang, et al. reported that perceived stress moderates the relationship between entertainment motivation (ie, use smartphones for fun) and problematic smartphone use, as well as between escapism motivation (ie, use smartphones to get away from what one is doing) and problematic smartphone use among those scoring high on problematic use [44]. Finally, Samaha, et al. [40] found a small positive correlation between risk of smartphone addiction and perceived stress (p < 0.002), with high risk of smartphone addiction associated with high levels of perceived stress. In linear regression modeling, risk of smartphone addiction explained 3.8% of the variance in perceived stress [40].
The purpose of this scoping review was to provide and summarize research regarding the association of smartphone use with various parameters of mental health. Overall results of studies in this review strongly suggest that there is a link between smartphone use and mental health related issues of anxiety, depression, and stress. There is also an association with sleep, which may exacerbate some of those issues. However, there are many different nuances in these studies that do not allow one to make definitive statements regarding effects of smartphones on parameters of mental health. Another one of the challenging issues in interpreting studies in this review pertains to the terminology used for smartphone use. Smartphone addiction, problematic smartphone use, and high use of smartphones were the different variables/terms examined in the studies. While it may seem like just a matter of semantics, there are differences in both the philosophy and measurement of those variables. Panova and Carbonell propose moving away from terminology and research referring to "addiction" because of insufficient support to confirm actual addiction [87]. Instead they urge researchers to focus on "problematic use" when studying technology behaviors. To simplify the discussion, we will use the term "problematic use" throughout the remainder of this paper when referring to excessive or high smartphone usage.
Anxiety and depression were the most common parameters of mental health examined in this review with each appearing in 62.5% of the studies. This similar to Elhai, et al. finding that depression and anxiety were consistently related to problematic smartphone use [88]. The body of research points to linkages between anxiety and smartphone use; however, one of the difficulties in making strong claims is that 11 different instruments were used to measure anxiety.
Nonetheless, in all nineteen studies anxiety was shown to be either associated with or predictive of problematic smartphone use. Of the mental health attributes examined in this scoping review, studies pertaining to anxiety were not only the most common, but also the ones with most consistent results.
The findings regarding depression were perhaps the most interesting. The majority (n = 14, 73.7%) of studies revealed some type of positive association between depression and problematic smartphone use, but there were five exceptions. Two studies [24,34] found no association, while Choi, et al. and Elhai, et al. found negative correlations between depression and smartphone use [19,22]. One possible explanation is that those with depression may engage in behavioural avoidance or social isolation, which could extend to digital relationships as well [89].
Results from Park, et al. study revealed a nuance in that the reasons for smartphone usage may also play a factor [34]. When used for bonding purposes, smartphone usage may actually serve as a protective factor against depression. A similar, but alternate explanation posed by Hunter, et al. is that those who are socially excluded or isolated may receive emotional comfort through their phones [90]. Another potential explanation is that problematic smartphone use was measured differently (ie, subjectively versus objectively) in some of the studies, which could lead to different outcomes. All of these findings suggest that the relationship between depression and problematic smartphone use is complex and without a single unifying theme that explains the connection.
While not directly a mental health issue in and of itself, sleep-related problems are common among college students and play an interactive role in student health [91,92]. Sleep-related problems have a negative effect on many aspects of people's lives including cognitive, physical, and mental health [93]. In particular, sleep disturbances are associated with higher rates of depression and anxiety [94]. Although the studies in this review examined different facets of sleep-related problems, all confirm an association between problematic smartphone uses and sleep disturbances. As Tao, et al. noted, one question that needs further study is the degree to which sleep might play a mediating role with regard to problematic smartphone use and aspects of mental health [42]. In other words, if sleep disturbances due to problematic smartphone use can be overcome, will that effectively reduce certain negative mental health outcomes?
Extensive research indicates high levels of stress among college students with many different contributing factors [95]. Researchers are still trying to determine the role that smartphones may play in this phenomenon. Some have suggested that smartphones promote an "always on" environment in which users feel compelled to constantly monitor digital communication [96]. In effect, the inability to take a "mental break" from those activities may be creating and/or exacerbating stress levels. In this review, when taken as a whole, studies pertaining to stress present an interesting picture. With stress being both a predictor and outcome of PSU, it shows that there is no clear answer to the direction of the influence. As discussed later in this section, these results may suggest a potential reciprocal effect that needs to be studied further.
Although results of studies in this review point toward a connection between problematic smartphone use and mental health, it is difficult to make definitive statements regarding the links. First, the studies are primarily correlational, therefore it is not completely clear which direction the influence flows. While most reported on the influence of smartphone use on the various mental health issues, it is possible that the reverse could be true. Although more difficult to conduct, experimental research is needed to determine cause and effect. It is also possible as Pourrazavi, et al. suggest that there are reciprocal interactions in which mental health issues drive students to smartphone use for comfort or distraction and the overuse exacerbates the issues [97].
Similarly, Brand, et al. have proposed a theoretical framework model (I-PACE) from which to examine technology use disorders. This model suggests potential interactions between personal attributes, affective and cognitive responses to situational triggers, and executive functioning [98]. Second, the cross-sectional nature of the studies also presents a challenge to concluding that problematic smartphone use contributes to negative mental health outcomes. Longitudinal research is needed across all the different mental health issues included in this study. Third, as Ellis and colleagues conclude, self-report instruments may not accurately reflect the true nature of smartphone use [99]. Now that smartphone time and usage tracking apps are readily available, future research should use that actual data in lieu of or in addition to self-report instruments. Fourth, because of the various ways that problematic smartphone use and the mental health issues covered in this review are framed, defined, and measured, it is difficult to make strong comparisons among the studies. It is beyond the scope of this study to delve into those differences, but the findings from this review regarding measurement instruments provide important background information.
There are several practical implications of the findings from this review. First, college mental health counselors should be aware of the association between smartphones and mental health and consider discussing with students in their care as applicable. However, they also need to interpret results of studies linking smartphones and mental health with the methodological issues in mind. Second, researchers need to recognize and address the gaps in the literature, particularly as it applies to lack of experimental studies and longitudinal research. Significant research that addresses the nuances of smartphone use and mental health is needed to provide a clearer picture of those associations.
There are limitations with regard to interpreting the results of this scoping review. Unless noted, all instruments in this analysis were self-report in nature, meaning the respondent completed the instrument without direct guidance or input from a clinician or investigator. There can be inherent bias in self-reported data, even from an instrument with validity and reliability data related to use in a specific population [100,101]. While self-reported information has its benefits, including the ability to obtain direct (from the patient) rather than indirect (through a third party) information, different respondents may interpret the exact same statement or prompt on an instrument in a variety of ways, leading to potential issues in interpreting the results. While notable for an individual study, given the cross-sectional and comprehensive nature of our analysis, interpretation of any effect that self-report bias may have had on outcomes was outside the scope of our analysis.
The proliferation of smartphone use among college students has coincided with growing mental health concerns. This scoping review provides the current landscape with regard to the association of smartphone use with anxiety, depression, stress, and sleep. Anxiety and depression were the most common mental health parameters studied, with anxiety being the most consistent association with problematic smartphone use. Results from studies on depression revealed mixed results that may be due primarily to differences in measurement. While all the studies in this review showed some form of association between problematic smartphone use with one or more of those mental-health related issues, a number of methodological issues prevent definitive statements regarding smartphones and mental health. Mental health professionals, college counselors, and students should be aware of those associations, and researchers need to conduct studies that eliminate the methodological concerns.
The authors thank Mr. Frank Davis of the University of Kentucky Medical Center Library for his assistance with the literature search strategy and citation retrieval.