Background: Neuropathy is a disease which results in the loss of sensation in the extremities. One method for assessing the degree of neuropathy is with a monofilament evaluator which buckles at a prescribed force depending on the filament diameter. However, as this assessment is conducted by the clinician's hand, the true force delivered is unknown. Therefore, the purpose of this study was to model the effects of both insertion depth and monofilament diameter on the contact force and normal stress produced on the plantar surface of the foot.
Methods: Theoretical contact mechanics equations were used to understand the relationship between insertion depth, monofilament diameter, and applied force. SolidWorks® Finite Element Analysis was used to evaluate a 0.5 mm diameter monofilament, which is reported to provide a contact force of 10 grams of force at the point of buckling, at various insertion depths. Two different Finite Element Analysis models were studied in this paper, a homogenous isotropic model and a composite isotropic model. Both models comprised of 188 total simulations. A range of human skin elastic moduli were selected to determine the effect imposed upon the contact force and normal stress produced by monofilament insertion. For the homogeneous isotropic model, the sample was modeled as a uniform block with one overall elastic modulus. Likewise, the composite isotropic model was created using epidermis, dermis, and subcutaneous fat layers, each with its own specific thickness. A range of moduli were considered for the epidermis and dermis layers. The homogenous isotropic model was validated against the results of the theoretical calculations by comparing the percent error between the contact force and normal stress. Consequently, the same simulation settings were used for both models. Regression analysis was used to analyze the composite isotropic results.
Results: The theoretical contact mechanics showed that higher levels of insertion and larger diameter monofilaments produced greater amounts of contact force. The normal stress increased with insertion depth but decreased with monofilament diameter. Increased values of human skin elastic modulus resulted in the contact force and normal stress being more sensitive to insertion depth, compared to lower values. The homogenous isotropic model performed well compared to the theoretical equations with percent errors approximately between 2% and 8%. Furthermore, after collecting all of the data from the composite isotropic model, regression analysis was used to derive empirical equations that represented both contact force and normal stress as functions of epidermis elastic modulus, dermis elastic modulus, and insertion depth. The empirical equations showed that to produce exactly 10 grams of force upon contact the physician would have to insert the monofilament between 0.235 and 0.559 mm depending on the epidermis and dermis moduli.
Conclusion: The results showed that small differences in insertion depth and monofilament diameters had a large effect on the force delivered. Therefore, caution is recommended when using hand applied monofilaments because of the variances of human skin properties among patients and the subsequent levels of applied force.
Neuropathy, Semmes-Weinstein monofilament, Contact mechanics, Finite element analysis, Boussinesq half-space, Modeling, Regression analysis
FEA: Finite Element Analysis; gF: Grams of Force
Neuropathy is a disease, commonly associated with diabetes, which results in a loss of sensation on the plantar surfaces of the hands and feet. It is commonly known as "diabetic foot" and 40-60 million people suffer from challenges associated with neuropathy [1]. In a research survey conducted by Brouwer, et al. they found that the most frequent symptom of neuropathy was burning feet [2]. Likewise, individuals tolerate numbness, electrical sensation, sensory loss, and shooting pain caused by neuropathy [3-6]. Severe cases of neuropathy can result in an individual stepping on an object and unknowingly puncturing their foot as a result of their sensation loss [7]. These individuals are at a greater risk of ulceration [8-10]. The loss of protective sensation and mechanical loading during weight bearing activities, such as standing and walking, are attributing factors to the ulceration of individuals suffering from neuropathy [11]. In the worst cases, neuropathy can result in infection, amputation, and even death [9,12].
The gold standard for assessing the degree of neuropathy is with the Semmes-Weinstein monofilament test. This method involves inserting a monofilament, similar to fishing line, noninvasively into human skin. These nylon monofilaments are calibrated to produce a consistent buckling stress and to minimize the vibration of the clinician's hand while it is being applied [8,13]. The monofilaments are popular because they are noninvasive, quick, and easy to use [8,14,15]. There are many different gauges of these monofilament evaluators which reportedly produce different amounts of force at the point of buckling. However, the actual force produced by these monofilaments is highly sensitive to many different parameters. For example, Chikai and Ino compared a manual monofilament assessment with an automated process looking at how insertion speed and angle affected measurements [16]. They found that after 10 applications of the monofilament the buckling force decayed by 10% of its initial value [16]. They also found that the velocity and the insertion angle affected the buckling force in both automated and manual applications of the monofilament [16]. Haloua, Sierevelt, and Theuvenet found that these monofilaments are dependent on the temperature and the humidity in which they are stored, resulting in different buckling forces than advertised [17]. The length of the monofilament also influences the amount of force applied to the plantar surface of the foot [18]. Furthermore, an extensive literature review by Dros, et al. found that there is a lack of standard testing methodology [8]. This, with the lack of accuracy of this test, raises questions about its justification [8].
One of the most common monofilaments used produces an equivalent force of 10 grams when applied to the plantar surface of the foot to the point of buckling [3,4,14]. The monofilament is advertised to produce this force at the instant that it buckles but it is possible for it to exceed its rated value if it is over inserted. The subsequent inability of the clinician to apply a consistent force presents challenges for assessment of disease progression and future treatments to combat this disease. Therefore, it is important to develop an understanding of the parameters that may affect the force applied by the monofilament and, therefore, why special consideration needs to be taken when performing this test on patients.
To this end, this modeling study examined how changes in the depth of insertion, the diameter of the monofilament, and skin material properties affect the amount of force and stress produced on the skin. Accordingly, this study was designed to ensure that the monofilament was inserted normal to the skin, i.e. normal to the plantar surface of the foot. This orientation of insertion is easily achieved with both theoretical equations and finite element analysis (FEA). Theoretical contact mechanics were used to show the dependence on the insertion depth for monofilaments of various diameters. Furthermore, FEA was conducted via SolidWorks® Simulation for the 10-gram rated monofilament. The FEA simulations were used to calculate the contact force and to measure the normal stress. The FEA results of this study were verified against theoretical results and were also subjected to a sensitivity analysis [19]. Ultimately the objective of this study was to determine the effects of monofilament diameter, insertion depth, and skin materials properties on the force produced as a result of monofilament contact against the skin.
In this study, theoretical contact mechanics equations were chosen that would best demonstrate the effect of insertion depth on the force and stress produced on the skin for monofilaments of different diameters. This problem was modeled as a Boussinesq problem, where there is a rigid indenter being inserted into an elastic half space. In this study, the nylon was considered rigid when compared to human skin. Sneddon took Boussinesq equations and applied Hankel transforms to derive relevant equations for a cylindrical indenter applied normal to the surface [20]. Sneddon looked at the relationships between depth of penetration and force, in addition to stress profiles as a result of the contact. The first equation derived by Sneddon (Equation 1) shows the relationship between load (P) and the depth of penetration . Here a is the radius of the circular face and is the Poisson's ratio of the half space. The other variable, , is the modulus of rigidity, also known as the shear modulus, and is defined in Equation 2. Additionally, E is the modulus of elasticity. Combining Equation 1 and 2 leads to a complete expression, Equation 3, for the load (P) in terms of . This theoretical equation was used to compare to the FEA results when the monofilament is inserted normal to the skin. The FEA predictions were validated with analytically derived models to ensure that the simulation performed as expected [19]. The analytical model is given by the following equations:
Sneddon derived an expression for the normal stress profile caused by the indenter, where is the incremental radial distance from the center of the indenter up to the edge of the indenter (Equation 4). However, in this study it was necessary to set equal to zero to calculate the normal stress at the center of contact, because at the edge of the indenter the stress becomes theoretically infinite [21]. This produces a singularity at the edge and as a result it is more feasible to evaluate the stress at the center of the contact. However, in reality infinite stress will not occur due to the rounded edges of the indenter and non-linear properties, such as plasticity. This equation was rewritten to a more readily applied form in Equation 5 and was used to compare the normal stress found at the center of the indenter when in contact with the human skin sample.
SolidWorks® Simulation was utilized for this modeling experiment between the monofilament evaluator and a human skin sample. Two different FEA models were analyzed: A homogenous isotropic model and a composite isotropic model, depicted in Figure 1. Both models used the same monofilament, which was modeled as a thin cylinder with an overall length of 40.0 mm and a diameter of 0.500 mm, equivalent to a standard 10-gram evaluator. The actual monofilament is made of nylon; in the simulation nylon 6/10 was used. The chosen nylon has an elastic modulus of 8.30 GPa, a Poisson's ratio of 0.28, a density of 1400 kg-m3, and a yield strength of 139 MPa, as reported in the SolidWorks® material database. In the homogenous isotropic model, the specimen was a rectangular block with a Poisson's ratio of 0.49 [22] and density of 1116 kg-m3 [23]. Four different elastic moduli were considered, 1000, 2000, 3000, and 4000 kPa [22,23]. The overall dimensions of the specimen were 13.0 mm width, 13.0 mm height, and 13.0 mm depth. The depth was based off of the work of Thomas, Patil, and Radhakrishnan which reported that at the forefoot the thickness of the skin can be expected to be between 7.8 and 13 mm based on the health of the individual [22]. The composite isotropic model incorporated three distinct layers of skin: The epidermis, the dermis, and subcutaneous fat [23]. In Figure 1 the orange layer corresponds to the epidermis, the pink is for the dermis, and the subcutaneous fat is yellow. Similarly, to the homogenous isotropic model four values for elastic modulus of the epidermis layer were selected: 1000, 2000, 3000, and 4000 kPa [22,23]. Likewise five values of dermis elastic moduli were considered: 100, 150, 200, 250, and 300 kPa [23]. Only one value of subcutaneous fat elastic modulus was studied, 34 kPa, since it was determined that the subcutaneous fat does not vary as much as the adjacent skin layers [23]. The values of Poisson's ratio, density, and yield strength for human skin were kept consistent between both models. In the composite isotropic model the overall dimensions of the specimen were 13.0 mm width, 13.0 mm height, and 13.0 mm depth. The depth was subdivided based on the epidermis, dermis, and subcutaneous fat layers, which were respectively 0.6 [24], 5.0, and 7.4 mm thick. It was reported from Wang and Sanders that the dermis layer can range in thickness from 1 to 4 mm and is thicker than the epidermis [25]. In order to rationalize each layer thicknesses for the forefoot some approximations had to be made. Since the thickness of the entire specimen was 13 mm [22], the epidermis was selected to be 0.6 mm [24], and considering that Li found the subcutaneous fat region in his model to be marginally thicker than the dermis layer [23], then the dermis thickness was approximated to 5 mm. This left the subcutaneous fat layer to be 7.4 mm thick.
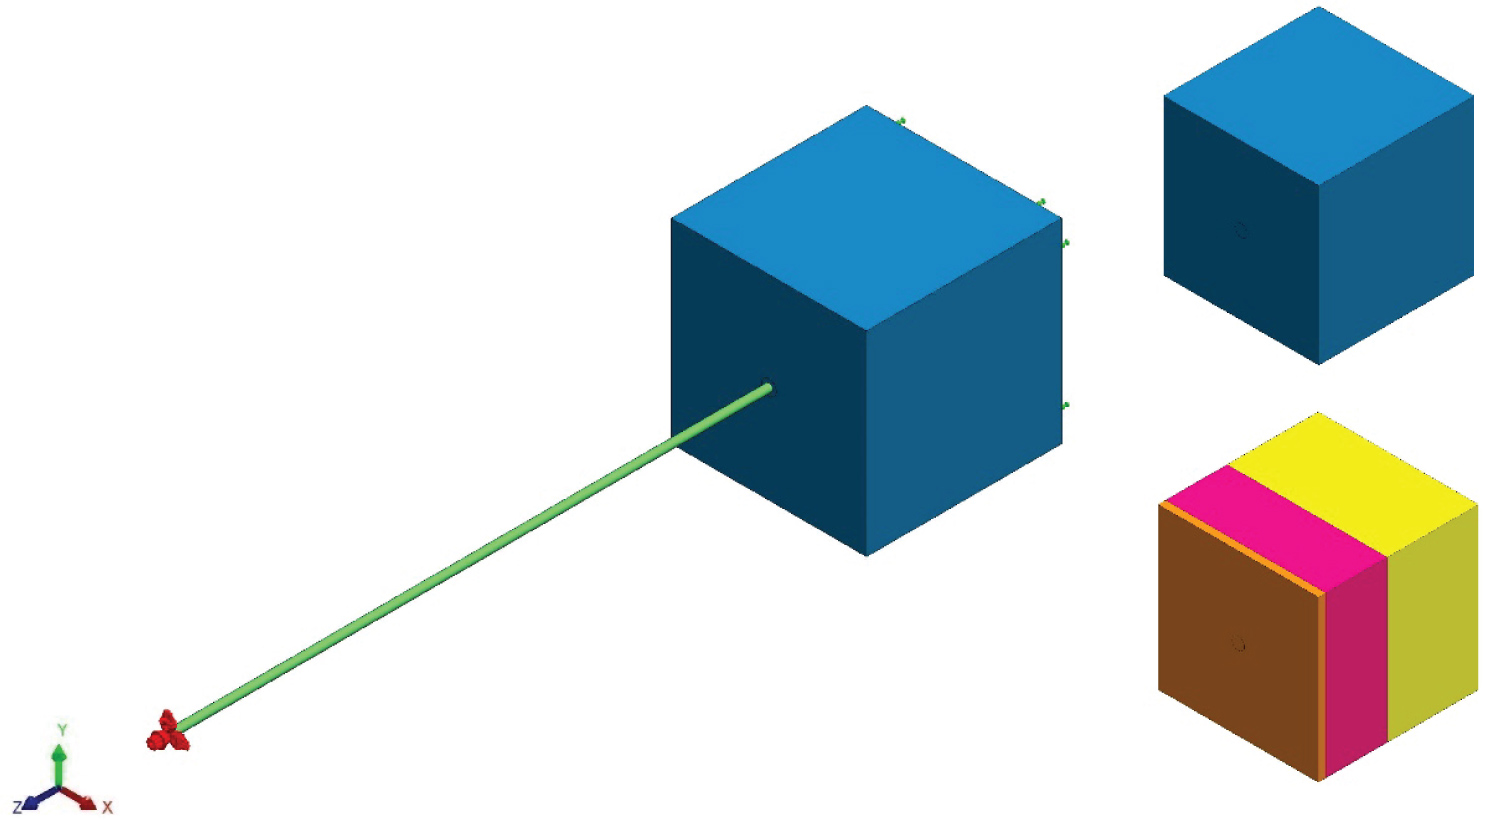 Figure 1: Contact assembly- Nylon monofilament in initial contact with human skin specimen (a) Setup assembly; (b) Homogenous isotropic skin specimen; (c) Composite isotropic skin specimen.
View Figure 1
Figure 1: Contact assembly- Nylon monofilament in initial contact with human skin specimen (a) Setup assembly; (b) Homogenous isotropic skin specimen; (c) Composite isotropic skin specimen.
View Figure 1
In both models the monofilament and specimen were arranged into a SolidWorks® assembly in which the end of the monofilament was in immediate contact with the sample. Figure 1 shows the monofilament (green) in contact with a human skin specimen. A static analysis was employed for all trials assuming linear elastic material properties and small displacements. The simulation was set up with a fixture on the back face of the sample, shown in green arrows, opposite that of the contact with the monofilament. All of the other faces of the specimens were unconstrained and free.
The monofilament was given a prescribed displacement at the opposite end of the surface-to-surface contact, shown in red arrows. The displacements considered in the homogenous isotropic model were between 0.025 and 0.3 mm spaced in equal increments of 0.025 mm apart, totaling twelve insertion depths. In the composite isotropic model seven displacements were considered between 0.1 and 0.7 mm, spaced in equal increments of 0.1 mm. These displacements were defined in the z direction, whereas the x and y directions where set to 0 mm. It was necessary to set the x and y directions to zero in this simulation to properly define how the monofilament is supposed to interact with the specimen. The contacting surfaces between the specimen and the monofilament were given a no penetration condition, which allowed the monofilament to deform the specimen and to create an impact crater representative of the insertion. Mesh parameters included a curvature-based mesh with a maximum element size of 0.250 mm, minimum size of 0.0833325 mm, and a minimum of 12 elements in a circle. The element size growth ratio was set to 1.5 and the mesh density was set to be fine. Mesh control settings were utilized at the end of the monofilament and a circular region, with a 1.00 mm diameter, on the face of the specimen to further refine the mesh. This parameter was set to have an element size of 0.050 mm and a 1.5 ratio. Dong, et al. used a similar process of having an extremely fine mesh at the area of contact and a coarse mesh farther away [26]. When considering contact mechanics it is important to have a fine mesh, which does increase the computational time. Nonetheless, mesh controls allow for areas of interest to have a much finer mesh than the surrounding areas, which are not as important and consequently the stress gradients are lower. This provided a good balance between a good quality mesh and run time. It should also be noted that an H-adaptive study was employed which served as a way to further refine the mesh at areas of interest, such as the contacting surfaces. The mesh was refined as a result of the stresses that occurred in the model in order to reach the target accuracy threshold [27]. This level of mesh refinement is similar to surface roughness; at a large scale the surface may have very little roughness, but at a smaller scale it may appear to be extremely rough.
The associated H-adaptive parameters included setting the target accuracy to 98%, or 2% error, and setting the accuracy bias to global. The target accuracy is a parameter for the strain energy norm [27] and was used as a criterion to justify that the simulation completed. The accuracy bias was set to global to prevent the presence of singularities, which meant that the FEA simulation focused on getting accurate results on a global scale [27]. Additional study parameters included selecting the options for improving the accuracy for no penetration contacting surfaces, setting the incompatible bonding options to more accurate and using the FEE Plus iterative solver, which works well with the H-adaptive solving method. Identical mesh parameters were used for both models, where the homogenous isotropic model was validated against the theoretical equations to prove that the mesh settings yielded correct results.
After simulation, numerous results were reviewed including the contact force, normal stress, and the accuracy achieved in the simulation. Sensors were placed at the center of the specimen, where the monofilament made initial contact. Sensors were configured to measure the values of force and stress, which are automatically updated for each simulation. The contact force was calculated by the software and is shown as a set of vectors, whereas the stress is depicted with contour plots. A comparative analysis was performed between the theoretical equations and the homogenous isotropic model, while regression analysis was used to analyze results from the composite isotropic model. Once a simulation was setup it was duplicated and modified to reflect different parameters such as the insertion depth. This ensured that all settings remained the same from one simulation to another. In total 188 simulations were completed between the two models. All simulations were performed on a Dell Inspiron 7559 with an upgraded Samsung 860 EVO m.2 solid state drive and 16 gigabytes of RAM. It also utilizes a 2.6 GHz Intel Quad Core i7-6700HQ.
The first set of results are based off of theoretical equations 3 and 5, where the amount of force and stress are both functions of the depth of insertion and the diameter of the monofilament. Furthermore, when using equation 3 the units are in Newtons, however, to be consistent with neuropathy studies, which use Semmes-Weinstein monofilaments, the force is expressed in grams-force (gF). This was achieved by dividing Newtons by gravity, 9.81 m-s-2, and then multiplying by one-thousand to convert from kg to g. The values for normal stress are all expressed in kilopascals (kPa). When using Young's modulus and Poisson's ratio for human skin [22,23] the following surface plot, Figure 2, was produced. It shows that as the depth of insertion increased, so did the contact force. The same was seen as the diameter of the monofilament increased. Another surface plot was created to show the normal stress as a function of insertion depth and diameter, Figure 3. Here, the greatest amount of stress occurred when the amount of insertion increased, while the diameter decreased. Both Figure 2 and Figure 3 are for an elasticity of 1000 kPa.
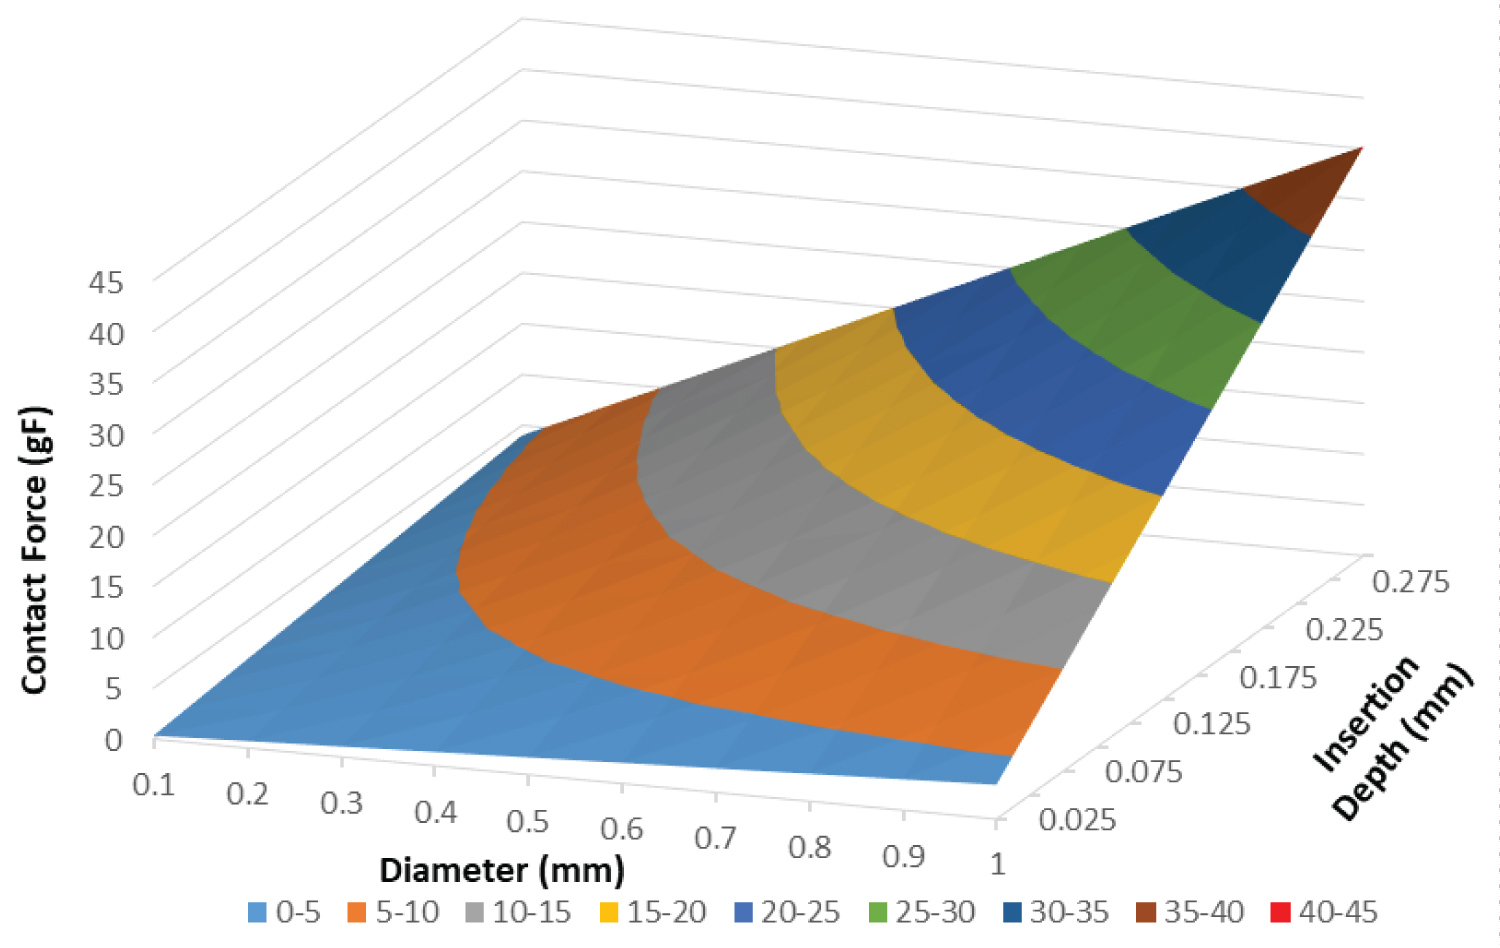 Figure 2: Contact force surface plot- Contact force as a function of insertion depth and diameter for human skin with an epidermis elastic modulus of 1000 kPa.
View Figure 2
Figure 2: Contact force surface plot- Contact force as a function of insertion depth and diameter for human skin with an epidermis elastic modulus of 1000 kPa.
View Figure 2
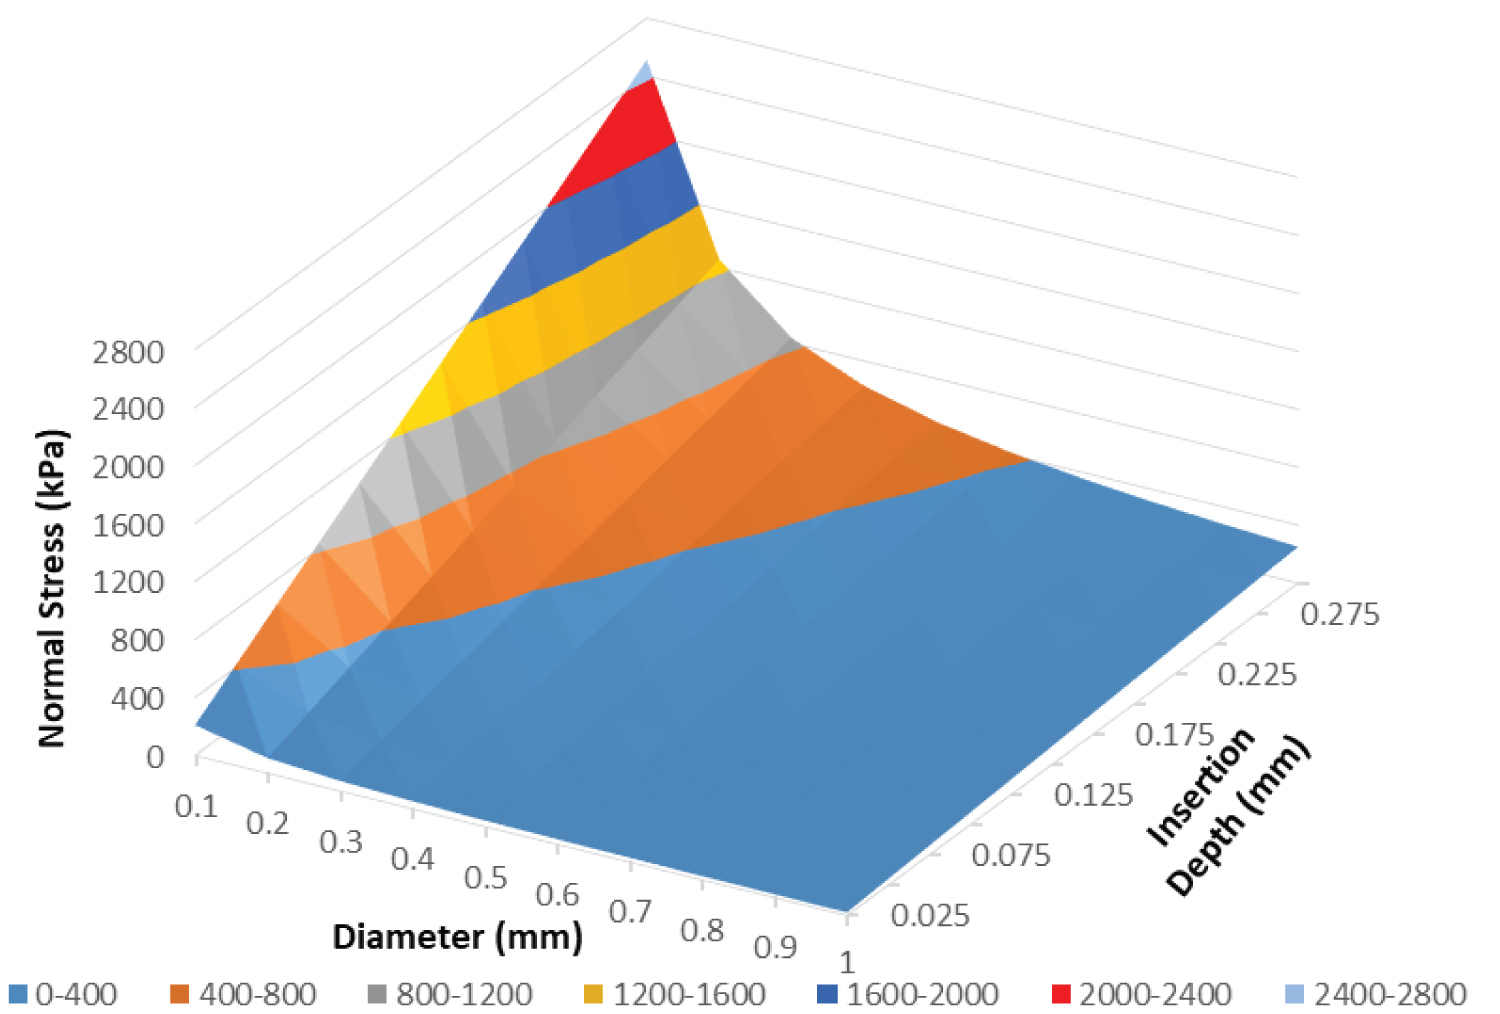 Figure 3: Normal stress surface plot- Normal stress as a function of insertion depth and diameter for human skin with an epidermis elastic modulus of 1000 kPa.
View Figure 3
Figure 3: Normal stress surface plot- Normal stress as a function of insertion depth and diameter for human skin with an epidermis elastic modulus of 1000 kPa.
View Figure 3
Direct relationships are extrapolated from the surface plots for specific monofilaments. Since the 10-gram monofilament is one of the most popularly used, which has a diameter of 0.5 mm, Figure 4 was produced to show the relationship between the contact force and normal stress against the depth of insertion. Figure 4 shows a clear linear relationship for both the contact force and normal stress when grouped by elastic modulus (E). These theoretical solutions were used to validate the FEA results.
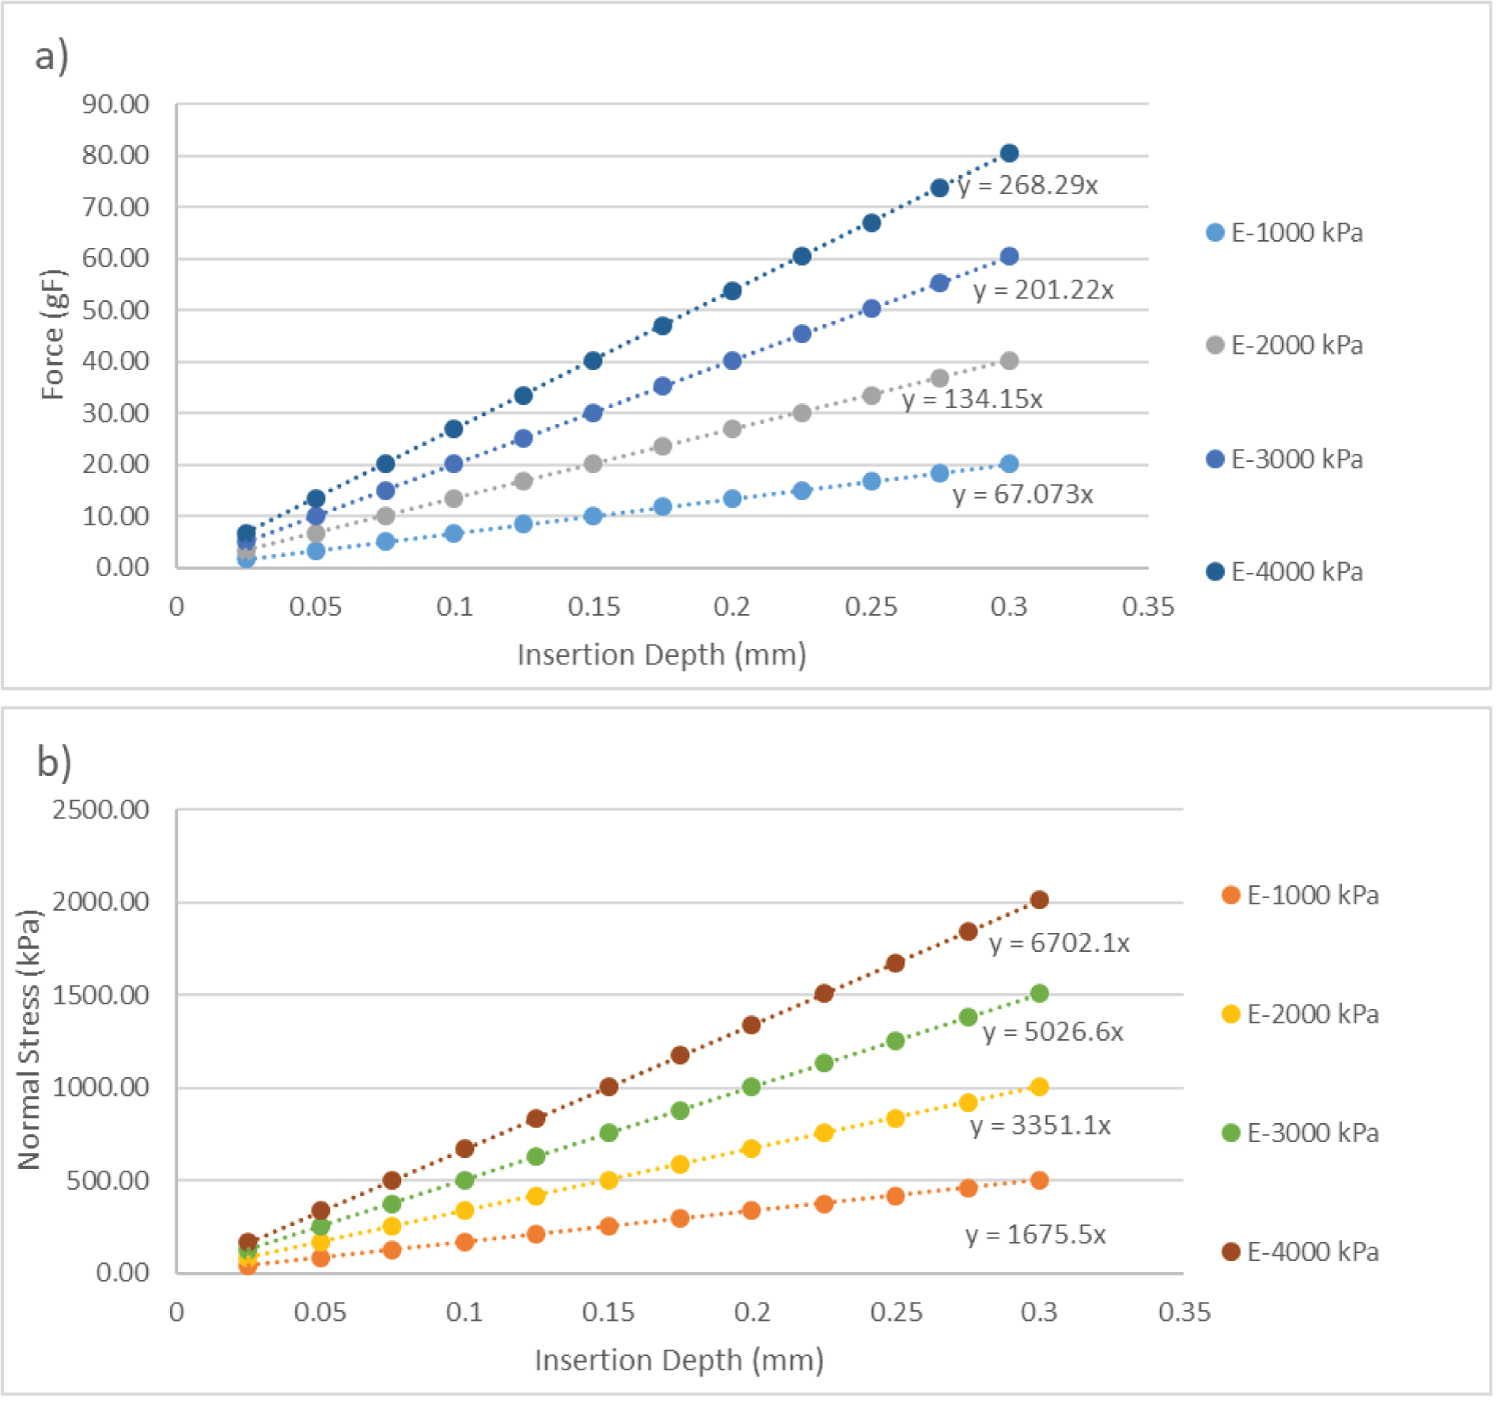 Figure 4: 10-gram Monofilament Contact Theoretical Relationships-Theoretical Contact Force (4a) and Normal Stress (4b) versus Depth Of Insertion for a 10-gram Monofilament with a 0.5 mm diameter.
View Figure 4
Figure 4: 10-gram Monofilament Contact Theoretical Relationships-Theoretical Contact Force (4a) and Normal Stress (4b) versus Depth Of Insertion for a 10-gram Monofilament with a 0.5 mm diameter.
View Figure 4
Before going through all of the FEA results it is important to showcase the H-Adaptive mesh used during the study. Figure 5 highlights the detail of the mesh when the monofilament is applied to the specimen. The H-adaptive mesh refined itself at the areas of contact in order to gain an understanding of how the monofilament affected the specimen. Zooming in reveals smaller mesh elements, which appear unclear in the overall image. Figure 5 also shows how the contact between the two components and the resulting stress required a finer mesh for analysis.
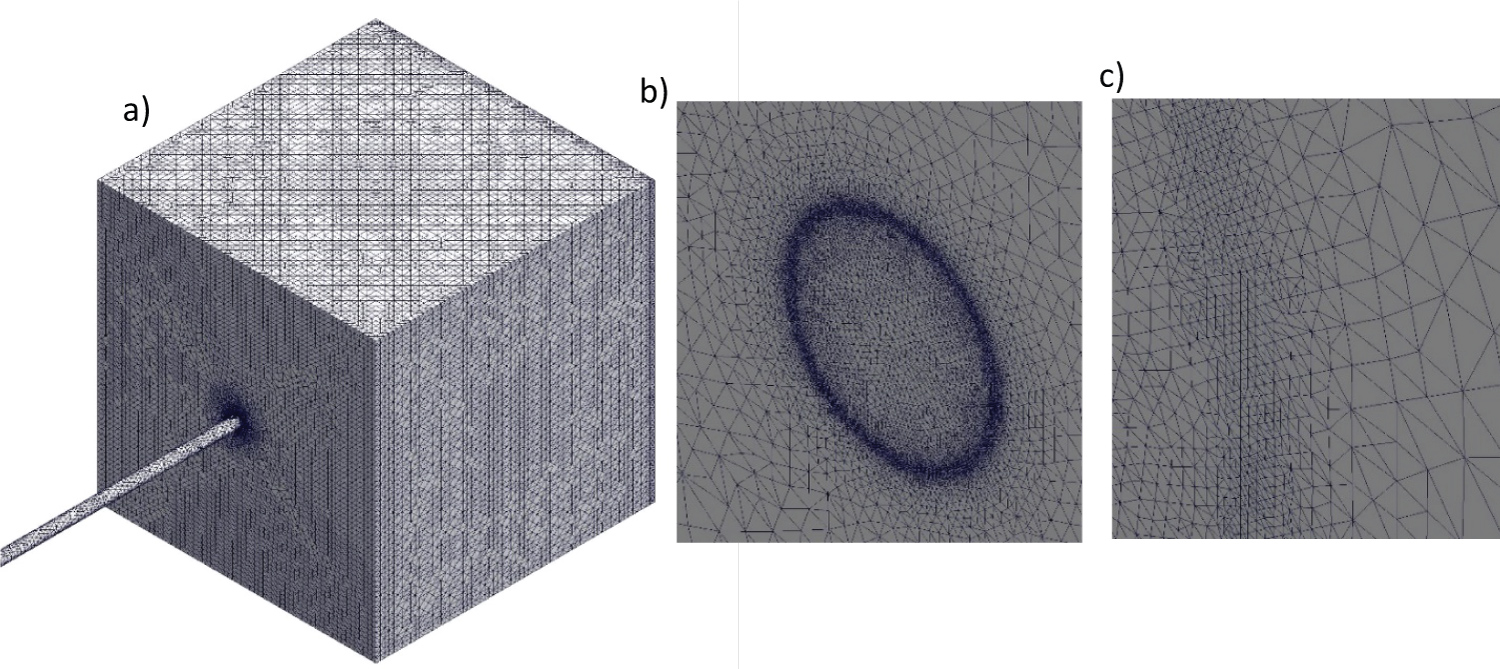 Figure 5: FEA H-Adaptive Contact Mesh- Mesh Utilized for 10-gram Monofilament for 0.600 mm Insertion Depth (a) Large scale view; (b) Medium scale view (c) Small scale view.
View Figure 5
Figure 5: FEA H-Adaptive Contact Mesh- Mesh Utilized for 10-gram Monofilament for 0.600 mm Insertion Depth (a) Large scale view; (b) Medium scale view (c) Small scale view.
View Figure 5
The first FEA results, for the homogenous isotropic model, are depicted in Table 1, which show the contact force and normal stress for a 10-gram monofilament inserted normal to the surface of the sample at an elastic modulus of 1000 kPa. Both the theoretical contact force and normal stress are provided and are used to calculate a percent error against the FEA results. The FEA contact force had an average percent error of 1.97% compared to the theoretical. The normal stress average percent error was 3.32%. Likewise for moduli of 2000, 3000, and 4000 kPa the average percent errors for the contact force where 3.49%, 4.96%, and 6.39%. The corresponding average percent errors for the normal stress where 4.88%, 6.09%, and 7.56%. Also, all 48 simulations for the homogenous isotropic model achieved the 2% strain energy norm criteria in three iterations. Each simulation completed at a value of 1.89%, 1.87%, 1.86%, and 1.86% for each modulus: 1000, 2000, 3000, and 4000 kPa, respectively. Therefore, the FEA is verified for its accuracy.
Table 1: FEA contact force and normal stress for 10-gram monofilament applied normal to the surface. View Table 1
SolidWorks® FEA also produced detailed displacement and stress plots of the results for a 10-gram rated monofilament. Figure 6a and Figure 6b shows the displacement plot created as a result of the contact between the monofilament and specimen when the insertion depth was 0.150 mm, and with a 1000 kPa elastic modulus. This displacement correlated to approximately 10 gF produced as a result of contact. An impact crater formed at the center of contact and extends into the specimen. Likewise, Figure 6c and Figure 6d depicts the normal stress plot. The monofilament was hidden for these plots in order to see the crater formed.
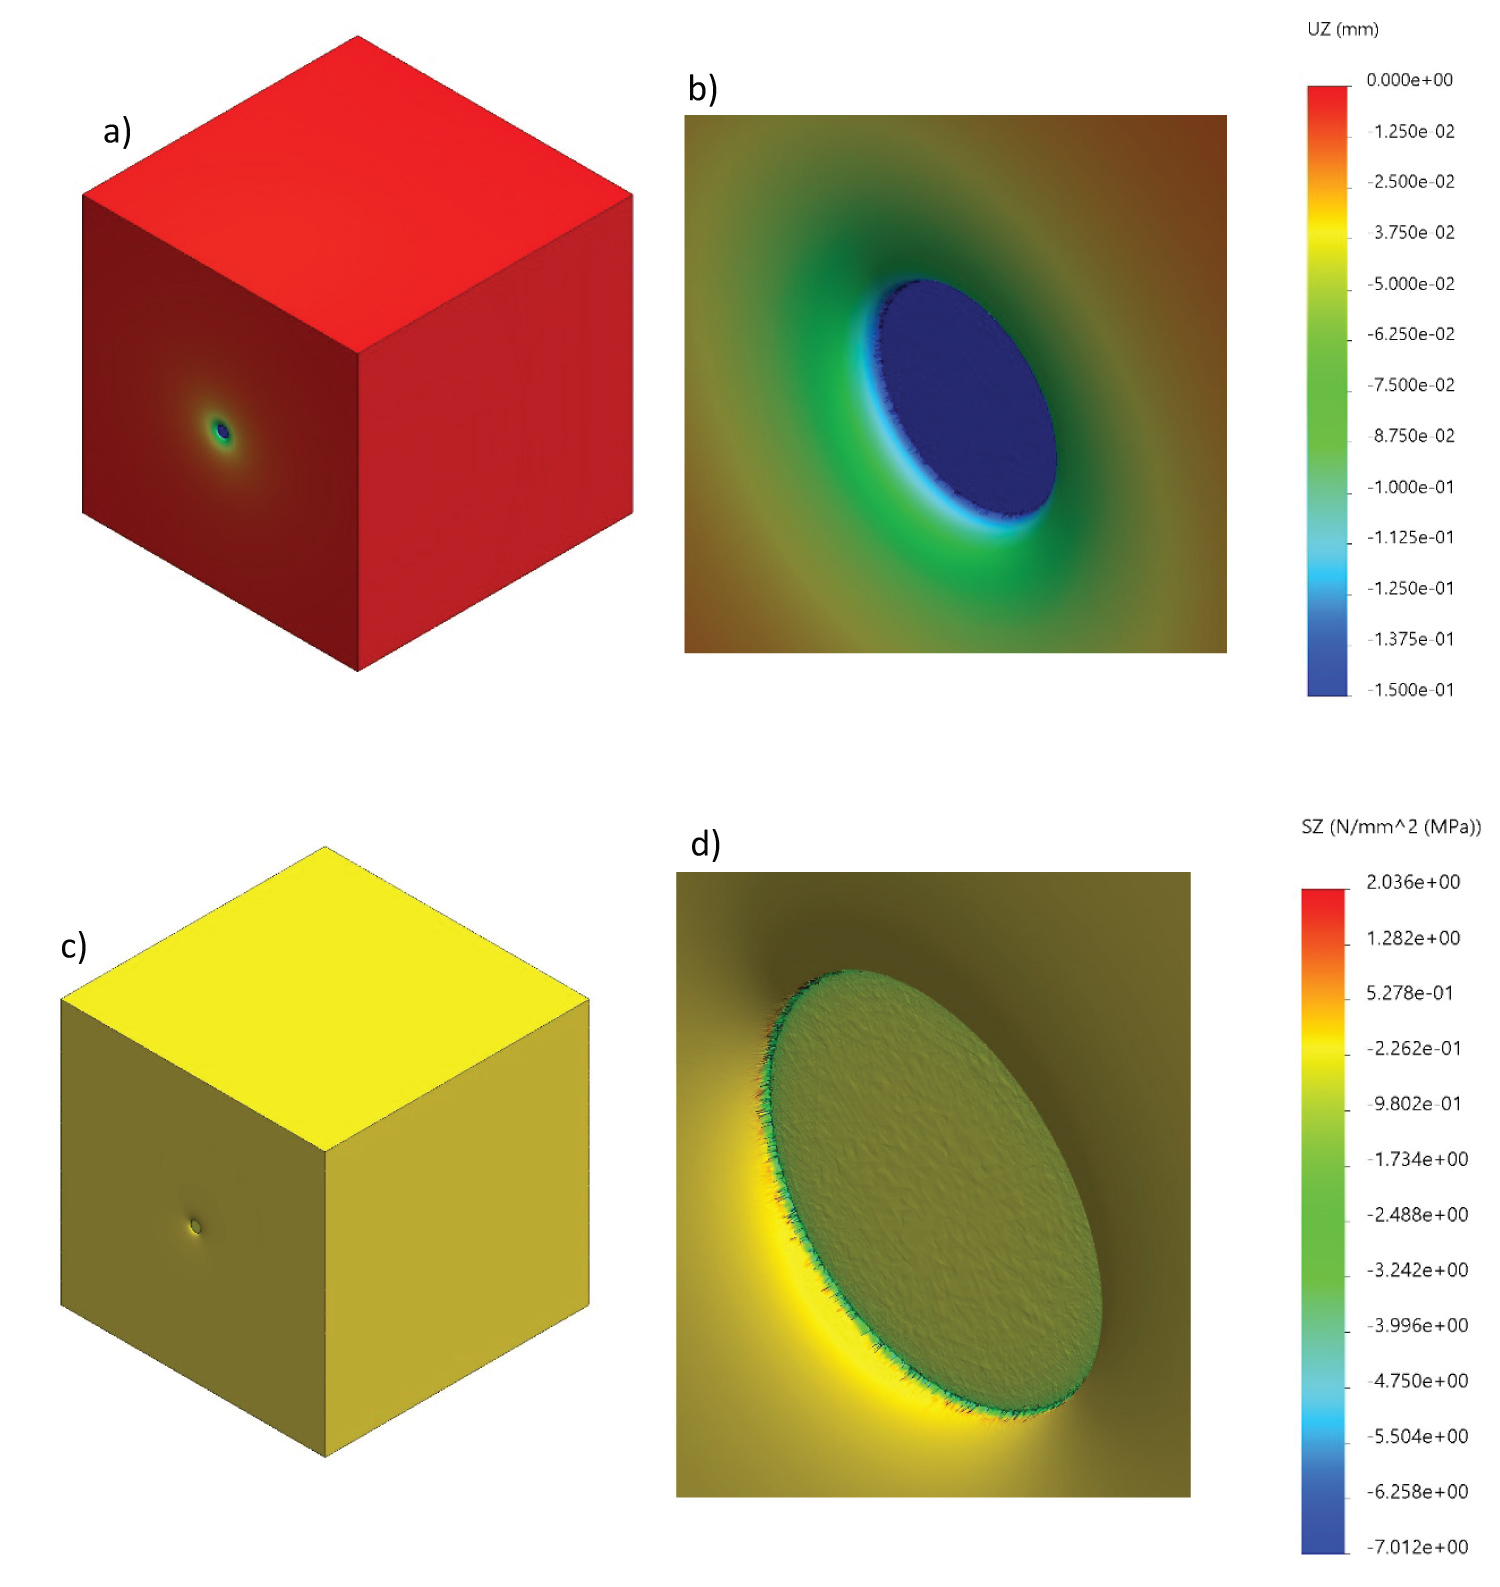 Figure 6: FEA displacement and stress plots- Human skin specimen displacement and normal stress plots for 0.600 mm insertion depth (a) Displacement plot; (b) Displacement plot close-up; (c) Normal stress plot; (d) Normal stress close-up.
View Figure 6
Figure 6: FEA displacement and stress plots- Human skin specimen displacement and normal stress plots for 0.600 mm insertion depth (a) Displacement plot; (b) Displacement plot close-up; (c) Normal stress plot; (d) Normal stress close-up.
View Figure 6
By varying the epidermis and dermis elastic moduli and the insertion depth, the composite homogeneous model yielded 140 total simulations, accounting for 20 different ratios of epidermis to dermis elastic moduli. Contact force and normal stress plots, grouped by dermis modulus, were generated to show the impact of both moduli. Figure 7 shows the contact force relationship for a dermis elastic modulus of 100 kPa and corresponding epidermis moduli. A similar plot, Figure 8, was generated to show the relationship between the normal stress and the displacement for a 100 kPa dermis elastic modulus. Both figures depict a linear relationship between their respective variables in the following format:
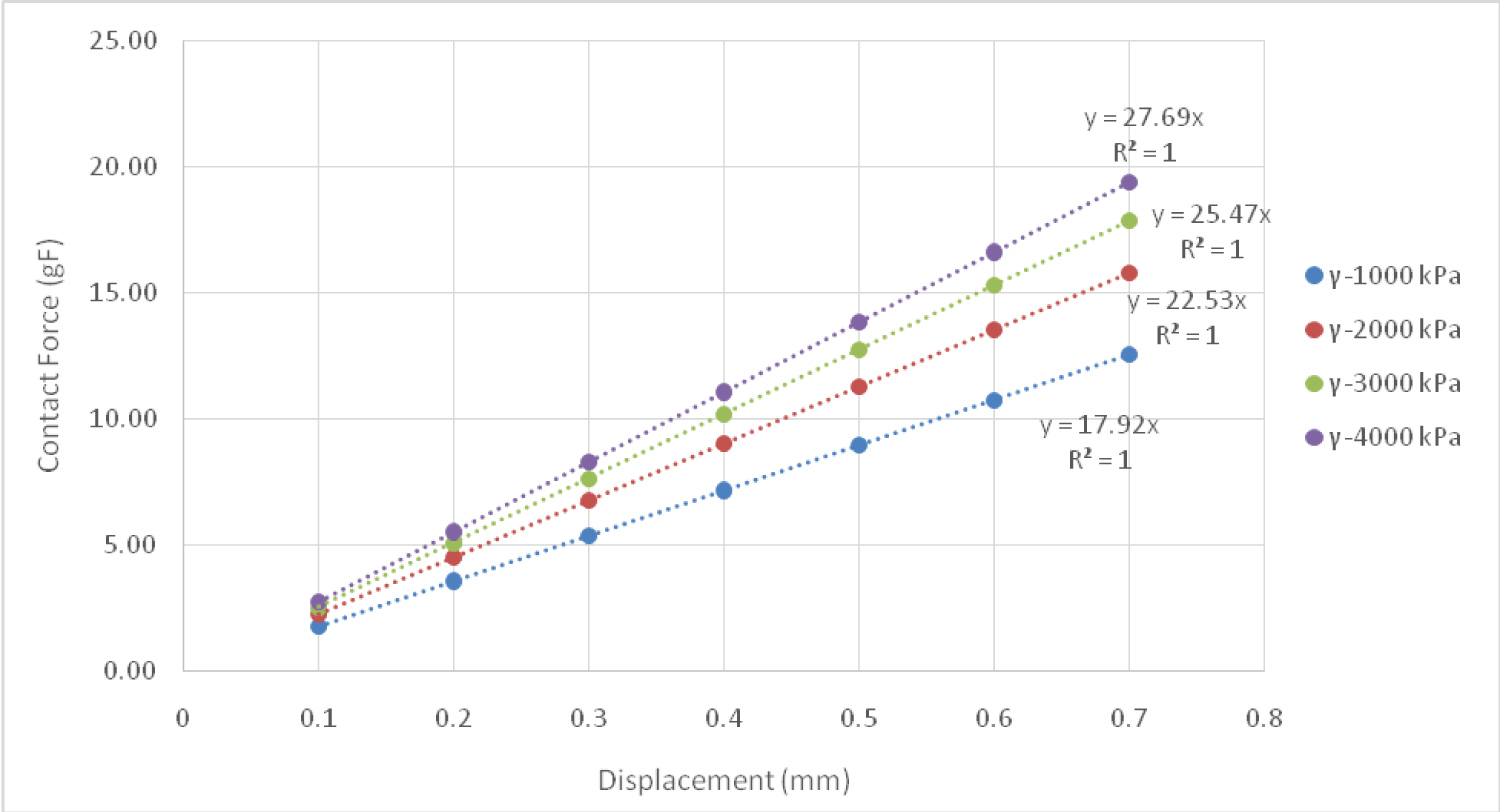 Figure 7: Contact force plot for 100 kPa dermis elastic modulus versus displacement, grouped by epidermis Elastic Modulus (γ).
View Figure 7
Figure 7: Contact force plot for 100 kPa dermis elastic modulus versus displacement, grouped by epidermis Elastic Modulus (γ).
View Figure 7
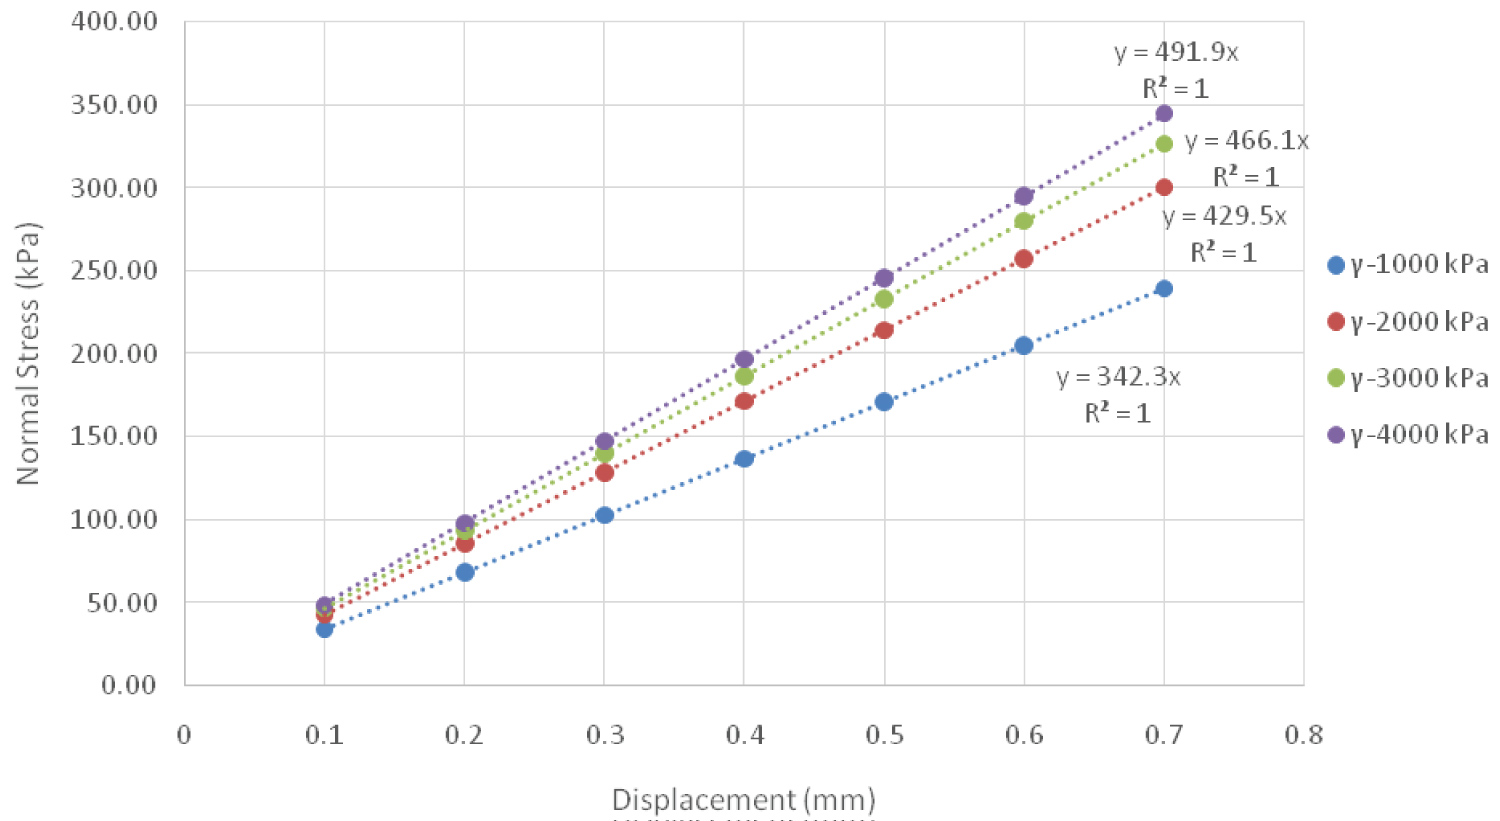 Figure 8: Normal stress plot for 100 kPa Dermis Elastic Modulus Versus Displacement, grouped by Epidermis Elastic Modulus (γ).
View Figure 8
Figure 8: Normal stress plot for 100 kPa Dermis Elastic Modulus Versus Displacement, grouped by Epidermis Elastic Modulus (γ).
View Figure 8
In this equation y is the contact force (gF) or the normal stress (kPa), while δ is the displacement (mm). The y-intercept of these curves was manually set to zero to enforce the fact that at no displacement, i.e. no contact, there cannot be a contact force, nor normal stress. The slope of these lines, coefficient A, can then be further analyzed by taking the value and plotting it against the epidermis modulus. Figure 9 and Figure 10 depict these plots for contact force and normal stress, respectfully.
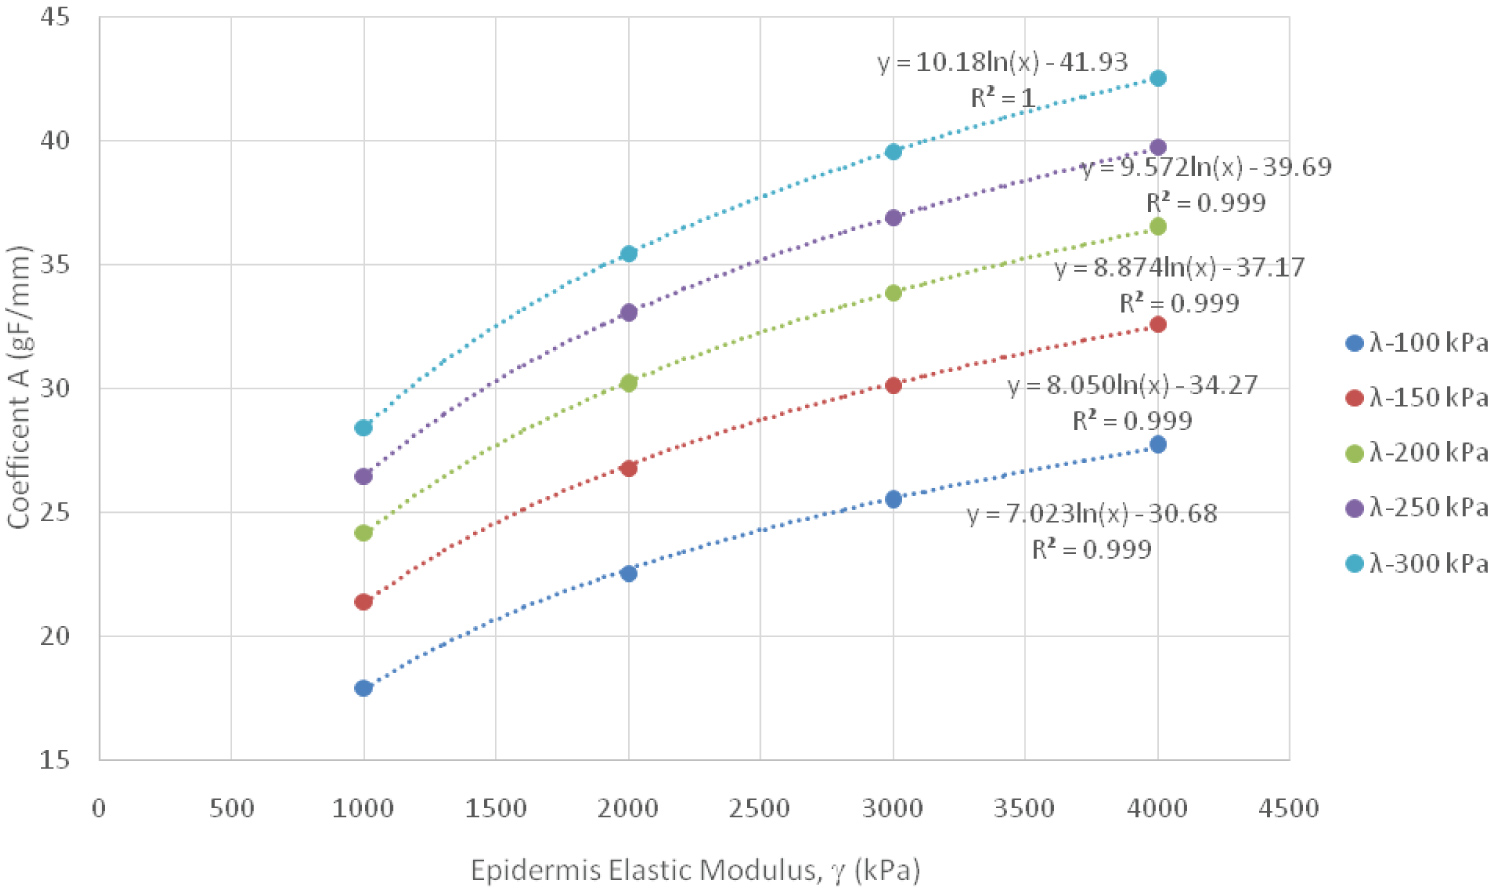 Figure 9: Contact Force Logarithmic Relationship Between Coefficient A and Epidermis Elastic Modulus, grouped by Dermis Elastic Modulus (λ).
View Figure 9
Figure 9: Contact Force Logarithmic Relationship Between Coefficient A and Epidermis Elastic Modulus, grouped by Dermis Elastic Modulus (λ).
View Figure 9
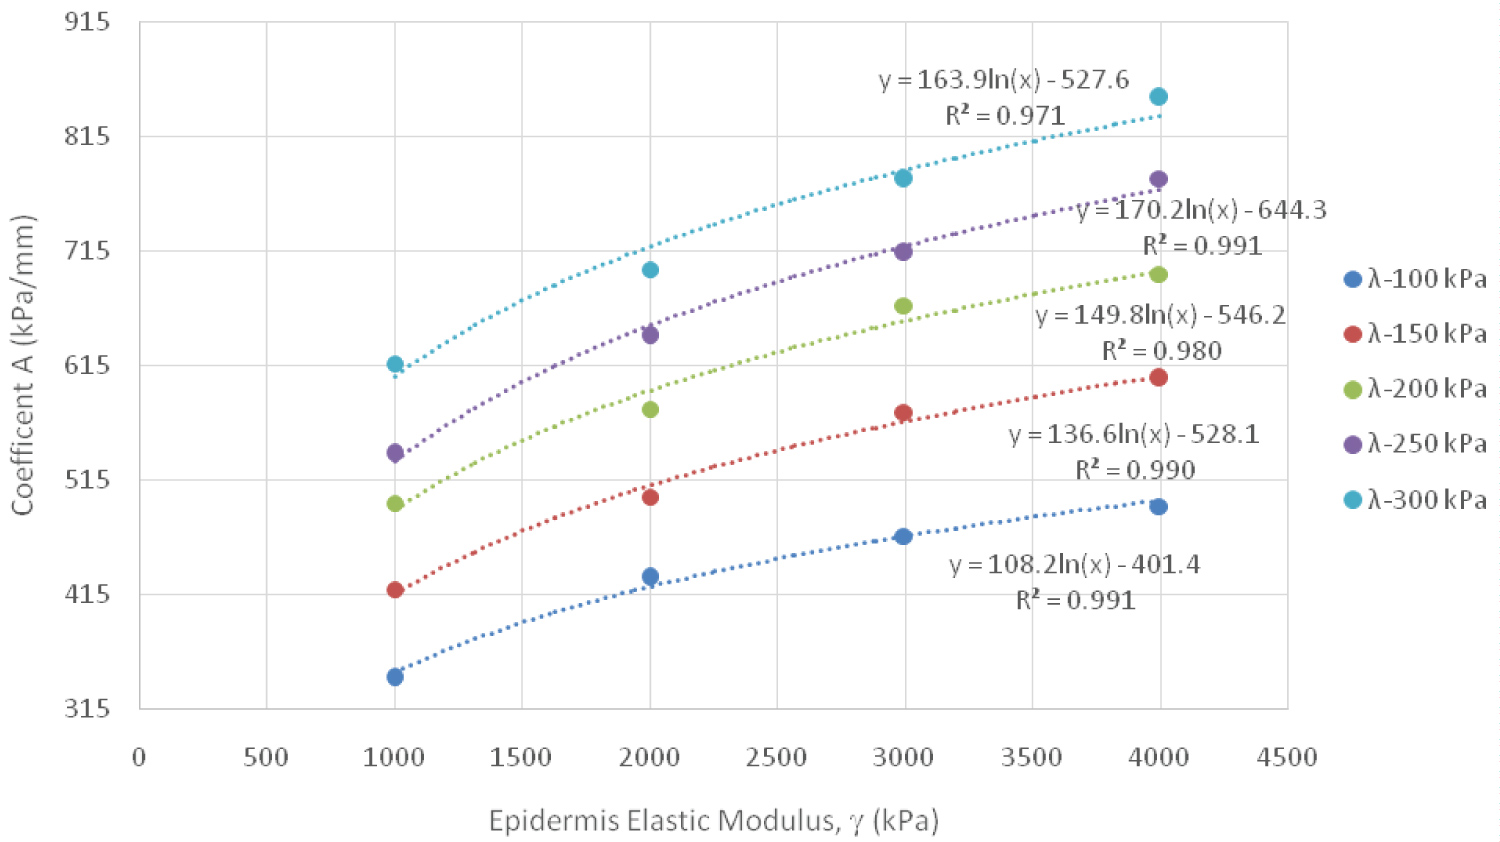 Figure 10: Normal Stress Logarithmic Relationship Between Coefficient A and Epidermis Elastic Modulus, grouped by Dermis Elastic Modulus (λ).
View Figure 10
Figure 10: Normal Stress Logarithmic Relationship Between Coefficient A and Epidermis Elastic Modulus, grouped by Dermis Elastic Modulus (λ).
View Figure 10
Regression analysis was used to understand the relationship between the coefficient and the epidermis modulus; a logarithmic relationship was found to best fit the data. Two additional coefficients, B and C, were then extracted and analyzed. The following equation represents what both of these two additional coefficients, B and C, are equal to.
Coefficients B and C were then plotted against their relative dermis elastic modulus (λ) values to further understand the relationships between these variables with further regression analysis. Figure 11 and Figure 12 show both of these coefficients for contact force and normal stress. The following equation captures these relationships for both coefficient B and C, where K1 and K2 are constants:
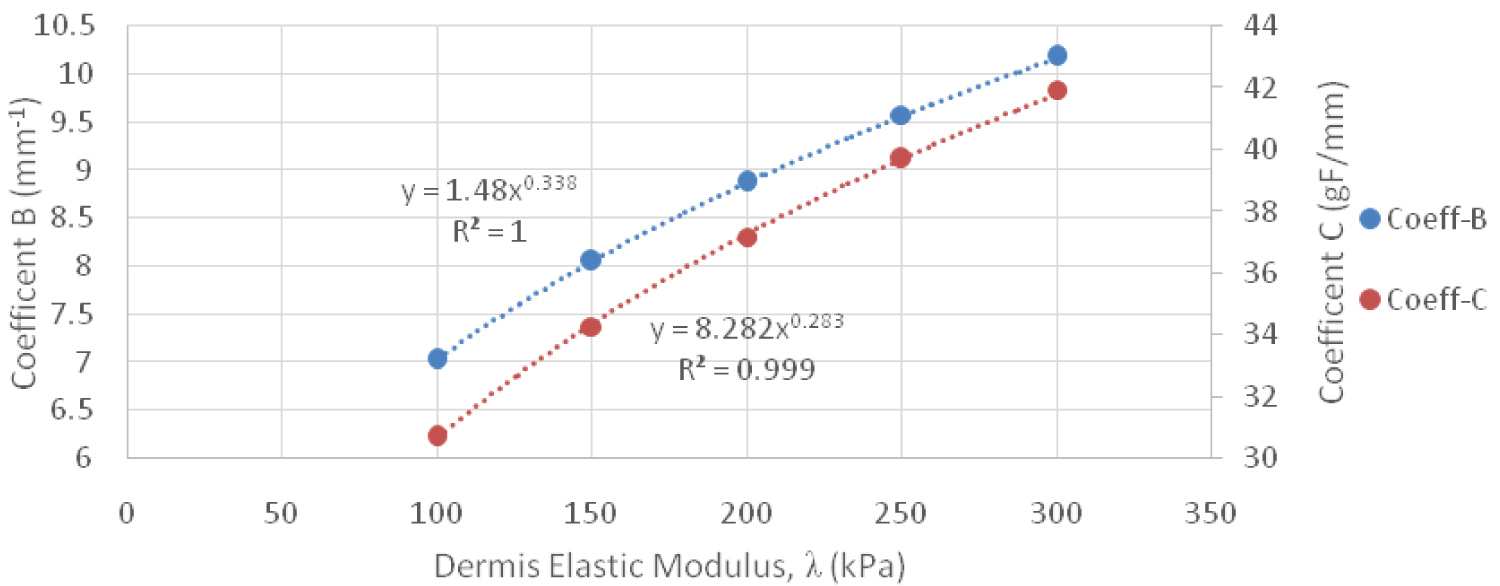 Figure 11: Contact Force Power Relationship between Coefficient B & C versus Dermis Elastic Modulus.
View Figure 11
Figure 11: Contact Force Power Relationship between Coefficient B & C versus Dermis Elastic Modulus.
View Figure 11
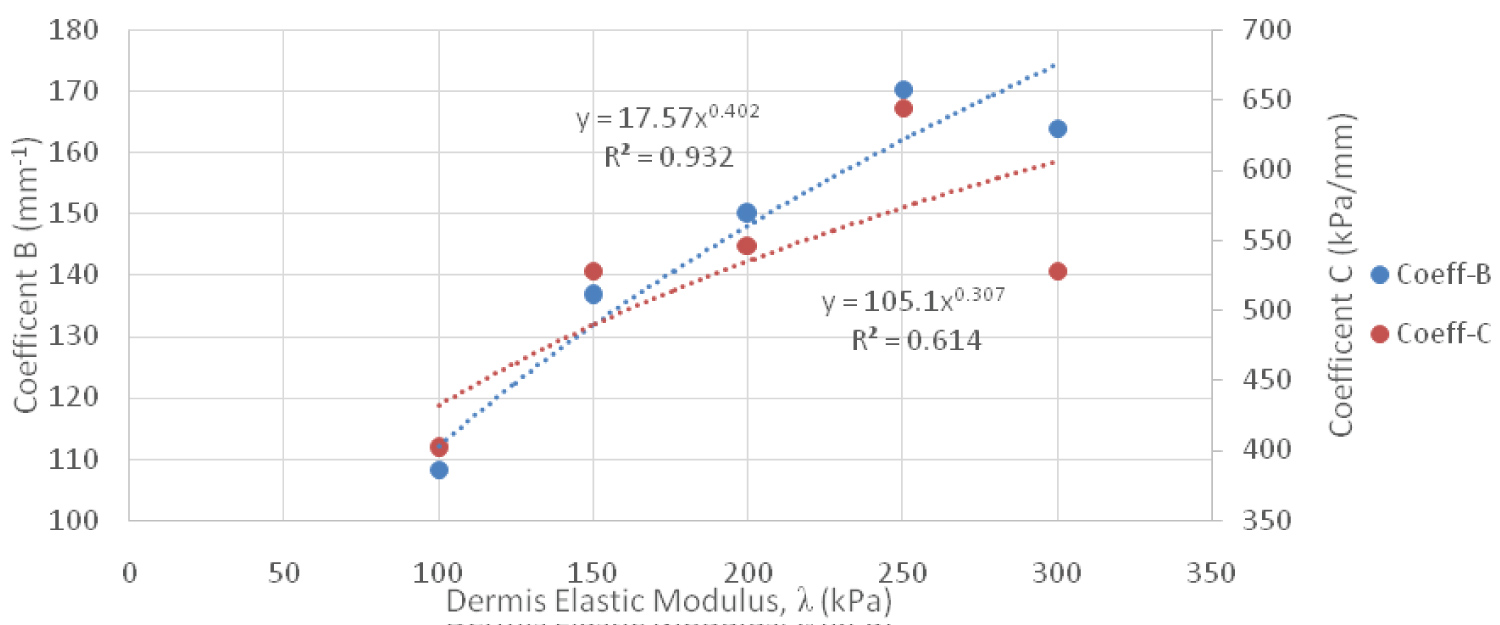 Figure 12: Normal Stress Power Relationship Between Coefficient B & C Versus Dermis Elastic Modulus.
View Figure 12
Figure 12: Normal Stress Power Relationship Between Coefficient B & C Versus Dermis Elastic Modulus.
View Figure 12
All of these equations can be combined together to form empirical equations for contact force and normal stress. The variables of the equations include epidermis elastic modulus, dermis elastic modulus, and displacement. Equation 9 is for the contact force expressed in grams force and Equation 10 is for the normal stress in kPa, where γ is the epidermis elastic modulus. Furthermore, γ and λ are expressed in kPa and the displacement, δ, is expressed in mm. The R2 values for Equation 9 and Equation 10 were approximately 1.
The results foremost showed that an increase in insertion depth yielded greater amounts of contact force and normal stress. Furthermore, when evaluating the theoretical equations from Sneddon, as the diameter became larger the contact force increased, but the normal stress decreased. If the diameter decreased, the area also decreased, which allowed higher stresses to be induced. When using the theoretical equations for the 10-gram monofilament, a linear relationship existed between the contact force and normal stress when evaluated against insertion depth. The more an indenter was inserted into a material the greater the force produced. Likewise, if the force increased, the corresponding normal stress increased, since the contact area did not change its physical shape. However, what is most insightful is how sensitive these equations are to differences in skin elasticity. For an elastic modulus of 1000 kPa it took exactly 0.149 mm of insertion to produce 10 gF when using a properly calibrated monofilament. An elasticity of 4000 kPa required 0.037 mm to produce the same force. The steeper the slope of the curve in Figure 4, the greater the influence that the insertion depth had on the force generated. In some cases, small differences had a large effect on how much force was actually produced. Considering that these monofilaments are supposed to be applied by hand it would be exceedingly difficult to precisely stop applying the monofilament at exactly the right distance, even if the elasticity of the foot is known. It is also worth noting that the material properties of human skin differ from one person to another, which could influence the insertion depth required to obtain a certain amount of contact force. This would make it challenging to get the monofilament to achieve the desired force output.
The homogenous isotropic model performed very well when compared to three different validation checks. Contact force and normal stress were calculated and compared for each displacement against the theoretical contact mechanics equations for elastic moduli between 1000 kPa and 4000 kPa. The percent errors were consistent between all displacements, relative to their respected moduli. For 1000 kPa the percent error was 1.97% and was 6.39% for 4000 kPa when examining the contact force. The normal stress saw percent errors of 3.32% and 7.56% for 1000 kPa and 4000 kPa, respectively. The reason that the results grouped by elastic modulus had approximately the same error was because the displacement is the only parameter that changed between simulations, meaning that the simulation solved the same way regardless of the initial condition applied. This consistency was also seen in the strain energy norm where it was approximately the same for each displacement, for its respected modulus. The strain energy norms were 1.89%, 1.87%, 1.86%, and 1.86% for 1000, 2000, 3000, and 4000 kPa, respectively, which are within the 2% error allowed by the simulation solver.
The justification for using the same mesh settings from the homogenous isotropic model in the composite isotropic model was because of the congruency of the contact force and normal stress to the theoretical contact mechanics and the strain energy norm. The composite isotropic model provided insight into the reaction of human skin on the plantar surface of the foot to a monofilament being inserted noninvasively. After analyzing all simulations for this model, empirical equations were developed that provides insight into the complexities of contact on a composite material. The empirical equations show intricate relationships between the epidermis elastic modulus, dermis elastic modulus, and the insertion depth. Although they can still be classified as linear equations they offer a wide range of outcomes in determining the contact force and normal stress caused by insertion of a 10-gram monofilament. Table 2 highlights the combinations of the three variables to produce exactly 10 grams of force, showing that the range of displacement can vary between 0.235 to 0.559 mm to produce the correct force at specific combinations of epidermis and dermis elastic moduli. Also noteworthy was how much effect the dermis modulus had on the contact force and normal stress produced when compared to the homogenous isotropic model and theoretical contact mechanics. The amount of monofilament insertion required to produce 10 gF in the composite model was between 3.75 to 6.35 times greater than previously determined from the homogenous model. All strain energy norms were between 1.01% and 1.99% and all of the 140 simulations that used the composite model ran between 2-3 iterations using the H-adaptive mesh parameters.
Table 2: Combinations of epidermis, dermis, and displacement to produce 10 gF for composite isotropic human skin model. View Table 2
Ultimately, regression analysis provided a means to understand the behavior of the composite model. This assertion is supported as the R2 value of both empirical equations was approximately 1. However, coefficient C of the empirical equation for normal stress had the poorest relationship with the data, with an R2 value of 0.6143. Nonetheless, this coefficient had little impact on the accuracy of the empirical equation for normal stress. It was abnormal, especially since throughout the study the regression analysis showed significantly stronger correlations when curve fitting the data.
Overall, the theoretical contact mechanics and FEA results indicate that small differences in insertion depth had large effects on the force delivered via the monofilament. FEA simulations are a powerful tool that lets users model the effects of bodies under load, or in this analysis bodies in contact with one another. It can also be used as an iterative process in order to test different combinations of fixtures, loads, and settings to compare results between simulations. Although some clinicians may be able to use a Semmes-Weinstein monofilament accurately and repeatedly, caution must be used when attempting to recreate the correct force delivered over multiple applications of the monofilament.
The greatest limitation with this study was what assumptions had to be present to use the empirical equations developed. They only work with linear elastic material properties and with small displacements. The empirical equations would most likely not work with insertions depths greater than 1 mm as a result of the small displacement assumption; were not evaluated past 0.7 mm in this study. SolidWorks® will alert the user if the simulation needs to be solved with large displacements and for both models in this study it was verified that small displacements were adequate. Also, the fact that both the contact force and normal stress were within an acceptable percent error compared to the theoretical contact mechanics verified that small displacement simulations were appropriate for this study. Furthermore, the percent error could be improved by setting the accuracy parameter to 99%, however this would require more than 2-3 iterations to solve per configuration in each model. This study did not consider a range of elastic moduli for the subcutaneous fat layer and did not consider different thicknesses of the epidermis, dermis, or subcutaneous fat layers.
Although this study assumed that the nylon monofilament and human skin were linear elastic, further studies should consider using nonlinear or hyperelastic variants of the material properties. This would require a nonlinear FEA which could take a long time to set up and find adequate settings. Another area of future work could involve nonlinear dynamic buckling analysis using the work of Russell and White in order to model the buckling behavior of the monofilament when it comes in contact with the skin [28]. The research of Szalai may also be useful for nonlinear simulations [29]. Nonlinear mechanical properties of human skin should be considered for future FEA [30]. It is anticipated that a similar process could be employed to determine empirical equations with the use of nonlinear material properties, or even with additional parameters such as varying the thicknesses of the epidermis, dermis, and subcutaneous fat layers, along with monofilaments with different diameters.
This study sought out to understand how insertion depth, monofilament diameter, and skin material properties affect neuropathy assessment on the plantar surface of the foot. The contact force and normal stress were examined using FEA and were validated using theoretical equations. The homogenous isotropic model simulations performed well compared to theoretical contact mechanics and were shown to be an effective way of validating the mesh settings used for the composite isotropic model. Empirical equations were derived from the results of the composite isotropic model and showcased how the contact force and normal stress are affected by epidermis elastic modulus, dermis elastic modulus, and insertion depth. SolidWorks® Simulation was an effective way of running all 188 simulations and had many useful features that helped model the studies close to real life conditions. Finally, the results indicate that it would be extremely difficult to accurately apply a consistent contact force by hand for assessing neuropathy. The accuracy of the monofilament test is not only subjective of how far it is inserted, but also affected by the elastic modulus of the individual's skin. As such, caution must be taken when using hand applied monofilaments for neuropathy assessment.
The authors acknowledge that all work was performed equally in this study. The authors have used the information from this study to inform a design of a related product under a non provisional patent application. Furthermore, this work was supported by the Edward Via College of Osteopathic Medicine (VCOM) under REAP Award 10307 FY19.
All authors contributed equally towards the writing and revisions of this manuscript.
The authors have used the information from this study to inform a design of a related product under a nonprovisional patent application.
This work was supported by the Edward Via College of Osteopathic Medicine (VCOM) [REAP Award 10307 FY19].