Individuals with Barth syndrome (BTHS) present with decreased activity tolerance and high fatigability. Recent evidence suggests that differences in metabolic function in BTHS negatively impact the production of aerobic energy for activity and maintenance of muscle mass. Recommendations on a metabolically beneficial diet are complicated by selective eating behaviors often seen in individuals with BTHS. While known to be selective eaters with a preference for salty foods, there is limited evidence documenting sodium liking or discrimination in the BTHS population. The purpose of the current study was to 1) Quantify and compare food "liking" across six food categories, 2) Quantify and compare the frequency with which food was eaten in each category in males with and without BTHS, and 3) Conduct a taste test to compare ratings of hedonic liking and intensity of sodium infused liquids and compare the results between males with and without BTHS.
A non-experimental, cross-sectional design was employed which compared the BTHS group (n = 34) to age-matched controls (n = 34). A Food Behaviors and Preferences Inventory was completed by all participants. A structured Chicken Soup Taste Test was conducted to compare ratings of hedonic liking and intensity of sodium infused liquids and compare results between males with and without BTHS.
Males with BTHS were less likely to "like" or eat foods in the fruit, vegetable, protein, and grains & carbohydrate categories of the food inventory. Sodium liking and frequency of consumption was comparable between groups, however sodium infused foods appeared to make up a larger portion of the BTHS diet compared to controls. Results of the taste test suggested that the BTHS group had a slightly higher preference for sodium infused broths compared to the control group, but discrimination abilities were not significantly different.
The study suggests that males with BTHS are able to discriminate sodium levels accurately and have a slightly higher hedonic preference for sodium infused foods compared to their age-matched peers. More research is needed to determine the health implications of a sodium rich diet for individuals with BTHS.
Barth syndrome, Sodium, Food inventory
Barth syndrome (BTHS) is a rare disorder affecting approximately 150-200 living boys and men worldwide [1]. The disorder is X-linked, caused by mutations in the tafazzin (TAZ) gene, located at Xq28. While several different mutations have been identified, the primary defect is a disordered remodeling of cardiolipin, an essential phospholipid in the inner mitochondrial membrane [2]. Defects in cardiolipin remodeling have been shown to increase the number of abnormal mitochondria in cells and impact electron transport chain formation and function [3]. Since heart and skeletal muscle contain high levels of mitochondria that contain cardiolipin, these tissues are most affected in BTHS. As a result, primary complications associated with BTHS are cardiomyopathy and skeletal myopathy.
Clinically, individuals with BTHS present with abnormal fatigability and exercise intolerance that impacts their ability to engage in routine activities of daily living such as participation in recess or physical education class [1]. Evidence suggests that exercise intolerance is due, in part, to a limitation of those with BTHS to generate aerobic energy at the same rate as their unaffected peers [4]. More recent evidence also suggests that those with BTHS appear to preferentially utilize glucose for energy at rest [5] and during exercise [4,6]. In addition, individuals with BTHS have low muscle mass, higher protein breakdown and amino acid imbalances [5,7,8] potentially indicating abnormalities in protein/amino acid metabolism.
These recent insights into the metabolic differences in BTHS have highlighted the clinical importance of considering what foods (or supplements) will provide the best fuel for energy and maintenance of skeletal muscle mass and energy production, as well as what foods may be detrimental to cardiac function. While the dietary needs of boys and men with BTHS have been discussed clinically for years, research on specific dietary recommendations is sparse. Complicating this area of study is the fact that feeding problems and selective eating behaviors are part of the clinical phenotype of BTHS [1,9]. Food refusal, food selectivity, and oral motor difficulties have been identified in approximately 50% of boys with BTHS (ages 3-17), while approximately 70% of families note past or current problems related to gagging or vomiting in response to certain foods [10]. One of the most ubiquitous feeding characteristics discussed amongst the BTHS population is an intense liking of salty foods and a consumption of foods that contain high levels of sodium. These feeding preferences have been substantiated by parent and self-report questionnaires [9], however, there is currently no objective data documenting the sodium preferences or discrimination abilities of males with BTHS. Further insight into sodium preferences in the BTHS population may be clinically important for implementing dietary interventions aimed at increasing aerobic energy or increasing muscle mass in this population.
The purpose of the current study was to quantify the hedonic preference of foods, particularly those high in sodium, in children, adolescents and young adults with BTHS and to determine if differences exist in the frequency with which certain foods were eaten compared to unaffected peers. Specifically, we aimed to (1) Quantify and compare food "liking" across six food categories (Fruit, Salty, Proteins, Sweets, Vegetables, Grains & Carbohydrates) in males with and without BTHS, (2) Quantify and compare the frequency with which food was eaten in these six food categories in males with and without BTHS, and (3) Conduct a taste test to compare ratings of hedonic preference and perceived intensity of sodium infused liquids between males with and without BTHS. Our primary hypothesis was that participants with BTHS would have a significantly higher preference for and consumption of salty foods in daily life and would report a greater liking of salty samples in our structured taste test. We further hypothesized that participants with BTHS would eat salty foods more frequently, and fruits, vegetables, and proteins less frequently, compared to those without BTHS.
A total of n = 68 subjects participated in the study. Thirty four males with BTHS between the ages of 5-34 years old (Mean = 14.9, SD = 7.2 years) were recruited at the Barth Syndrome International Scientific, Medical & Family Conference held in Clearwater, Florida, in July 2014. An age-matched convenience sample of males (n = 34) ages 5-34 (Mean = 15.2, SD = 7.0 years) with no known medical, genetic, or psychological diagnoses were recruited from community centers, schools, and recreation leagues in urban and suburban settings. Twenty two of n = 68 total participants (11 BTHS, 11 Control, 32%) were over the age of 18 and considered adults. All subjects and caregivers providing consent had to be proficient in English to participate.
A cross-sectional design was employed in which the two-groups (BTHS, Control) were compared based on one data collection point. Ethical standards for conduct of research were approved by and monitored by the Institutional Review Board at the sponsoring university. Consent was obtained from all adult participants (18 and older). Child participation required parental consent as well as assent for children over the age of six.
A Food Behaviors and Preferences Inventory (henceforth referred to as the Food Inventory) was developed for the purposes of this study. This inventory was adapted from a liking inventory shared with the authors by Dr. Valerie Duffy at the University of Connecticut [11]. Five foods were identified in each of seven domains: Fruits, Salty foods, Proteins, Sweets, Vegetables, and Grains. Items from each category are listed in (Table 1). Each food item was presented with a picture representing that food or an example of that food type. Next to each food item, subjects were asked to answer two questions: 1) How much do you like this?, and 2) How often do you eat this? Responses to each question were marked on a visual rating scale. A sample item is presented in (Image 1). Subjects had the option to select "never tried" if a specific food item had never been presented to or tasted by the individual. Adult subjects completed this form independently; child subjects completed this form with their parent or primary caregiver.
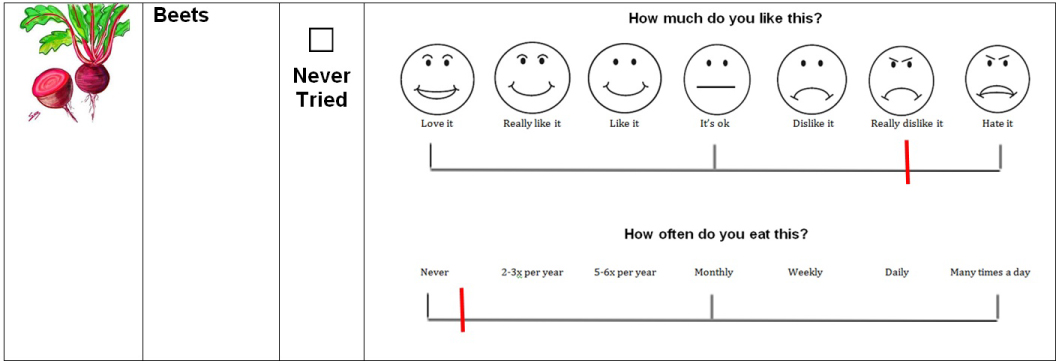 Image 1: Food Inventory sample item. Note: Not to scale.
View Image 1
Image 1: Food Inventory sample item. Note: Not to scale.
View Image 1
Table 1: Food inventory items and results. View Table 1
For scoring purposes, the centimeter scale of a 12-inch ruler was placed below each rating scale to assign a numerical value (0-12) to each rating. Numbers were transformed so that for both scales higher numbers related to greater frequency and liking ratings. After assigning individual liking and frequency ratings to each food item, liking and frequency ratings were totaled by food category (i.e., fruit, salty, protein, sweets, veggies, and grains).
Subjects participated in a structured taste testing session using samples of commercially available chicken broth altered with varying concentrations of salt. Based on methods outlined by Hayes and colleagues [12], subjects reported the intensity of saltiness and overall liking across seven concentrations of sodium diluted in chicken broth. Campbell's® Low Sodium Chicken Broth (Campbell Soup Co, Camden, NJ; 0.02 M sodium) provided the base for all prepared samples. Kosher salt (Cargill, Inc, Minneapolis, MN) was added to the broth to make seven sodium chloride concentrations: 35 mM, 63 mM, 112 mM, 0.2 M, 0.355 M, 0.63 M, and 1.12 M. Broth samples were prepared in batches, stored frozen, and warmed to 40 ℃ using a water bath prior to serving. Samples were served in opaque 3oz plastic cups; each cup was filled with 15 ml of the sodium sample.
Before testing, subjects were asked to rinse their mouths out with warm water for 10-15 seconds. Samples were provided to each subject in the following order: 112 mM, 0.63 M, 35 mM, 0.2 M, 63 mM, 1.12 M, and 0.355 M. After each presentation, subjects rated the degree of liking/disliking for each broth by pointing along a visual scale (Image 2a). Similarly, they were asked to rate how salty they thought each broth was; this saltiness rating scale (Image 2b) utilized pictures and analogies to help subjects understand and communicate their perceptions of the saltiness of the broth samples. The subjects were asked to think of the scale of perceived saltiness with no salt being like a dark night with no sun and extremely salty being like a bright sunny day [13]. After rating each broth sample, subjects proceeded to rinse their mouth with water for approximately 10-15 seconds. The centimeter side of a standard 12 -inch ruler was then used to convert the ratings to numerical values (range 0-10). Higher numbers represented a higher degree of liking by the subjects and a higher perceived saltiness.
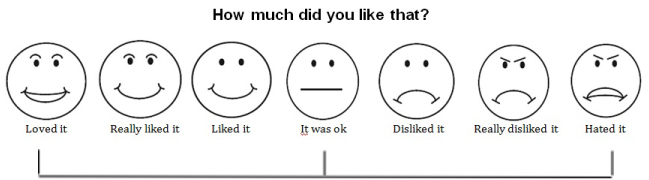 Image 2A: Hedonic rating scale for Chicken Soup Taste Test. Note: Not to scale.
View Image 2A
Image 2A: Hedonic rating scale for Chicken Soup Taste Test. Note: Not to scale.
View Image 2A
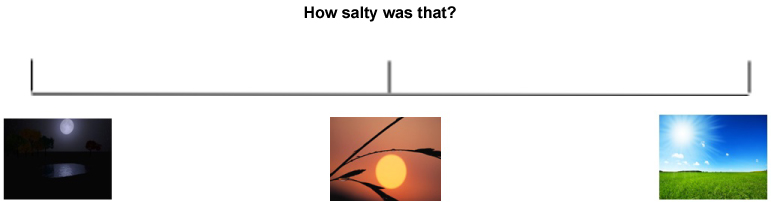 Image 2B: Intensity rating scale for Chicken Soup Taste Test. Note: Not to scale.
View Image 2B
Image 2B: Intensity rating scale for Chicken Soup Taste Test. Note: Not to scale.
View Image 2B
All data was analyzed using the SPSS v24 statistical analysis program. For the Food Inventory, food liking and food frequency were assessed separately. Liking scores for each food item were compared between diagnostic groups using a one-way analysis of variance (ANOVA); the ANOVA was run separately for each food category (e.g., Fruit). This procedure was then replicated for frequency scores. Next, a multivariate analysis of variance (MANCOVA) model was run which included total frequency scores from each food category (dependent variables) and diagnosis (fixed factor); age was entered into the model as a covariate. Chicken broth intensity and saltiness were also assessed using a MANCOVA approach. In each MANCOVA model, ratings across the seven sodium chloride concentrations were entered as the dependent variable, with diagnosis as the fixed factor. Age was entered into the model as a covariate.
By comparing food item scores on the Food Inventory, results indicated that the control group identified liking more foods across a variety of food categories than the BTHS group. Of the 30 foods examined, only three were liked more by the BTHS group compared to the control group: French fries, canned soup/ramen noodles, and processed meat slices such as bologna. While the difference in scores for these three food items did not reach statistical significance, it is worth noting that all three were from the Salty Foods category on the Food Inventory.
Statistically significant differences were noted in the degree to which control males liked foods in the Fruit category (oranges, apples, bananas and tomatoes), Protein category (yogurt, low fat milk), Sweets category (cookies, cakes or pies, doughnuts, and sugary cereals), Vegetable category (carrots and salad), and the Grains & Carbohydrates category (whole grain pasta, whole grain bread). Significance values within all categories are indicated in (Table 1).
Of the 30 foods examined on the food inventory, males with BTHS had higher mean frequency scores on nine items: snack foods such as Doritos, chicken nuggets, French fries, canned soup or ramen noodles, processed meat slices such as bologna, candy, doughnuts, sugary cereals, and white bread. Of these nine foods, only chicken nuggets and French fries (both from the Salty Foods category) were found to be eaten significantly more often by the BTHS group in comparison to the control group.
Statistically significant differences were noted in the frequency with which the control group ate foods in the Fruit category (oranges, apples, bananas, pineapple and tomatoes), Protein category (yogurt, low fat milk), Vegetable category (spinach, carrots, salad), and the Grains & Carbohydrates category (granola). Significance values within all categories are presented in (Table 1).
Results of the initial MANCOVA model supported these findings, indicating that the two groups (BTHS, Control) differed in the frequency with which they ate most foods (F(6,61) = 9.776, p < 0.001, partial ɳ2 = 0.490). Subsequent tests of between-subjects effects revealed significant differences between diagnostic groups in the Fruit category (F(1,66) = 37.7, p < 0.001, partial ɳ2 = 0.364), Protein category (F(1,66) = 22.3, p < 0.001, partial ɳ2 = 0.252), Vegetable category (F(1,66) = 20.2, p < 0.001, partial ɳ2 = 0.235), and Grains & Carbohydrates category (F(1,66) = 8.03, p < 0.01, partial ɳ2 = 0.108). As noted in (Figure 1), Control males were found to eat foods in the fruit, protein, vegetable, and grains & carbohydrate categories significantly more frequently than the BTHS group. Age did not have a significant influence on the MANCOVA model.
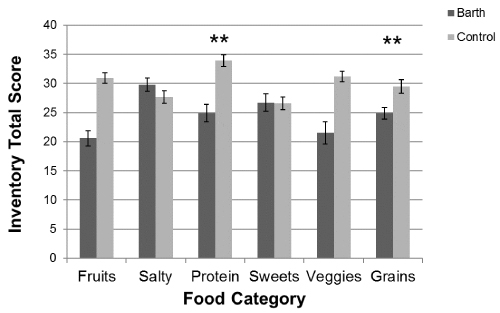 Figure 1: Total frequency scores by category on food inventory.
Note: Higher scores indicate the food is eaten more frequently; **indicates p-values less than 0.01.
View Figure 1
Group differences in hedonic liking of sodium infused chicken broth samples was examined using a MANCOVA analysis. Results, after controlling for age, were found to be non-significant (F(7,56) = 1.69, p = 0.131, Wilk's Λ = 1.865, partial ɳ2 = 0.174), indicating no differences in how the two groups rated their liking of the samples. However, examination of between subjects effects noted significant group differences for the 112 mM sample (p < 0.05) and the 1.12 M sample (p < 0.05); as well as a value approaching significance for the 0.63 M sample (p = 0.085). As noted in (Figure 2), the BTHS group had higher rating scores, indicating greater liking, for each of these samples. Age had no statistically significant effect on the multivariate model.
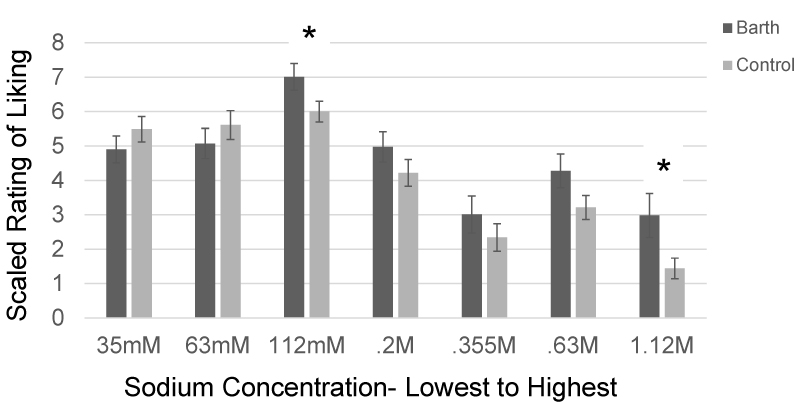 Figure 2: Chicken broth taste test: Results for Hedonic Liking.
Note: *indicates p-values less than 0.05; scale ranged from 0-10 with 10 indicating the greatest liking.
View Figure 2
We also examined group differences in rating of sodium intensity on the Chicken Soup Taste Test using a MANCOVA model. Results for the model were found to be non-significant, even after controlling for age (F(7,56) = 0.604, p = 0.75, Wilk's Λ = 0.075, partial ɳ2 = 0.070). These results suggest that there were no differences in how the two groups rated the intensity of the salt concentrations (Figure 3). Despite rating the samples in a random order, subjects in both groups were generally able to rate which samples had higher sodium levels. Similar to the previous analysis, age had no statistically significant effect on the multivariate model.
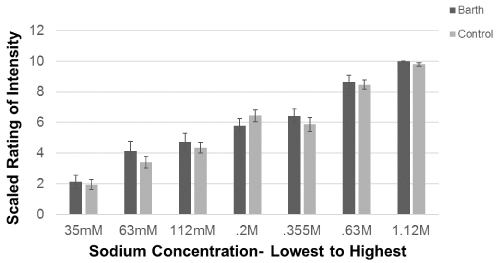 Figure 3: Chicken broth taste test: Results for intensity ratings.
Note: *scale ranged from 0-10 with 10 indicating the most intense concentration.
View Figure 3
Multiple factors influence the ingestion of sodium and the preference for salty foods. The present study focused on comparing the hedonic preference of sodium in individuals with and without BTHS, and to better understand dietary preferences in this population. One hypothesis for this study was that participants with BTHS would report a greater liking of salty samples on the sodium taste test; this hypothesis was partially supported by our findings. BTHS participants had higher mean liking scores at the five highest sodium concentrations, however the overall model failed to reach significance. When group differences were examined separately for each sodium level, statistically significant differences were identified and certain trends emerged which are worth considering. First, both groups rated the 112 mM sodium sample as their most preferred sample. This is unsurprising since the 112 mM sodium chloride concentration was one of the two samples in our study (the other one being the 0.2 M sample) that best approximated levels found in regular-sodium soups. This range of sodium concentrations seems to be within the scope that most individuals find appealing. Interestingly, the BTHS group liked this sample significantly more than the control group, supporting prior subjective reports that individuals with BTHS have a strong preference for commercially available foods that are higher in sodium. Individuals with BTHS also showed stronger liking for the higher sodium-concentrated samples, with the highest sodium-concentrated broth sample (1.12 M) significantly more appealing (or less disgusting) than the control group. Again, this finding lends support to previous subjective reports of some individuals with BTHS putting large amounts of salt or salty condiments on their food which most people would find repulsive [9]. Overall, the trends in this data suggest that individuals with BTHS liked higher concentrations of sodium in these broths however, our full model failed to reach statistical significance. This may have been due to the inclusion of lower-sodium broths (35 mM, 63 mM) in the taste test which were more preferred by the control group. Failure to reach statistical significance may also have been due to the small sample size within each group. Effect sizes for this analysis were in the moderate range, suggesting that group differences may have been detected with a larger number of subjects.
Another aspect of this study looked at differences in taste discrimination between the BTHS group and the control group. Previous research has indicated that high sensitivity to bitter compounds may predispose individuals to be more sensitive to changes in sodium concentrations, as well as have greater hedonic liking and consumption of high sodium foods [12]. Since individuals with BTHS have been shown to be highly sensitive to the bitter compound phenylthiocarbamide (PTC) [10], we hypothesized that the BTHS group would be more accurate at discriminating different levels of sodium chloride compared to the control group. This hypothesis was not supported. Both groups in our study were able to accurately rank broth concentrations using the visual analog scale; no between group differences were found. Since this study did not test for PTC sensitivity, it is impossible to determine if those individuals with PTC super sensitivity were more accurate at discriminating sodium concentrations compared to those with lower sensitivity; future studies should explore these relationships within the BTHS population.
Interestingly, while previous research has highlighted a preference for salty, cheesy, foods in males with Barth syndrome [9], the results of this study show that BTHS participants did not report liking salty foods significantly more than their non-affected peers. However, salty foods were the most frequent food category consumed by the BTHS participants and, as a consequence, do appear to form a larger part of the BTHS diet. In particular, chicken nuggets and French fries were eaten much more frequently (reaching statistical significance) by participants with BTHS as compared to controls. This is consistent with previous literature and family reports of dietary preferences [9].
As part of this study we also hypothesized that BTHS participants would eat fruits, vegetables, and proteins less frequently compared to the control participants. This hypothesis was fully supported; in addition, BTHS males were found to eat significantly fewer foods in the Grains & Carbohydrates category. Overall, the dietary profile of the BTHS participants in our study appears to be lacking in diversity of food types and textures. In addition, our findings demonstrate that individuals with BTHS eat most foods less frequently than their peers in the control group, suggesting an overall reduced intake. Reduced food intake is not an unexpected finding since BTHS individuals have slower growth, reduced muscle mass and early fatigability and therefore have comparatively low energy requirements [1]. The motor act of eating (e.g., chewing, using cutlery) and meal preparation (for adults) can also be difficult for BTHS individuals. It is therefore unsurprising that BTHS participants tended to like and chose those foods that are easier to eat and prepare and have a higher energy density (french fries, sweets, white bread, doughnuts, processed meat, chicken nuggets) than foods that are bulkier and harder to cut up and chew, such as whole grain pasta, fruit, and vegetables. While processed foods are often higher in salt, given the similarities this study found in hedonic liking of salt between BTHS and controls, it maybe that foods are chosen for other properties rather than just their salty taste.
Taken together, the results of this study suggest that males with BTHS and matched controls are able to discriminate sodium levels accurately, but that males with BTHS have a slightly higher hedonic preference for sodium infused foods (and broth) than their age-matched peers. These findings support previous reports from BTHS individuals (and their parents) of a high consumption of salty foods (e.g., processed cheese, chicken nuggets, French fries) and addition of salt or salty condiments to other food items [9]. Results also suggest a limited dietary repertoire in BTHS that includes strong dislike of foods from a variety of food categories. While the specific mechanisms for these patterns of hedonic preference and food rejection remain unclear, there is the possibility that BTHS may confer increased susceptibility to diseases that affect oral or olfactory sensation and food behavior. Specifically, neutropenia, which is common in BTHS [1], often manifests as a broad susceptibility to bacterial infections. Infections of the ear, nose, and throat, which are often implicated in chronic neutropenia [14,15], have the potential to affect orthonasal and retronasal olfaction, and broadly influence food related behaviors and flavor perception [16]. Symptoms associated with chronic neutropenia also include a general feeling of malaise, ulcers located on the mucous membranes of the mouth, and gum sensitivity, all of which may impact desire to eat and food selectivity [17]. Mechanisms linking neutropenia in BTHS to food preferences and rejection, while still unclear, warrant further investigation. However, there are also many other variables that affect food choice. In younger children in particular, parental influences affect access to food and is an important determinant in the frequency and type of food eaten [18-19]. Future research into the dietary needs and feeding behaviors of the BTHS population will benefit for a multidisciplinary team which can examine issues using a genetic, metabolic, and bio-psychosocial lens.
In considering future dietary recommendations for the BTHS population, there are several issues to consider. With regards to salt intake, for a number of decades it has been recognized that a high intake of dietary salt is a key factor in the development of high blood pressure, which in turn is implicated as a cause of stroke and cardiovascular disease in adults. While there is a linear relationship between a reduction in dietary salt and reduction in blood pressure, there is some debate about the link between dietary sodium intake and more general health outcomes [20-22]. Current research suggests that while the effect of dietary salt reduction on blood pressure in childhood is small, the sustained effect of this throughout childhood and adolescence will translate to preventing hypertension and subsequent diseases that manifest later in life [23]. At this time it is unclear whether these are important implications for BTHS individuals. Short term, there is a need to examine whether a high sodium diet has the potential to exacerbate any of the existing cardiac problems associated with this condition or contributes in any meaningful way to metabolic performance. As the life span of individuals with BTHS continues to lengthen, with more individuals now living into their 30's, 40's and even 50's, there is a concurrent need to assess the long term impact of a high sodium diet on this specialized group. There is also the possibility that since hypotension occurs in some individuals with BTHS [4], consumption of high levels of sodium could be an innate attempt at vaso-vagal regulation; however this hypothesis is yet to be tested. In summary, more research is required to understand the impact of sodium on individuals with BTHS and if salt should be limited in the BTHS diet.
If there is no logical reason to reduce salt in the BTHS diet, then it is worth considering whether salt can be a useful taste enhancer for this group of individuals who generally have a restricted repertoire of foods eaten. Assuming that the total caloric consumption of BTHS individuals will be lower than the typical population, it may be important for the calories that are consumed to be ones that will result in the greatest amount of energy. Based on the work of Cade and colleagues [4,5] foods that are high in protein and complex carbohydrates may need to comprise a higher percentage of total foods eaten. In order to get individuals with BTHS to eat these foods, they may need to be presented in conjunction with sodium enhancers in order to reduce the likelihood of rejection.
The group sample size used in this study was relatively small, but it reflects ~1/5 of the world's known living population of males with Barth syndrome, so we feel that it offers a representative sample with which findings can be generalized. Our study did, however, include a wider age range than previous studies examining taste preferences in BTHS. While our sample-matching process should have accounted for group differences based on age, we also accounted for the effects of age within our statistical models. In both analyses, age had no significant effect, suggesting that rating scores did not differ between groups based on subject age.
This study provides some support for prior clinical and family reports of a high hedonic preference for salty food in males with BTHS. Future efforts to enhance the dietary repertoire of BTHS individuals should take into account these preferences while also considering emerging metabolic research in order to maximize maintenance of skeletal muscle mass and energy production in this population.
This study was funded by an Idea Grant from the Barth Syndrome Foundation (to SR). We would like to acknowledge Shelley Bowen and Michaela Damin for their assistance with subject recruitment and scheduling. We would also like to thank the individuals with and without BTHS and their families who participated in this study.
All authors listed above contributed to the generation of this manuscript and the design and conduct of the associated study.