Landfill area is one of developing countries' most common anthropogenically contaminated sites. The pressure of urbanization has led to increased waste generation in major cities, commonly deposited in landfills; hence, heavy metals contaminations are closer to the human environment than ever. The study assessed the environmental risk of Arsenic (As), Cadmium (Cd), Zinc (Zn), Manganese (Mn), Copper (Cu), Colbat (Co), Cranium (Cr), Nickel (Ni), and Lead (Pb) in an abandoned landfill system and health-related risk using United State Environmental Protection Agency model. The Concentration of the elements descended as follows; Mn > Zn > Cr > Pb > Cu > Ni > Co > As > Cd and exceeded the WHO permissible limit. The Enrichment factor (EF) and potential ecological risk (ER) indicated no enrichment and low risk for all the elements except Cd (3.67, 426), with moderate enrichment and very high ecological risk. The hazard index (HI) value of the elements indicated no significant risk of non-carcinogenic effect for both Adults and Children except for Mn in Children with a value of 1.69 × 100; however, the HI value of the elements descended as; Co > Mn > Zn > As > Cd > Cu > Pb > Ni > Cr for adult and Mn > Cd > Co > Cr > As > Zn > Pb > Cu > Ni for children. The total carcinogenic risk (TCR) value of the toxic metals descended as Ni > Cd > Cr > As > Pb for both adults and Children, while the metals showed no carcinogenic to acceptable risk to humans. The PCA indicated that the source and distribution of the elements are lithogenic and anthropogenic influences. Engaging the environment through sustainable practices will ensure efficient waste disposal and management.
Health risk assessment, Environmental risk assessment, Landfill, Carcinogenic metals
Solid waste management (SWM) remains challenging in many developing countries, including Nigeria. This challenge can be attributed to the ever-growing population, demand for urbanization and industrialization, inefficient utilization of resources, and poor governance. According to the World Bank Report [1], the amount of municipal solid waste (MSW) generated across South Asia, Latin America, and Sub-Saharan Africa will double or triple by the year 2050, making up 35% of the global MSW. MSW is among several human activities that have exposed the environment to many toxic substances [2], causing the various degree of impact on soil [3,4], water [5-7], air [8,9], and not excluding human [10,11]. Waste generated in many urban areas of Nigeria comprises several materials and by-products [12,13] capable of releasing toxic agents such as lead, cadmium, mercury, cobalt, arsenic, and other toxic metals into the environment [14].
In Nigeria, the most used method of waste disposal is through the landfill system due to its simplicity and least cost of maintenance [15]; however, this method easily causes the release of toxic substances into the environment. Landfills or dumpsites remain one of the most common human-induced contaminated sites in many developing countries, including Nigeria; hence, toxic substances (such as carcinogenic heavy metals) are closer to the human environment than ever. This is generally due to poor landfill management and leachate contamination prevention, and some are cited close to the living environment, which is of significant concern to public health.
Reduced soil quality due to heavy metals contamination poses a risk to human health and the environment [16-18] due to their toxicity, even at low Concentration, environmental persistence, and bioaccumulation capacity [19]. Heavy metals can be transferred into the human body through skin contact (derma absorption), consumption of contaminated food (ingestion), and breathing (inhalation) [20]. Several studies have been conducted to estimate the magnitude of heavy metals in the environment and their potential risk to human health [21-26]. Management of environmental pollutants can be initiated through regular quantification of the environmental load of the pollutants [19]. According to Tanee and Eshalomi [27], the Concentration of heavy metals in the soil is a vital assessment to ascertain the risk level of the environmental medium and its status. Therefore, quantifying the heavy metals in the soil around and within the anthropogenically impacted area is essential and can help provide appropriate remedial measures [13,28]. Due to the inter-relation between human and their environment, there is a great possibility that the presence of pollutants in the environment can find its way into the human system through various means; therefore, risk assessment to quantify the Concentration of the pollutant in the environment should also consider the human exposure and risk factor. Health and environmental risk assessment of pollutants considered the potential adverse effects on the environment and human wellbeing based on the Concentration of the pollutants in the environment.
Aside from the use of physical, chemical, and biological parameters to determine the contamination/pollution status of heavy metals in the environment, various phenomena have been developed to determine the heavy metals risks and status in the environment and human risk [24,29,30]. Recently, the pollution status of the environmental mediums has been assessed through robust parameters such as contamination factors (CF), geo-accumulation indexes (Igeo), and enrichment factors (EF) [31]. Similarly, human health risk is assessed through cancer risk (CR) and hazard index (HI) parameters as a means to ascertain the possible carcinogenic and non-carcinogenic risks to humans, respectively [24].
The dumpsites are located within the Obio/Akpor Local Government Area of Rivers State, a maritime state in the southern geopolitical zone of Nigeria. It is located between latitudes 4°30'0''N and 5°30'0''N and longitude 6°30'0''E and 7°30'0''E. The landfill is located along the Eagle Cement Factory off the Rumuolumeni road, which housed both abandoned and active dumpsites. The abandoned dumpsite was selected for the study, located on the coordinate 4°48'23.4"N and 6°56'35.6" E (Figure 1). The dumpsite was abandoned in 2014 after 12 years of establishment, and it is about 200m long and 150 m wide with residential buildings and mechanic workshops scantly situated around the landfill. The Rivers State Environmental Sanitation Authority is currently using the active dumpsite.
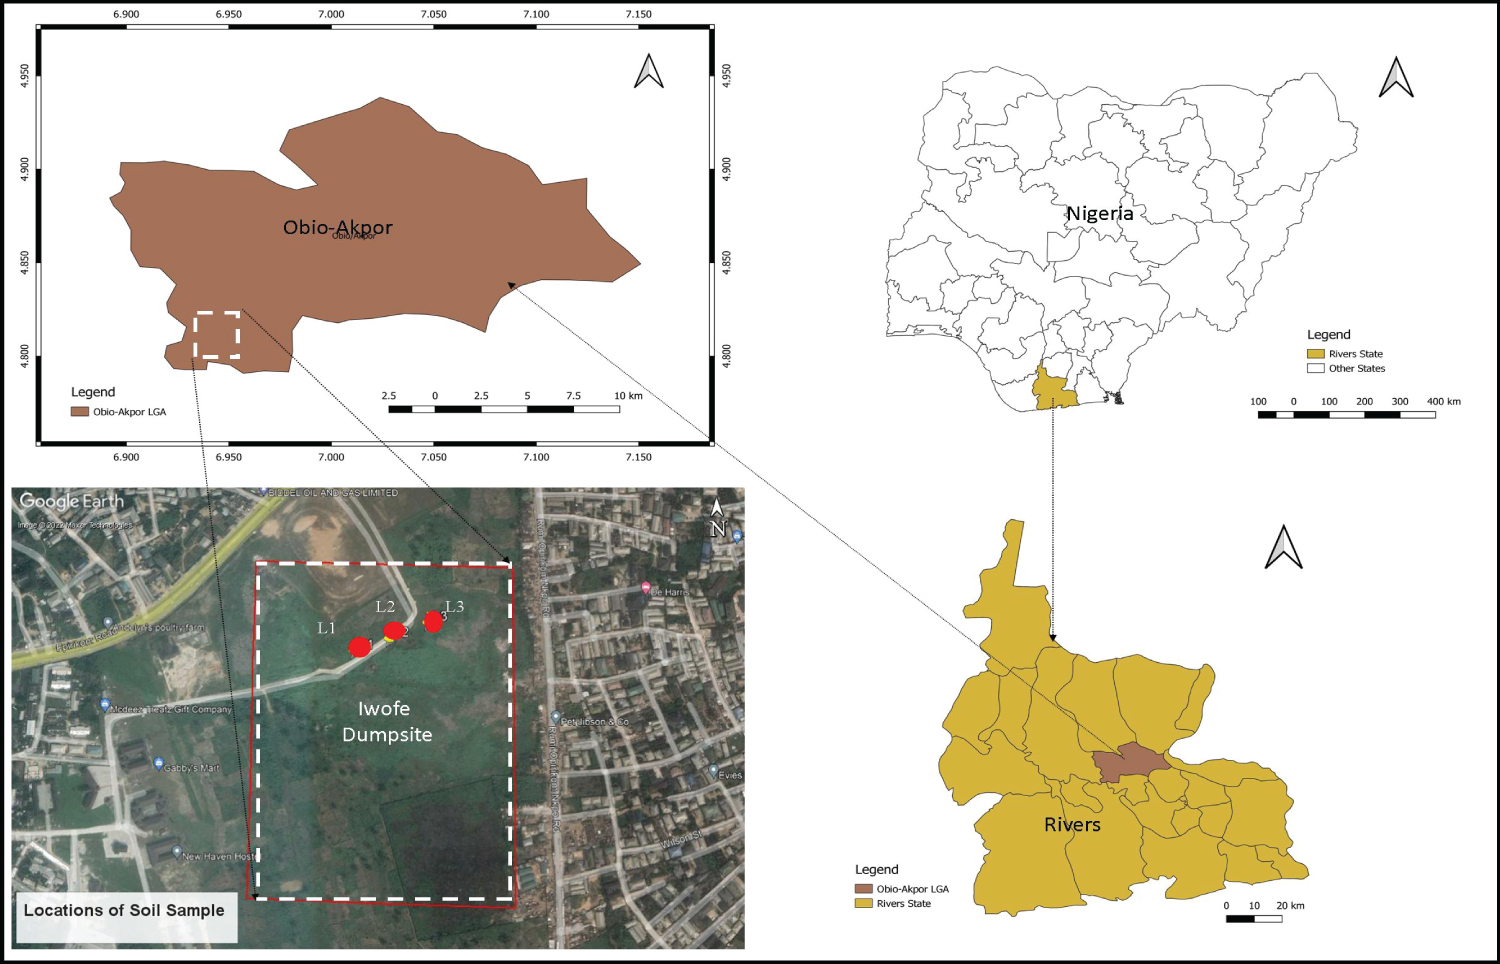 Figure 1: Study area and sampling point location map. View Figure 1
Using a hand auger, soil samples were collected within 0-15 cm depth at a point distance of 40 m, 80 m, and 120 m after an endpoint was identified at the dumpsites. Ten (10) soil samples were collected within a 10 m radius of the points at the point distance and thoroughly mixed to form the composite soil sample for the point. At the end of sample collection, three (3) composite samples were taken, bagged with polythene materials, labeled adequately, and taken to the laboratory analysis.
The collected samples were prepared for analysis using the acceptable and standard procedure described by [3]. The soil pH and electrical conductivity were determined using International Organization for Standardization (ISO 10390 and ISO 11265 respectively) method while the Concentration of heavy metals (As, Cd, Zn, Mn, Cu, Co, Cr, Ni, and Pb) from the digested soil was analyzed using ISO 18227 method. The soil analysis was done at the University of Port Harcourt laboratory, and all heavy metals concentrations were expressed in mg/kg.
Various quantitative indices were used to assess the heavy metal contamination in the soil of the abandoned dumpsite. These indices include:
i. Contamination Factor (CF)
CF was adopted to ascertain the extent of soil contamination with heavy metals. CF is expressed;
Where; Cn = Concentration of heavy metals in soil samples and Bn = Background value of heavy metals in a natural state. The heavy metals are classified based on the CF as CF < 1: Low, 1 ≤ CF < 3: Moderate, 3 ≤ CF < 6: Considerable High, and CF ≥ 6: Very High [32].
ii. Enrichment Factor (EF)
EF can differentiate between metals from anthropogenic activities and those from natural sources [33]. The enrichment factor of the metals was calculated as the ratio of elemental sediment concentration normalized to a reference Mn. EF is expressed as;
Where; Cx = Concentration of HM content in the anthropogenic impacted soil, Cref = Concentration of referenced metal in the anthropogenic impacted soil, Bx = Concentration of HM content in the undisturbed soil, and Bref = Concentration of referenced metal in the undisturbed soil. The heavy metals are classified as EF < 1: Zero Enrichment, 1 ≤ EF < 3: Less Enrichment, 3 ≤ EF < 5: Moderate Enrichment, 5 ≤ EF < 10: Moderately Enrichment, 10 ≤ EF < 25: High Enrichment, 25 ≤ EF < 50: Very High Enrichment and EF > 50: Exceptionally High Enrichment [14].
iii. Geo-Accumulation Index (Igeo)
Igeo estimated the contamination magnitude of the heavy metals in the anthropogenic impacted soil/sediment. Igeo is expressed thus;
Where; HMs = Samples heavy metal concentration, HMs = Reference heavy metal concentration and 1.5 = Constant. The heavy metals are classified as Igeo ≤ 0: No Pollution, Igeo (0-1): Moderate Pollution, Igeo (1-2): Strong Pollution. Igeo (2-3): High Pollution, Igeo (3-4): Very High Pollution, Igeo (4-5): Severe Pollution, and Igeo ≤ 5: Extreme Pollution [14,34].
iv. Pollution Load Index (PLI)
PLI was adopted to estimate the extent of pollution among the sampled soil/sediment from different locations based on the time factor. PLI is expressed as:
Where PLI = Pollution Load Index, CF = Contamination factor, and n = number of elements. The PLI > 1 indicates pollution, while PLI < 1 indicates no pollution [4].
v. Ecological Risk Index (ERi)
ERi is expressed as the given product of the contamination factor (CF) of the heavy metals and toxicological response factor (Tr) of each heavy metal [35], and its expressed as thus;
Heavy metals' ERi was classified as ERi < 30: Low Ecological Risk, ERi: 30-60: Moderate Ecological Risk, ERi: 60-120: Considerable Ecological Risk, ERi: 120-240: High Ecological Risk, and ERi > 240: Significantly Ecological High Risk [14].
vi. Modified Ecological Risk Index (MERI)
MERi is expressed as the given product of the enrichment factor (EF) of the heavy metals and toxicological response factor (Tr) of each heavy metal [14], and its expressed;
The heavy metal MERi was classified as MERi < 40: Low Ecological Risk, MERi 40-80: Moderate Ecological Risk, MERi 80-160: Considerable Ecological Risk, MERi 160-320: High Risk, and MERi > 320: Very High Ecological Risk [14].
vii. Potential Ecological Risk Index (PERi)
PERi is expressed as the summation of the enrichment factor (EF) of the heavy metals, and its expressed;
The heavy metal PERi was classified as PERi < 150: Low Ecological Risk, 150 ≤ PERi 4 < 300: Moderate Ecological Risk, 300 ≤ PERi 600: Considerable Ecological Risk, and PERi ≥ 600: Very High Ecological Risk [24].
Assessing the health risk due to exposure to heavy metals in soil can be carried through the daily dose (ADD), the non-carcinogenic target hazard quotient (THQ), hazard index (HI), and lifetime carcinogenic risk (LCR) coefficients for adults and children [36,37]. According to Edokpayi, et al. [38], there are three (3) major human exposure pathways to heavy metals risk: inhalation via nose and mouth, direct ingestion, and dermal absorption through skin exposure. These exposure pathways are common through soil components.
Exposure doses for determining human health risk through these three pathways have been described in the literature [38-40] and can be calculated using Equation 8 as adapted from the US EPA risk assessment guidance for superfund (RAGS) methodology [25,38,39].
Where;
ADD = Average daily dose through ingestion/inhalation/dermal absorption of soil (mg/kg/day); Csoil = concentration of the heavy metals in soil (mg/kg); IngR: Ingestion rate; InhR: Inhalation rate; EF: Exposure Frequency; ED: Exposure Duration; PEF: Particle Emission Factor; BW: Body Weight; AT: Averaging Time; SA: Exposed Skin Area; AF: Skin Adherence Factor and ABF: Dermal Absorption Factor. All values are presented in Supplementary Table 1.
Table 1: Heavy metal concentration of present study compared with past studies. View Table 1
i. Target Hazard Quotient (THQ) and Hazard Index (HI)
Total hazard quotient: THQ is the ratio of ADD (that is, exposure through ingestion/inhalation/dermal absorption of soil) and RfD (chronic reference dose for each metal in mg/kg BW/day), which is typically used to estimate the potential non-carcinogenic risk of metals exposure to humans in different pathways [25].
Where, THQ < 1 considers the exposed population experience no significant health risk.
Hazard Index (HI): HI is the sum of all expected HQs (non-carcinogenic risks) through different pathways and is employed to compute the total potential non-carcinogenic risks of various contaminants [25,41].
When the value of HI ≤ 1 indicates no significant risk of non-carcinogenic effects, however, when HI > 1, there is a probability of non-carcinogenic effects occurring, and the probability increases with a rising value of HI [25].
ii. Carcinogenic Risk (CR) Coefficients
The estimation is that carcinogenic heavy metals determine the health risk through different exposure pathways. It is calculated based on the formula below;
Where CSF: Cancer Slope Factor. TCR < 10-6, TCR > 1 × 10⁻⁴, and 1 × 10⁻⁶ to 1 × 10⁻⁴ indicate no carcinogenic risk, high risk of developing cancer, and acceptable risk to humans, respectively.
The source and distribution of HM across the environmental medium were analysed through statistical tools such as Pearson's Correlation Coefficient (PCC), Cluster analysis (CA), and Principal Component Analysis (PCA) using the Statistical Package for the Social Sciences (SPSS) version 21 platform.
The descriptive statistics of soil properties and heavy metals Concentration across all the sampled locations were estimated, and the outcomes are presented in Supplementary Table 2. The soil properties parameters pH and EC (µS/cm) values ranged from 6.24 to 7.49 and 163 to 664, respectively. The pH values reduce away from the landfills and indicate the soil ranges from acidic to alkaline in nature. pH influences the movement of heavy metals from the soil to the plant [13], and in this case, there will be moderately-high movement from soil to plant. The reported pH values are slight than those reported by [4] for an abandoned landfill. The reported EC indicates dissolved solid Concentration, which is influenced by rainfall and evapotranspiration.
Table 2: Pollution assessment indices estimation. View Table 2
The concentration (mg/kg) of As, Cd, Zn, Ba, Mn, Cu, Co, Cr, Ni and Pb in soil ranged from 2.00 to 4.00, 1.99 to 2.40, 93.4 to 131, 54.6 to 349, 15.1 to 26.2, 2.99 to 4.50, 11.6 to 72.5, 17.0 to 23.4 and 14.6 to 27.9 respectively with mean ± SD concentration of 2.97 ± 1.00, 2.13 ± 0.24, 110.80 ± 18.96, 196.20 ± 147.52, 20.57 ± 5.55, 3.86 ± 0.78, 49.43 ± 33.03, 19.73 ± 3.30 and 22.83 ± 7.19 respectively. The mean concentration of the heavy metals from the soil exceeded the allowable limit by WHO and in order of Mn > Zn > Cr > Pb > Cu > Ni > Co > As > Cd. Comparing the heavy metal concentration of the present study with past studies (Table 1) indicated that all concentrations reported therein are higher than those reported by [4,14], while the Concentration of As, Cr, Pb, Mn, and Cr reported by [3,13] were higher.
Various pollution assessment indices were estimated based mean Concentration of heavy metals in soils and presented in Table 2 and Figure 2. The estimated CF and ER for individual locations are presented in Supplementary Table 3. The CF values of As, Cd, Zn, Mn, Cu, Co, Cr, Ni, and Pb were 1.65, 14.2, 1.56, 3.50, 0.82, 0.09, 1.41, 0.98, and 1.14, respectively. Metals such Cu, Co, and Ni as CFs of low contamination factor (CF < 1), As, Zn, Cr, and Pb as CFs of moderate contamination factor (CF < 3), while Mn and Cd indicated considerable high contamination factor (CF > 3) and very high contamination factor (CF > 6). The CFs of the soil heavy metals descended in order of Cd > Mn > As > Zn > Cr > Pb > Ni > Cu > Co. The PLI values of As, Cd, Zn, Mn, Cr, and Pb are > 1, indicating a polluted soil with heavy metals, while Cu, Co, and Ni are < 1, implying that the metals are no pollution to the soil. As noted by Alsafran, et al. [24], Igeo is used to evaluate the extent of metals in polluted soil, and for this study, the Igeo for As, Cd, Zn, Mn, Cu, Co, Cr, Ni, and Pb was 0.04, 0.98, 0.02, 0.37, -0.26, -1.19, -0.03, -0.18 and -0.11 respectively. The Igeo values descended as Cd > Mn > As > Zn > Cr > Pb > Ni > Cu > Co while metals such as Cu, Co, Cr, Ni, and Pb are classified as “no pollution”; however, As, Cd, Zn, and Mn exhibited “moderate pollution” to the soil.
 Figure 2: Pollution assessment indices of heavy metals.
View Figure 2
Figure 2: Pollution assessment indices of heavy metals.
View Figure 2
Table 3: Average daily dose for adults and children. View Table 3
The EF is concerned with the extent of anthropogenic influence in the heavy metal pollution of an area. In this study, metals such as As, Zn, Cu, Co, Cr, Ni, and Pb have EF < 1 hence zero enrichment, while Mn and Cd have EF ≤ 1 and ≥ 3, therefore has less and moderate enrichment, respectively. The implication has been that EF > 1 can be attributed to the influence of anthropogenic activities while EF ≤ 1 can be attributed to natural phenomena such as weathering [24]. In general, the EF of the studied soil descended as Cd > Mn > As > Zn > Cr > Pb > Ni > Cu > Co.
The ER in this present study indicated that As, Cd, Zn, Mn, Cu, Co, Cr, Ni, and Pb have the value of 16.5, 426, 1.56, 3.50, 4.1, 0.45, 2.82, 4.9, and 5.7 respectively. All metals in the soil showed low ecological risk with ERi < 30 except Cd with ERi > 240, indicating significantly high ecological risk. The MERi and PERi of the study ranged from 0.15 to 110.0 and 4.69 to 1276.2, respectively, indicating low ecological risk for all the metals in the soil except Cd with MERi of moderate risk and PERi of very high ecological risk.
In individual soils, ADD for metals (As, Cd, Zn, Mn, Cu, Co, Cr, Ni, and Pb) were estimated for three exposures (ADDing, ADDinh, and ADDDerm) and presented in Supplementary Table 4. The mean ADD for the three exposures for adults and children was presented in Table 3, which shows that the ADD descended as follows: ADDing > ADDDerm >ADDinh, for both adults and children. The outcome implies that adults and children are more exposed to heavy metals in the soil through ingestion and dermal than inhalation, which shares similarities with the finding of [24,25].
Table 4: Target Hazard Quotient (THQ) and Hazard Index (HI) for adult and children. View Table 4
The THQ and HI of the metals in the soil were presented in Table 4, and the supporting estimation for the THQ was presented in Supplementary Table 5. The THQ for adults indicated values ranged from 8.68 x 10⁻⁴ to 2.36 × 10⁻¹ for THQing, 7.8 × 10⁻¹⁰ to 1.68 × 10⁻⁴ for THQinh, and 9.84 × 10⁻⁴ to 9.84 × 10⁻⁴ for THQDerm. The trend of THQ-adult descended as THQDerm > THQing > THQinh while the overall THQ < 1 indicates that the exposed population experience no significant health risk. The THQ for children indicated values ranged from 6.2 × 10⁻³ to 1.69 for THQing, 2.77 × 10⁻⁸ to 2.28 × 10⁻⁴ for THQinh, and 5.79 x 10⁻⁵ to 2.28 × 10⁻² for THQDerm. The trend of THQ-children descended as THQing > THQDerm > THQinh while the overall THQ < 1 indicates that the exposed population experience no significant health risk. The HI values for the adult ranged from 1.41 × 10⁻³ to 4.56 × 10⁻¹ and descended as follows Co > Mn > Zn > Pb > Cr > As > Cd > Cu > Ni for all the metals in the soil. The HI revealed that all metals values are < 1, implying no significant risk of non-carcinogenic effects. The HI values for the children ranged from 1.03 x 10⁻³ to 1.69 and descended as follows Mn > Cd > Co > Cr > Pb > As > Zn > Cu > Ni for all the metals in the soil. The HI revealed that all metals values are < 1, implying no significant risk (NSR) of non-carcinogenic effects except Mn, with HI of 1.69 indicating significant risk (SR) of non-carcinogenic effects in children.
Table 5: Estimated risk of carcinogenic metals in adult and children. View Table 5
CR was estimated risk of carcinogenic metals (As, Cd, Cr, Ni, Pb) in the soil of the abandoned landfill was presented in Table 5 and Figure 3, while supporting estimation was presented in Supplementary Table 6. The CR for adults ranged from 1.12 × 10⁻⁷ to 1.94 × 10⁻⁵ for CRing, 1.91 × 10⁻⁹ to 1.36 × 10⁻⁷ for CRinh, 4.48 × 10⁻¹⁰ to 4.79 × 10⁻⁷ for CRderm. The trend of CR-adult descended as CRing > CRinh > CRderm. The TCR-adult for As, Cd, Cr, Ni, and Pb have values 2.89 × 10⁻⁷, 1.87 × 10⁻⁵, 1.49 × 10⁻⁵, 1.95 × 10⁻⁵, and 1.22 × 10⁻⁷, respectively. Carcinogenic metals such as Cd, Cr, and Ni are deemed no carcinogenic risk (NCR) where TCR < 10-6 while As and Pb was deemed significant acceptable risk (SAR) where TCR: 1 × 10⁻⁶ to 1 × 10⁻⁴. TCR-adult of the abandoned soil carcinogenic metals descended as follow: Ni > Cd > Cr > As > Pb. The CR for children ranged from 2.01 × 10⁻⁷ to 3.47 × 10⁻⁵ for CRing, 1.48 × 10⁻¹⁰ to 2.43 × 10⁻⁸ for CRinh, 5.62 × 10⁻¹⁰ to 6.01 × 10⁻⁷ for CRderm. The trend of CR-adult descended as CRing > CRderm > CRinh. The TCR-children for As, Cd, Cr, Ni, and Pb have values 5 × 10⁻⁶, 3.31 × 10⁻⁵, 2.62 × 10⁻⁵, 3.48 × 10⁻⁵, and 2.01 × 10⁻⁷, respectively. Carcinogenic metals such as Cd, Cr, and Ni are deemed no carcinogenic risk (NCR) where TCR < 10-6 while As and Pb was deemed significant acceptable risk (SAR) where TCR: 1 × 10⁻⁶ to 1 × 10⁻⁴. TCR-adult of the abandoned soil carcinogenic metals descended as follow: Ni > Cd > Cr > As > Pb.
 Figure 3: Estimated risk of carcinogenic metals in adult and children.
View Figure 3
Figure 3: Estimated risk of carcinogenic metals in adult and children.
View Figure 3
Table 6: Pearson's Correlation Coefficient (PCC) analysis. View Table 6
Heavy metals' source and distribution patterns were analyzed using the PCA and HCA analysis. The PCA analysis, including Pearson's correlation coefficient (PCC), rotation component matrix of HM, and screen plot, are summarised and presented in Table 6, Table 7 and Figure 4. Pearson correlation mix indicated that as has significant positive relationship (> 0.7) with Pb with an r-value of 0.756 and a weak positive relationship (< 0.7) with Ni (r = 0.217). Furthermore, a significant positive relationship exists between Zn with Mn, Cu, Co, Cr and Ni, Mn with Cu, Co, Cr and Ni, Cu with Co, Cr and Ni, Co with Cr, and between Ni with Pb. All other heavy metals relationships are either weak positive relationships or negative relationships. All metals of strong correlation indicated similar sources and distribution patterns [7].
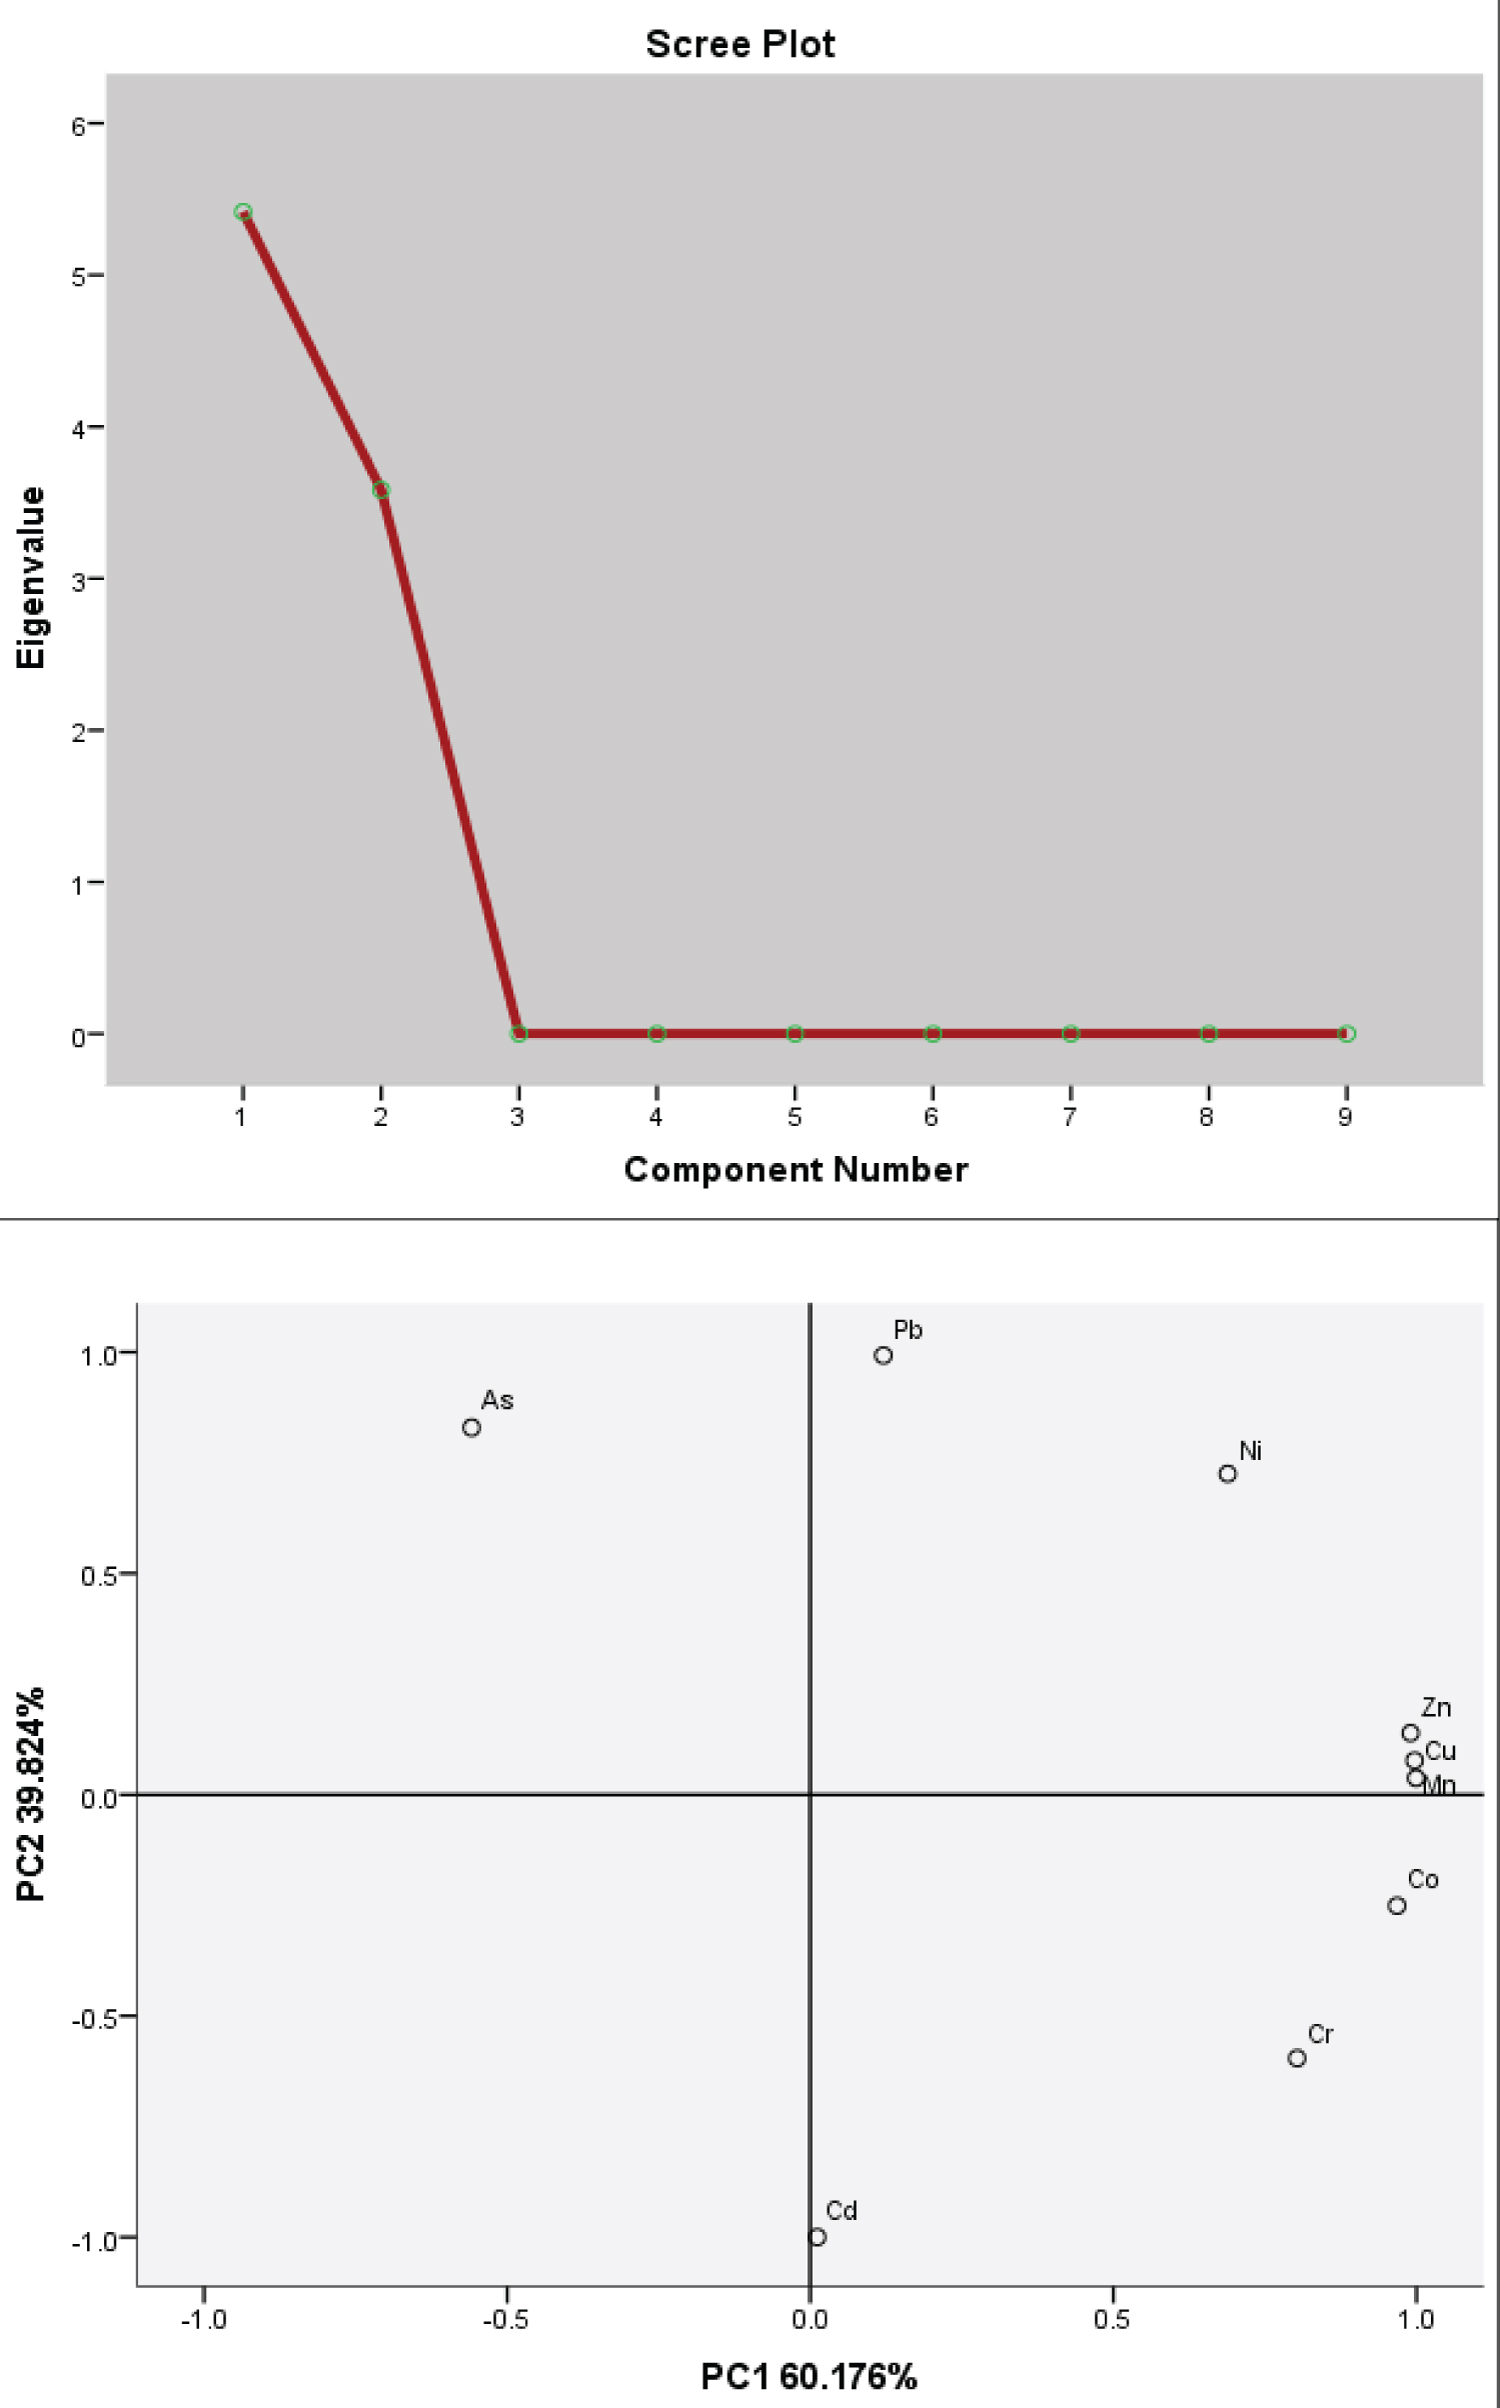 Figure 4: Scree plot of eigenvalues after PCA and rotated component matrix of HMs.
View Figure 4
Figure 4: Scree plot of eigenvalues after PCA and rotated component matrix of HMs.
View Figure 4
Table 7: Rotation component matrix of HM across the environmental mediums. View Table 7
The principal component (PC1) indicated 60.176% of the variance while all the HM as strong positive correlations (Co: 0.997, Cu: 0.976, Mn: 0.967, Zn: 0.949, Cr: 0.897) while Pb showed no correlation and Cd, Ni and as revealed a weak correlation (0.191, 0.547) and negative correlation respectively. The eigenvalues indicated that the PC1 has > 1 and constitutes 60.176% of the total variance.
The principal component (PC2) indicated 39.824% of the variance, while the HM with strong positive correlations includes Pb (0.998), Ni (0.837), and as (0.715), while other HM showed weak positive and negative correlation except for Co with no correlation. The eigenvalues indicated that the PC2 has > 1 and constitutes 100.00% of the total variance. PCC analysis which showed a significant positive correlation among HMs illustrated similarities in their sources and distributions. Ustaoglu, et al. [42] noted that a strong correlation between and among HMs could imply the same sources and distribution pattern, while a lack of correlation implies the opposite. Therefore, HM such as Co, Cu, Mn, Zn, and Cr are said to have similar sources, and it is lithogenic, which explains their weak and no correlation with HM such as Pb, Cd, Ni, and as. Similarly, the strong correlation between Pb, Ni, and As revealed a similar source and pattern, and it is an anthropogenic source explaining the weak and no correlation with HM such as Co, Cu, Mn, Zn, and Cr.
Based on HCA, four groups were identified based on Euclidean distance and absolute correlation distance using similarity as the criterion (Figure 5). The first group was As, Cd, Co, Cu, Ni, and Pb, the second was Cr and Cd, the third was Zn, and the fourth was distinctly associated with Mn. The outcome revealed various levels of lithogenic and anthropogenic origins of the related metals.
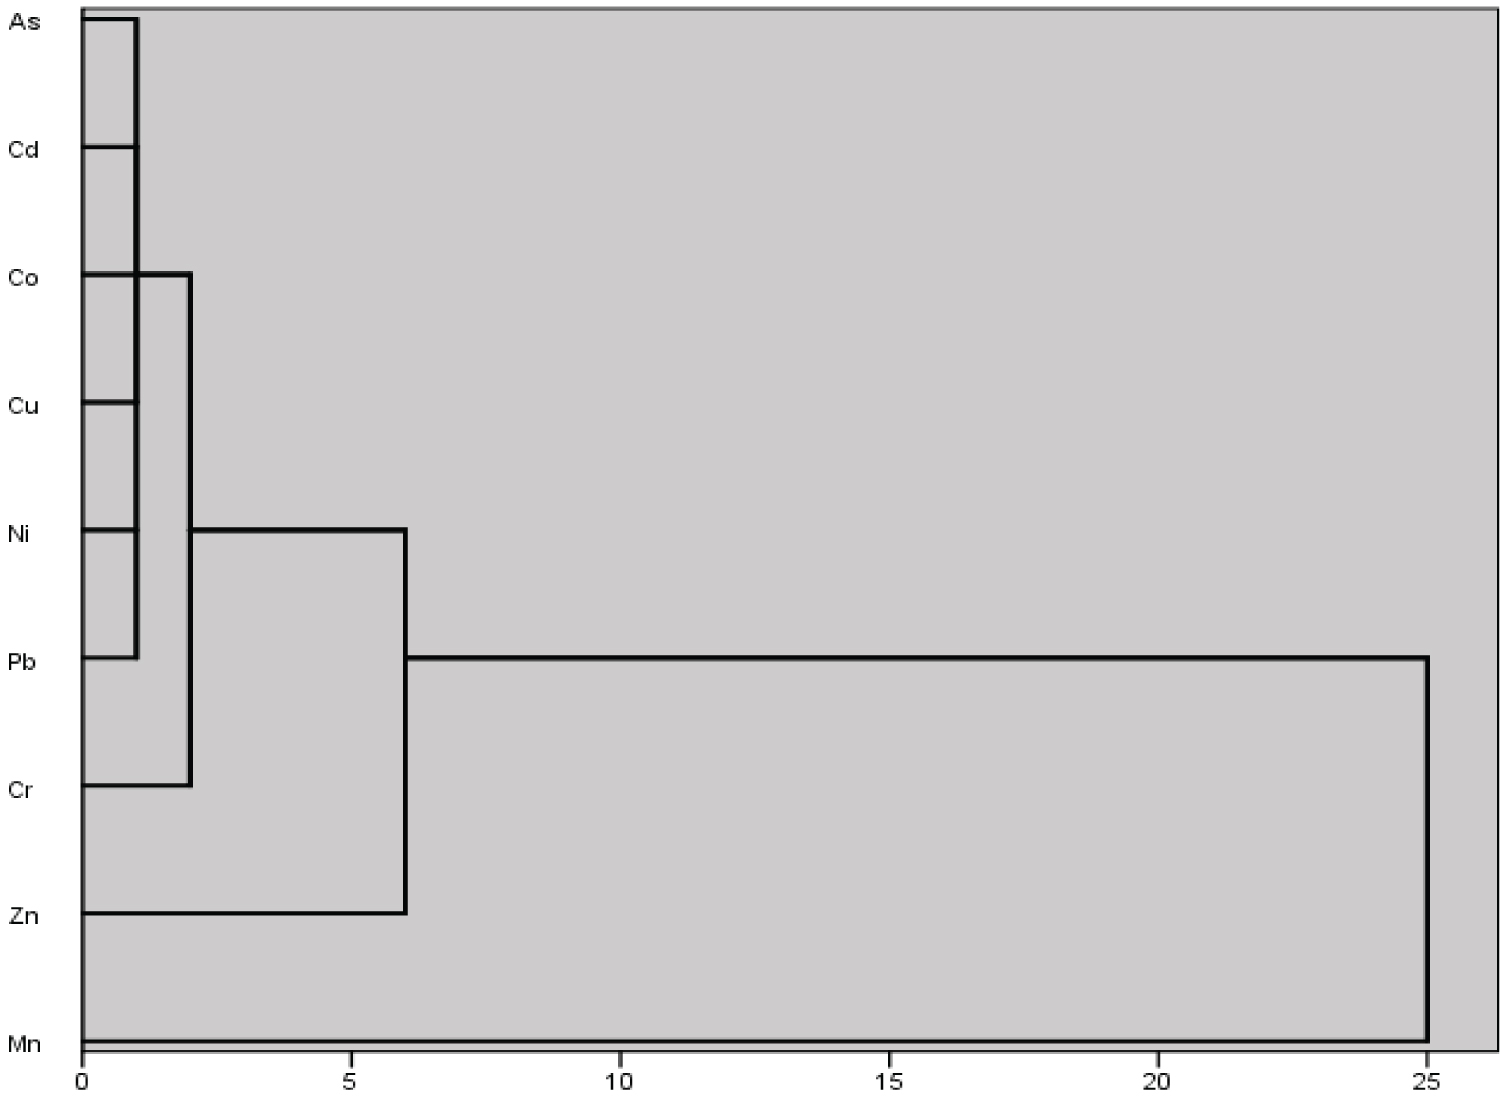 Figure 5: Dendrogram of a complete linkage of all the parameters. View Figure 5
The soil quality is impacted due to the landfill activities, and heavy metals tested exceeded the WHO acceptable standard. The pollution status of the soil can be deemed contaminated as the heavy metals showed low, moderate, to high CF. Regarding EF and ER factors, the soil indicated no enrichment and low ecological factor except for Cd with moderate EF and low ER. Although the soil is deemed contaminated and shows no significant risk of non-carcinogenic effects to adults and children; however, Mn was estimated to have a significant risk on children. The soil showed no carcinogenic effect on adults and children as the assessment indicated no risk to acceptable risk. Overall, the soil from the anthropogenically impacted site was contaminated and not fit for human activities. Therefore, there is a need for environmental management and remediation action before using such an environment. However, engaging the environment through sustainable practices will ensure efficient waste disposal and management.
All authors equally contributed to the research development of this manuscript, and they have read and agreed to the published version of the manuscript.