Background: In January 2011, the Centers for Medicare & Medicaid Services (CMS) introduced the End-Stage Renal Disease Prospective Payment System (ESRD PPS) with the goal of creating strong economic incentives for Medicare dialysis providers to improve efficiency in the delivery of dialysis treatments, but without compromising quality of care. To date, no formal evaluations have been published of the impacts of the new payment reforms on dialysis center efficiency in the quantity and quality of care delivered in the pre vs. post PPS era. Our objective was to examine whether the goal of improved efficiency in the delivery of dialysis was achieved without compromise to quality of care in the four years following implementation of the End Stage Renal Disease Prospective Payment System (ESRD PPS) in 2011.
Methods: This was a longitudinal facility-level retrospective national cohort study of Medicare-certified free-standing dialysis facilities in the United States that offered in-center hemodialysis between 2007 and 2014, using Data Envelopment Analysis (DEA) to estimate annual facility relative technical efficiency, and using the DEA-based Malmquist Productivity Index to assess changes in productivity year over year. Models measured changes in efficiency in the production of dialysis treatments as well as in the delivery of select quality of care measures (dialysis adequacy, anemia management, avoidance of infections and days hospitalized). Treatment data and cost inputs to the delivery of dialysis treatments were obtained from Medicare Renal Cost Reports. Clinical and quality outcomes data were obtained from annual Dialysis Facility Reports. A stratified national sample of 935 facilities with complete data for at least seven of the eight study years was selected for inclusion.
Results: Modeling dialysis treatments as the only output, productivity improved by 19.9% from 2007 to 2014, with 78% of this improvement occurring after 2010. When also including quality measures as outputs, productivity gains were slightly reduced to 15.7%. Three of the four quality measures showed small improvements in both the pre and post-PPS periods. The quality measure for anemia management declined by 12.8% across the entire study period.
Conclusion: Enactment of the ESRD PPS appears to have achieved the objective of improved dialysis center productivity without compromising quality. Subsequent regulatory changes and further industry consolidation may influence efficiency and quality of care in the post-study period. Ongoing monitoring of these effects should be continued.
Dialysis, Efficiency, Organizational, Quality of care, Prospective payment system, Anemia
End Stage Renal Disease (ESRD) is defined as a permanent state of kidney disease severe enough to require chronic kidney replacement therapy (dialysis or kidney transplantation) to sustain life. In the United States (US), the ESRD population is the largest of any country in the world [1] and prevalence continues to rise, reaching 746,557 cases in 2017 [2]. As of December 2017, only 30% of ESRD patients had a functioning kidney transplant, while 70% (about 521,000 cases) were on dialysis [2]. Although comprising just 1.3% of the Medicare population, the ESRD population accounted for 7.2% of total Medicare fee-for-service spending in 2017 [2]. Costs of the Medicare ESRD program have sky-rocketed from just $229 million in 1973 [3] to almost $36 billion in 2017 [2].
The rapid growth in Medicare spending for ESRD care, and dialysis in particular, led to a series of payment reforms over the past several decades, beginning with the introduction of a composite payment rate per treatment in 1983 and, most recently, in January 2011 - the first major payment reform since the 1980s - which included prospective bundled payments and pay-for-performance around quality of care. These programs, known as the ESRD Prospective Payment System (PPS) and Quality Incentive Program (QIP), created strong economic incentives for Medicare providers to improve efficiency in the delivery of dialysis treatments, but the incentives to promote better quality of care were more limited.
The effects on quality of care of provider responses to reduced payments has been monitored by CMS via periodic retrospective system-wide claims-based reports [4] as well as through the provider-level pay-for-performance QIP program. Analysis of efficiency of dialysis providers in the US and knowledge of factors impacting efficiency have been limited to only a few studies, all set in the pre-PPS era [5-8]. And, although Medicare announced plans as early as 2012 to include efficiency measures in the ESRD QIP, they also acknowledged that they were unaware of any appropriate efficiency measures for the ESRD population [9].
The most immediate and notable provider response to the new payment reform was to decrease costs through reduced use of ancillary drugs used in the treatment of conditions related to ESRD including anemia [10]. Efficiency improvement through technological innovation, if it occurred, was less easily measured or observed than withholding of care. However, the drug use reductions were easily measured and led to further payment cuts beginning in 2014, as CMS recognized that the bundled payment rate once again exceeded the cost of dialysis care. Under such a payment system, finding and implementing new efficiencies beyond reducing utilization of ancillary services may be required to maintain long-term financial solvency.
Given these industry dynamics of ongoing demand for improvements in the efficiency and productivity of dialysis care in the face of flat or falling payments, and the potential adverse impacts to quality of care, this study’s aim was to evaluate whether the implementation of the ESRD PPS led to improved efficiency of US dialysis centers, and whether trade-offs were made between economic efficiency and quality of care.
This was a retrospective national cohort study of US Medicare-certified free-standing dialysis centers, examining trends in productivity in the delivery of dialysis-related care in the years surrounding the January 1, 2011 implementation of the ESRD PPS (2007-2014). Trend differences for the relationship between resource use and the delivery of dialysis-related care were analyzed using Data Envelopment Analysis (DEA) and the DEA-based Malmquist Productivity index that evaluates changes in efficiency and technology over time. In addition to production of dialysis treatments as the primary output of these centers, facility-level clinical and process metrics that reflect quality of care outcomes were included as additional output measures.
Treatment data and cost inputs for the delivery of dialysis treatments were obtained from the 2007-2014 Medicare Renal Cost Reports [11,12]. The cost reports include all costs incurred by dialysis centers for treating all patients, independent of their insurance status. Quality of care output metrics for each facility were sourced from the annual Dialysis Facility Reports, which are created under contract to CMS to provide dialysis facilities, consumers, and the public with information on patient characteristics, treatment patterns, hospitalization, mortality, and transplantation patterns in Medicare certified dialysis facilities [13]. Facility characteristics were obtained from the cost reports.
The provider population on which this study was based was the 6,187 Medicare-certified, free-standing dialysis providers in the US that offered in-center dialysis to patients with ESRD between 2007 and 2014. Hospital-based dialysis programs were excluded due to very different cost characteristics and the diversified nature of the health care outputs produced by general care hospitals. Home-only dialysis programs were considered to be a different business model/market with a different cost structure as well and were excluded from the study.
The study period was centered around the date of implementation of the Medicare ESRD PPS which took effect on January 1, 2011. The study therefore included a four-year "pre-PPS" period of 2007-2010 and a four-year "post-PPS" period of 2011-2014. A primary endpoint for the study was to examine changes in relative efficiency and productivity of the industry in the "pre" vs. "post" PPS period. Not all centers were operating for the full eight-year study period. Consequently, a representative sample of facilities that were present in the data set for at least seven consecutive years during the study period was used, to ensure that comparisons made over time were being conducted for the same set of facilities.
Dialysis facilities have relatively fixed demand for services since their market is limited to people in need of chronic dialysis with a relatively fixed frequency of service. Due to fixed demand, this is a Variable-Returns-to-Scale (VRS) market; that is, changes to inputs do not result in proportional change in outputs [14]. VRS reflects the fact that production technology may exhibit increasing, constant and decreasing returns to scale [15]. Efficiency in dialysis-related care is usually viewed from the perspective of technical efficiency, which is the effectiveness with which a given set of inputs is used to produce an output. Based on the market characteristics outlined above, and consistent with prior research [5,6,8,16], we used input-oriented VRS DEA models. The DEA models were used to analyze the outputs (the number of dialysis treatments produced and various measures of quality-of-care delivery), against cost inputs. The unit of analysis is the dialysis facility (termed the Decision-Making Unit or DMU) for a one-year time period. Relative efficiency is measured against the most efficient DMUs, which define the best practices frontier.
The DEA-based Malmquist Productivity Index was used to analyze changes in productivity over time (i.e. - from one year to the next). The Malmquist Productivity Index has two parts. The efficiency component of the Index evaluates changes in the relative distance between a DMU and the most efficient DMUs for the segment of the industry to which it is compared (also called the "catching-up effect"). The technology (innovation) component of the Malmquist Index measures how the best-practices frontier moves from year to year. Productivity change is defined as the combined effects of the efficiency and technology components of the index.
Inputs: One challenge in DEA analysis is to specify a set of input and output variables that minimize the risk of over-optimization of the efficiency measure. Since DEA will seek an optimal combination of inputs and outputs for each DMU that could potentially be technically efficient, it is important that the potential combinations of inputs and outputs are realistic. For example, a relatively low value for an input, i.e., a low cost, can be used as evidence for technical efficiency by the DEA model. Models with a high number of input variables (especially where the input variables are highly correlated) result in less differentiation between DMUs and place more DMUs on the efficiency frontier, perhaps incorrectly so. This problem was addressed using several techniques in the selection of input variables. Some key considerations in the selection process included:
Avoidance of multicollinearity of input variables - Input variables with very high correlations were examined for possible combining into single inputs.
Avoidance of variables with a high proportion of missing values.
Reduction in the number of input variables, especially relatively small average cost inputs. For example, we combined small cost centers for drugs and supplies into a single variable.
The six final model inputs used were:
• Compensation Costs (Salaries + Benefits) for Direct Patient Care Staff
• Capital Costs (Buildings & Fixtures)
• Dialysis Machine Costs
• Operations and Maintenance of Plant
• Ancillary Clinical Costs (Drugs and Supplies)
• Administrative & General and Other Costs
Outputs: Outputs produced by dialysis centers include not only dialysis sessions or treatments, but ancillary services in the treatment of comorbidities related to ESRD and/or resulting from the delivery of dialysis itself. In addition to treatments, quality of care measures were included as outputs, to the extent that these measures were collected across the study time frame and the dialysis center has a direct impact on quality of outcomes:
Treatment Dose Adequacy - Percent of Patients with Urea Reduction Ratio (URR) ≥ 65%: On a fundamental level, dialysis must adequately remove wastes and fluids from the blood; thus, the effectiveness of dialysis is referred to as dialysis adequacy. The URR is one measure of how effectively a dialysis treatment removes waste products from the body and is commonly expressed as a percentage. Urea reduction is a result of dialysis. At the facility level, we used the percentage of patients achieving a URR of ≥ 65% as a quality output measure.
Prevention of Access-related Infection: Another aspect of the quality of dialysis care provided is how well facilities can prevent vascular access-related infections, which are infections directly related to dialysis treatment. At the facility level, we created a quality output measure that reports the percent of patients who did not develop an access-related infection, or the "Non-Infection Rate". The higher the non-infection rate, the higher the productivity of a facility on this quality output.
Anemia Management - Percent of Patients with Hemoglobin (Hb) ≥ 10 g/dL: In addition to the provision of (adequate) dialysis to patients, dialysis centers need to manage other patient conditions related to ESRD. Anemia is one of the most prevalent comorbidities due to chronic kidney disease (CKD). Current guidelines for treatment suggest that treatment for anemia of CKD in dialysis patients should be initiated in patients whose Hb has fallen below 10 g/dL [17]. Therefore, a facility-level measure of the output of quality care related to anemia management is the percent of patients with Hb at or above 10.0.
Prevention of Hospitalizations - Average Days Not Hospitalized: The final output measures how productive each facility was at keeping patients out of the hospital. This measure of the average number of days per year that patients were not hospitalized seeks to quantify this quality-of-care component as a positive output of the dialysis center.
Outlier identification and handling: For each input cost variable, data were reviewed for identification of low and high outlier values. Determination of low and high outlier cutoff boundaries for each variable was primarily based on analysis of Medicare renal cost report data conducted in other studies [18]. Outlier cutoffs were selected based on broad but plausible ranges of values for each cost input category. Annual treatment cutoff values were also employed to remove very small (≤ 1000 annual treatments) and very large (> 100,000 annual treatments) facilities from the final sample. Analysis of facilities with outlier values on inputs and/or outputs suggested that they were significantly different enough from the general industry to introduce bias into the results. Therefore, facilities that had outlier values on any input cost categories or on treatments were removed from the sampling frame when selecting the final sample for the DEA and Malmquist studies. We also removed any facilities that had fiscal years that were other than calendar year, to keep the analysis of pre vs. post-PPS implementation with a consistent timeframe for all DMUs.
Sampling method: Once a subset of facilities with at least seven consecutive calendar years of clean complete cost report data (cost inputs and treatments) was identified, we determined that the resultant facility sample was significantly over-weighted - about 90% - with facilities from the two largest dialysis organizations (LDOs). To balance the final study sample with representative weights by key industry characteristics of firm size, profit status, facility size and costs, a 37% stratified random sample was selected from all the LDO facilities. (A facility was defined as “LDO” if it was affiliated with a large dialysis organization for at least 5 of the 8 years in the study period). The LDO facilities were stratified by quartiles on number of treatments and cost per treatment for random sampling from each quartile. LDO facilities were excluded from the random sample if they were missing any quality output measures. This sample limited the LDO facility-year weight to approximately 80% of total, which is near the LDO weight in the current US dialysis industry. All non-LDO facilities were included in the final sample, although two non-LDO facilities were missing quality measures for 2011-2014.
Adjusting costs for inflation: Given the analysis of cost inputs spanned eight years, the effects of price inflation were removed from the cost input data by adjusting all years to 2010 dollars using 2007-2014 cost index data from the ESRD Market Basket Index [19].
Adjusting direct patient care staff compensation costs for geographic wage variations: In order to equitably compare a DMU’s relative resource use to other DMUs from labor markets with significantly higher or lower wage costs, all compensation costs for direct patient care staffing for each year were adjusted by the annual Medicare ESRD Wage Index [20] applicable to each facility’s geographic location.
For this study, six distinct DEA and Malmquist models were selected with varying output measures to compare. All models used the same input variables and differed only in the output measures. For treatments, a single-output model was run. We then combined the outputs into four two-output models with treatments plus one of the four quality of care output measures. The final analysis combined all five output measures into a single model. Output measures from each model included the relative efficiency (DEA) score for each DMU for each year 2007-2014, and the Malmquist index components (technology, efficiency and productivity indices) for each DMU for each year-over-year time period from 2007-2014 (e.g. 2007-2008, 2008-2009, etc).
All the iterations of the DEA and Malmquist models were performed in R, a commonly used statistical software package. Specifically, for the DEA, the Benchmarking with DEA and SFA package was used [21]. For the Malmquist analyses, the Indices of Productivity and Profitability package was used [22].
In addition to including four measures of care quality in the efficiency studies, we examined annual changes in each of the four measures from 2007 to 2014 for the sample of facilities used in the DEA and Malmquist studies, to compare the changes in efficiency to directional trends in the quality of care delivered.
Out of 6,187 free-standing hemodialysis facilities in the US and Puerto Rico with Medicare Renal Cost reports between 2007-2014, 2,136 facilities (1,907 LDO, 229 non-LDO) met initial screening criteria of seven-plus consecutive years with complete cost report data, at least one in-center dialysis station and calendar year cost reporting. As described in the methods, a 37% stratified random sample of 706 LDO facilities was combined with the 229 non-LDO facilities for a final sample of 935 facilities in the study cohort.
Dialysis facility characteristics and input and output variable means for the combined period 2007-2014 are compared for the original full study data set and the final sample of facilities in Table 1. As described in the Methods, the final sample over-weights LDOs and for-profits relative to the industry makeup during 2007-2014 but is otherwise reasonably representative of the industry during that time. Mean values of input (costs) and output variables are also quite similar.
Table 1: Comparison of final facility sample to full 8-year industry data set. View Table 1
Table 2 shows the mean, median and standard deviation of each input and output variable for the final study cohort of 935 facilities (7,324 facility-years). Of note is the relatively low variation in the quality output measures, as indicated by the small standard deviations.
Table 2: Summary statistics on input and output variables: Final five-output model. View Table 2
Table 3 presents summary statistics for the DEA and Malmquist analysis across the full eight-year study period for each of the six models. First looking at the DEA results, on average, across all years a relatively low percentage of facilities were technically efficient. For example, in the Treatments-only model, 13.6% of facilities were deemed efficient (at the efficiency frontier with a DEA score of 1.0). In the combined model with treatments and all quality outputs included (Five-Output Model), the percentage of facilities at the frontier was the highest of all models, suggesting less differentiation between facilities when all outputs were considered. However, by definition, models with more output measures have higher DEA scores, which could result in a higher proportion of units at the frontier.
Table 3: Summary DEA and Malmquist outputs for each model. View Table 3
Looking at the Cumulative Malmquist Index (calculated as the product of the year-over-year Malmquist indices), productivity gains from 2007-2014 when viewed through the lens of treatments plus quality-of-care outputs (Five-Output Model index value of + 15.7%) were about 21% lower than when looking at production of dialysis treatments alone (index value of + 19.9%). Also shown is the breakdown of the Malmquist Index into the Efficiency and Technology components of productivity. Of note is that productivity gains in delivery of dialysis treatments were driven by technology improvement, as well as through efficiency gains. In terms of the Treatments-only model, almost 60% of the productivity improvement from 2007 to 2014 was attributed to the technology component. Similar results are seen in all the multiple output models.
In all models, productivity gains were slight from 2007-2010, but increased significantly going into the PPS in 2011 and continued through 2014 (Figure 1). Modeling treatments as the only output, 78% of productivity improvement occurred after 2010. The largest productivity gains occurred in 2011, the first year of the PPS, with additional gains after 2011. In the Five-Output Model, cumulative productivity gains in the three years leading up to the PPS were 2.1%, while in the first three years after implementation of the PPS cumulative productivity gains were 11.4%. For all the models, most (75-84%) of productivity gains occurred after 2010.
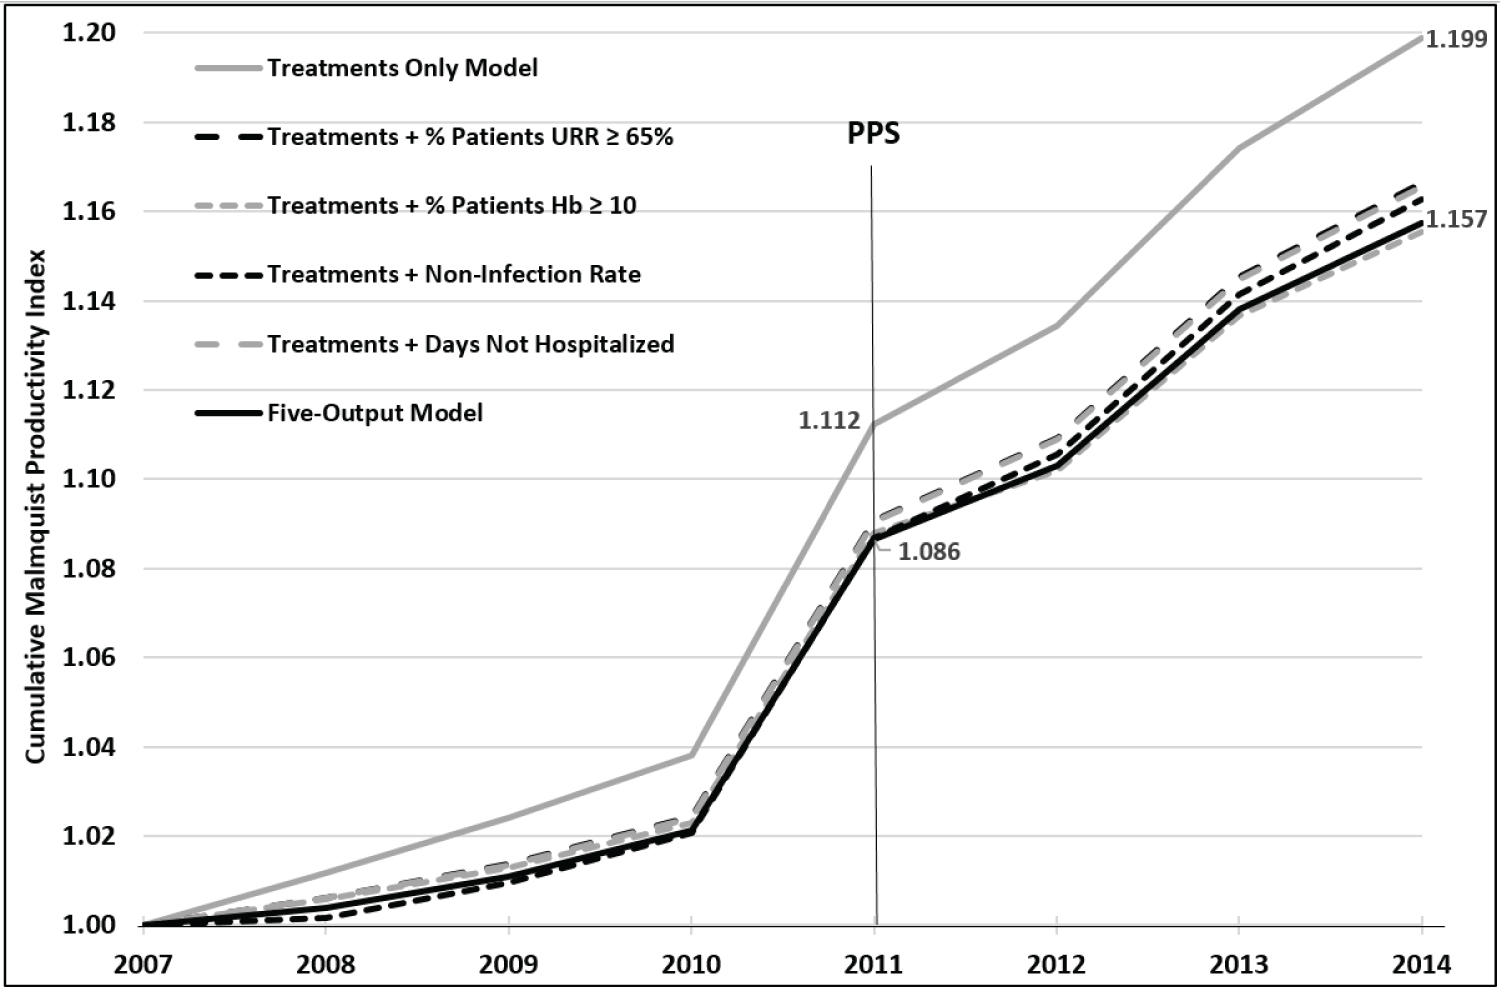 Figure 1: Cumulative malmquist productivity index by model 2007 to 2014.
URR: Urea Reduction Ratio; Hb: Hemoglobin; PPS: Prospective Payment System.
View Figure 1
Figure 2 presents the eight-year trends in the four quality measures included in the efficiency models for the study facility sample. Three of the four quality measures showed small improvements in both the pre- and post-PPS periods. However, the quality measure for anemia management declined by 12.8% across the entire study period.
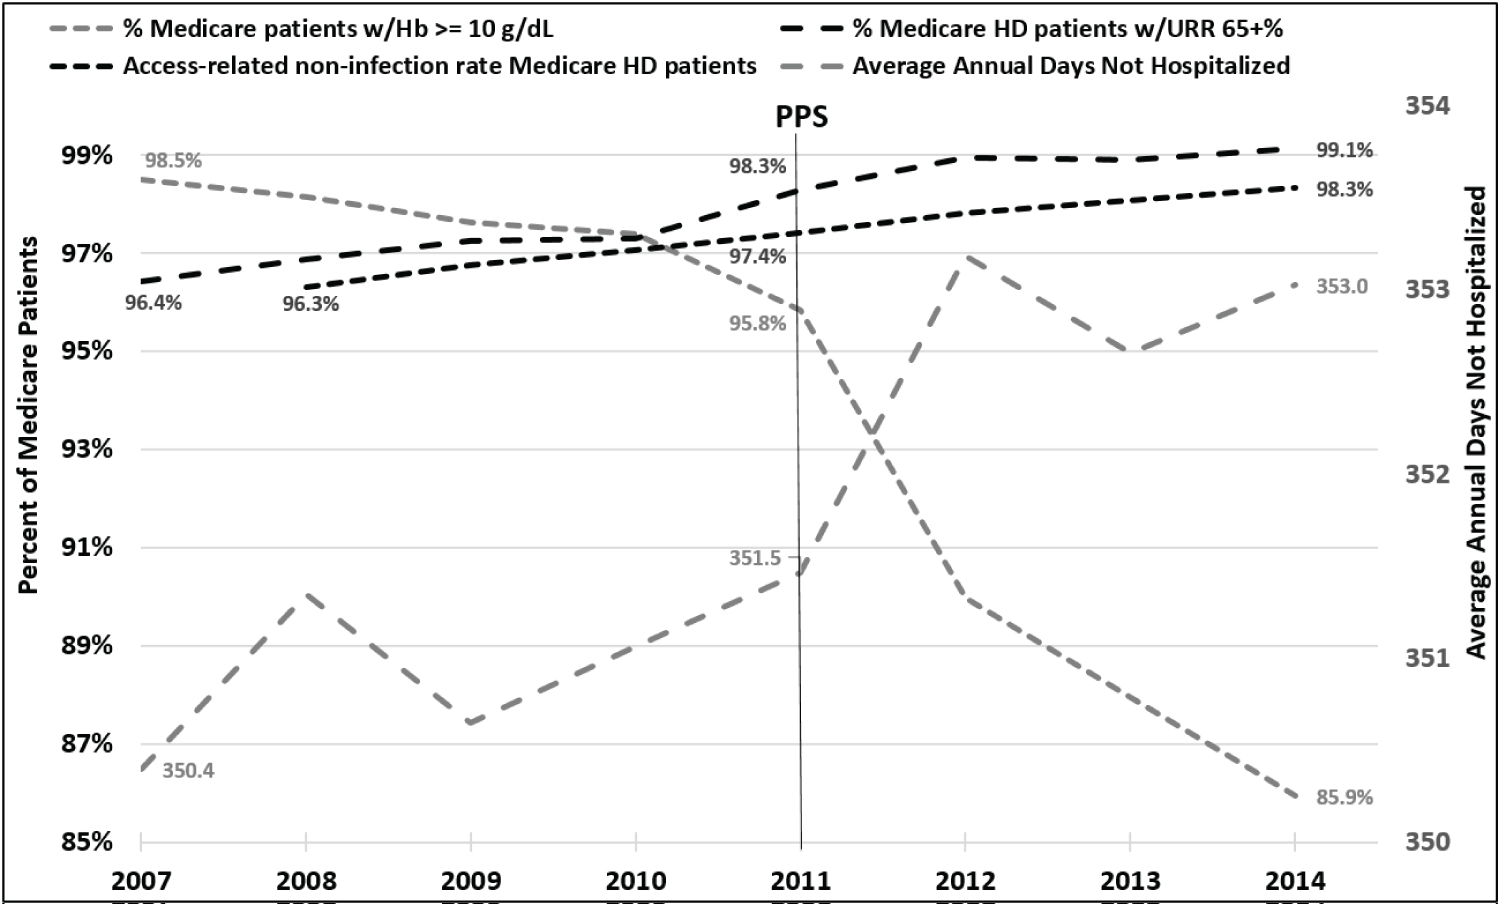 Figure 2: Trends in select quality of care metrics 2007 to 2014: 5 output model.
URR: Urea Reduction Ratio; Hb: Hemoglobin; HD: Hemodialysis; PPS: Prospective Payment System. Infection rates not available for 2007.
View Figure 2
In this study of productivity change in the US dialysis industry in the four years prior to and the four years immediately following the implementation of the ESRD PPS, there is strong evidence for the influence of payment reform on the behavior of affected providers to become more productive in the face of tightening healthcare budgets. The industry’s response was to improve productivity and efficiency not only in the production of dialysis treatments but also in selected quality of care metrics. When combining all outputs into a single efficiency model, the longitudinal productivity gains over the study period were almost 16% on average. Of note is that the largest gains in productivity occurred in 2011, the first year of the PPS, and that productivity gains in delivery of dialysis treatments were driven by technology improvement, as well as through efficiency gains.
This is the first study of this type to include quality measures in the output specification of the efficiency models, and to separately examine trends in the volume of the same quality outputs. Adding quality measures as outputs in addition to treatments tended to diminish efficiency gains over the study period. This may be because these quality measures were "topped out" by 2007, and most facilities had similar scores on these outputs, regardless of inputs. DMUs became more efficient at producing treatments but had less room (or incentive) for efficiency improvement when producing treatments plus higher quality of care. This finding makes sense when you consider the change from a fee-for-service payment system to the ESRD PPS which is based on a case rate, with limited controls on quality.
When comparing the observed productivity gains to the quantitative measures of quality outputs, it appears that changes which improved the technical efficiency of dialysis care generally were not at the expense of reduced quality. The one exception was that facilities were found to reduce the percentage of patients with Hb above 10 g/dl, with a steep decline from 2011 through 2014. Optimal anemia management strategies remain controversial [23,24] and the post-2011 results may also have been influenced by the mid-2011 Food and Drug Administration label change to reduce use of Erythropoiesis-Stimulating Agents (ESAs) [23]. The target Hb level for patients receiving ESA therapy changed from 10-12 g/dL to the use of the lowest ESA dose required to avoid red blood cell transfusions. Therefore, the standard-of-care for the treatment of anemia changed and this shifted the Hb distribution curve to the left resulting in a lower percentage of patients with Hb > 10 g/dL [25]. The ESA label change, which influenced ESA prescribing behavior starting in 2011, may also have contributed to the efficiency and productivity gains in the production of dialysis treatments, as lower ESA use (i.e. - a reduction in the use of an input) was not likely solely influenced by implementation of the PPS in 2011.
This is also the first study to show significant productivity improvements in the US dialysis industry over time. No previously published DEA studies of the US dialysis industry found productivity improvement in the periods reviewed. An early longitudinal analysis using 1994-2000 cost data [6] determined that, over time, facilities did not achieve improvements in productivity. Units became more technically efficient, but technology change was negative. The authors also concluded that dialysis outputs were produced efficiently, but quality of care may have been sacrificed. As described previously, in the treatments-only model, about 60% of the total productivity gains during the eight-year period were attributable to the technology component of the Malmquist index. This suggests that the best practices frontier was improving, whether through advances in technology, management innovation, or other factors.
While significant technological advances have occurred in US dialysis clinical practice since the infamous "God Panels" of the 1960s [26], innovation in the development of new drugs and devices has been more rapid in other health sectors than it has been in the dialysis sector [27]. The introduction of new drugs, diagnostics, and devices during the eight years of this study was historically low, and may have ironically been constrained by the introduction of the bundled PPS payment system. Since the components and reimbursement mechanisms of the payment bundle were fixed with the bundle’s inception by CMS in 2011, there was little incentive to introduce new drugs or devices through 2014 where this study ends. This was true for both new (more expensive) replacements for existing components of the bundle as well as for new clinical innovations. Rather, the likely drivers of improvement in the best practices frontier were due to better clinical decision-making, better resource management, and regulatory changes such as the change in ESA prescribing labels. Implementation science, the science of applying research findings and evidence-based interventions to routine clinical practice, plays a role in evolving care by translating new techniques, protocols, and clinical insights into general practice, even in an environment of static technology [27,28].
Another contributing factor might be industry consolidation leading to achievement of further economies of scale in the procurement of inputs to dialysis care. During the past three decades, the US dialysis industry has undergone tremendous market structural changes, with the share of independently owned and operated dialysis facilities falling from 86% to 21% [29] and the two largest publicly traded corporations, DaVita and Fresenius, now owning or managing close to 80% of facilities. This consolidation of providers into larger for-profit chains may have contributed to the changes in the efficient best practices frontier. Studies have shown that for-profit facilities appear to consume lower resources, [30] and differences have been shown by organizational status in many facets of renal care including anemia management, the use of injectable drugs [29], and skill level of staff [7]. However, there are ongoing concerns about effects on patient outcomes and care quality associated with continued industry consolidation into ever larger for-profit chains [29,31,32], and such effects need to be continuously monitored.
This study has a few limitations which should be noted. First, as previously mentioned, DEA is very sensitive to errors and outliers in the study data set and requires careful review of all data, and careful specification of model inputs and outputs. Our review of the cost report data resulted in discarding a large number of potential observations due to poor data quality. This may have introduced some sampling bias. For example, we found that cost report data quality was higher in certain firms, which consequently may have been over-weighted in the final sample. A second limitation was that the models did not include input measures to adjust for variability in patient case mix (i.e. - input requirements) across facilities. Finally, the proxy measures for quality of care that were available for this study were limited to what was reported across the full study period. Better quality measures are needed to validate our findings.
Enactment of the ESRD PPS beginning in 2011 appears to have initially achieved the objective of improved dialysis center efficiency, generally without compromising quality of care. However, regulatory changes and continued dialysis industry consolidation may continue to influence efficiency and quality of care in the post-study period. Ongoing monitoring of these effects should be continued. The novel approach to the measurement of performance on both the efficient delivery of dialysis treatments as well as maintenance of quality of care outlined in this paper is well-suited to such ongoing monitoring.
This study was funded by a grant from the Agency for Healthcare Research and Quality (AHRQ). Grant HS024190 - Impact of the ESRD PPS reform on efficiency of dialysis providers and the impact on quality of care and patient outcomes. JMS has received funding from Medical Technology & Practice Patterns Institute for preparation of this manuscript. The authors report no conflicts of interest in the development, content and publication of this study.
This study was funded by a grant from the Agency for Healthcare Research and Quality (AHRQ). Grant HS024190 - Impact of the ESRD PPS reform on efficiency of dialysis providers and the impact on quality of care and patient outcomes. JMS has received funding from Medical Technology & Practice Patterns Institute for preparation of this manuscript.
The authors met the ICJME criteria for authorship including conception and design or analysis and interpretation of data, drafting of the manuscript or revising it critically for important intellectual content and final approval of the manuscript.